| Param | Original file | Final file |
|---|---|---|
| Filename | modeM0/AS1A12_035T02_9000005676_41483cztM0_level2.fits | modeM0/AS1A12_035T02_9000005676_41483cztM0_level2_quad_clean.evt |
| Size (bytes) | 1,786,717,440 | 403,220,160 |
| Size | 1.7 GB | 384.5 MB |
| Events in quadrant A | 14,164,845 | 2,732,238 |
| Events in quadrant B | 14,081,546 | 2,731,334 |
| Events in quadrant C | 18,513,664 | 2,527,890 |
| Events in quadrant D | 17,407,207 | 2,462,004 |
| Mode SS | |||
|---|---|---|---|
| Quadrant | BADHDUFLAG | Total packets | Discarded packets |
| A | 0 | 522 | 0 |
| B | 0 | 522 | 0 |
| C | 0 | 522 | 0 |
| D | 0 | 522 | 0 |
| Mode M0 | |||
|---|---|---|---|
| Quadrant | BADHDUFLAG | Total packets | Discarded packets |
| A | 0 | 56828 | 7 |
| B | 0 | 59483 | 6 |
| C | 0 | 70928 | 6 |
| D | 0 | 69386 | 6 |
| Mode M9 | |||
|---|---|---|---|
| Quadrant | BADHDUFLAG | Total packets | Discarded packets |
| A | 0 | 86 | 0 |
| B | 0 | 86 | 0 |
| C | 0 | 86 | 0 |
| D | 0 | 86 | 0 |
| Quadrant | Total seconds | Saturated seconds | Saturation percentage |
|---|---|---|---|
| A | 25506 | 237 | 0.929193% |
| B | 25506 | 804 | 3.152199% |
| C | 25506 | 1895 | 7.429624% |
| D | 25506 | 740 | 2.901278% |
Noise dominated data is calculated using 1-second bins in cleaned event files. If a bin has >2000 counts, and if more than 50% of those come from <1% of pixels, then it is considered to be noise-dominated and hence unusable.
| Quadrant | # 1 sec bins | Bins with >0 counts | Bins with >2000 counts | High rate bins dominated by noise | Noise dominated (total time) | Noise dominated (detector-on time) | Marked lightcurve |
|---|---|---|---|---|---|---|---|
| A | 34103 | 25512 | 163 | 163 | 0.48% | 0.64% | 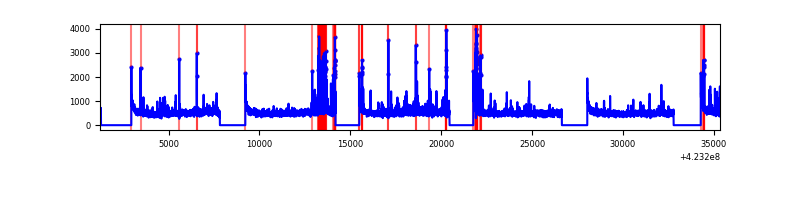 |
| B | 34103 | 25512 | 632 | 632 | 1.85% | 2.48% | 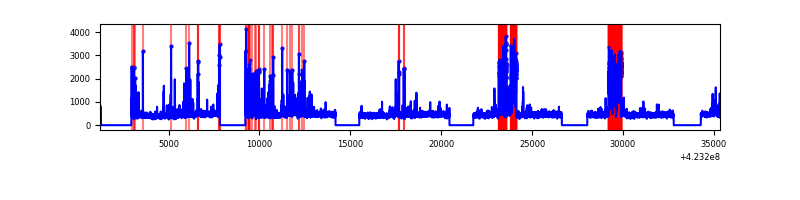 |
| C | 34103 | 25512 | 1770 | 1770 | 5.19% | 6.94% | 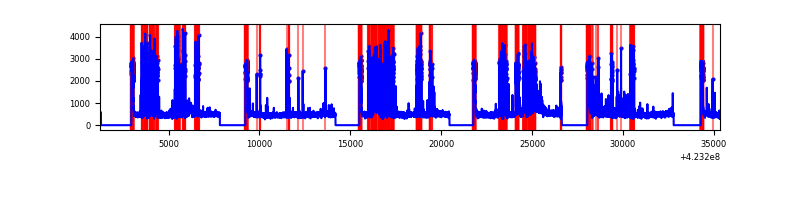 |
| D | 34103 | 25512 | 633 | 633 | 1.86% | 2.48% | 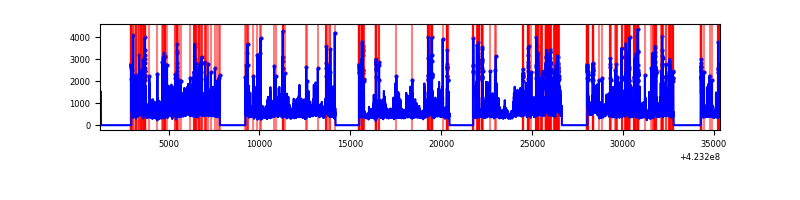 |
Top three noisy pixels from each quadrant. If the there are fewer than three noisy pixels in the level2.evt file, extra rows are filled as -1
| Pixel properties | Quadrant properties | ||||||
|---|---|---|---|---|---|---|---|
| Quadrant | DetID | PixID | Counts | Sigma | Mean | Median | Sigma |
| A | 10 | 83 | 2261836 | 3963.57 | 2795 | 2738 | 570.0 |
| A | 14 | 235 | 420262 | 732.54 | 2795 | 2738 | 570.0 |
| A | 2 | 79 | 319807 | 556.29 | 2795 | 2738 | 570.0 |
| B | 0 | 186 | 2364206 | 4524.43 | 2748 | 2671 | 522.0 |
| B | 5 | 255 | 435044 | 828.38 | 2748 | 2671 | 522.0 |
| B | 0 | 245 | 201109 | 380.18 | 2748 | 2671 | 522.0 |
| C | 4 | 254 | 4832785 | 7975.99 | 2619 | 2634 | 605.6 |
| C | 0 | 10 | 1863227 | 3072.38 | 2619 | 2634 | 605.6 |
| C | 15 | 214 | 1024203 | 1686.91 | 2619 | 2634 | 605.6 |
| D | 12 | 16 | 2167269 | 3301.13 | 2705 | 2629 | 655.7 |
| D | 1 | 52 | 1168578 | 1778.1 | 2705 | 2629 | 655.7 |
| D | 1 | 47 | 904821 | 1375.86 | 2705 | 2629 | 655.7 |
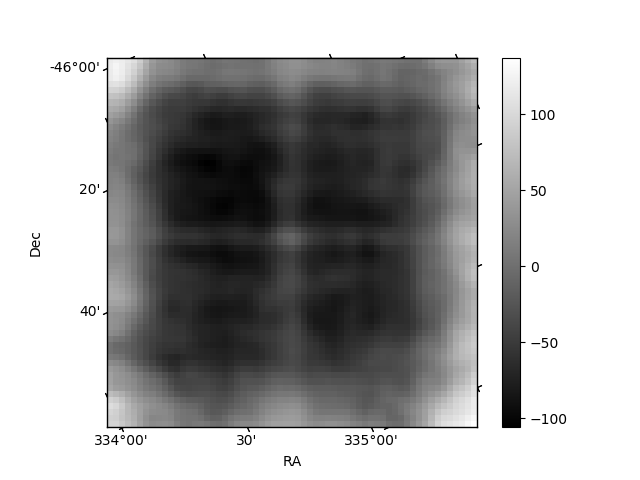
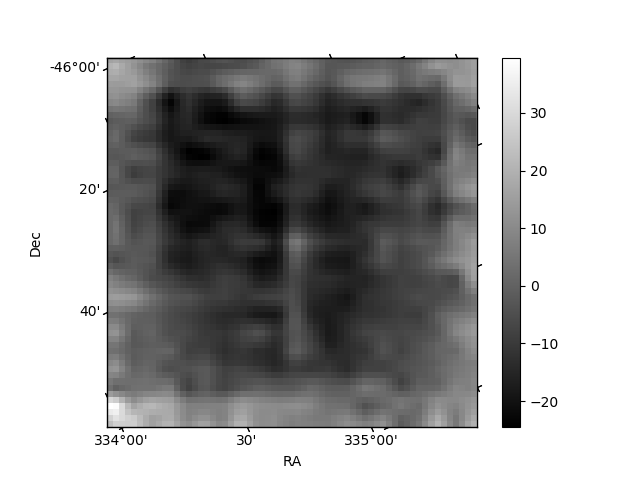
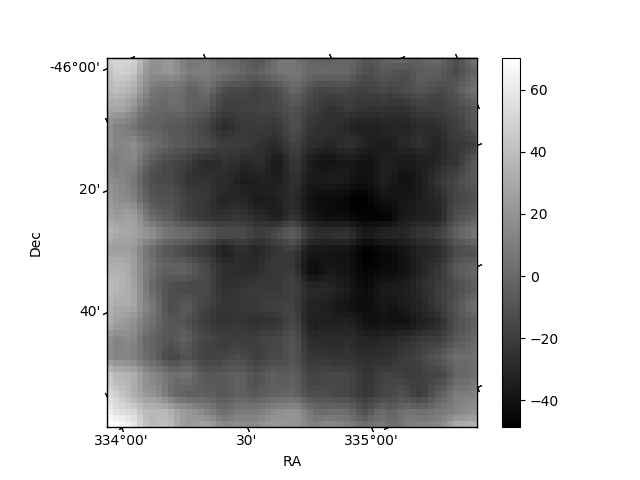
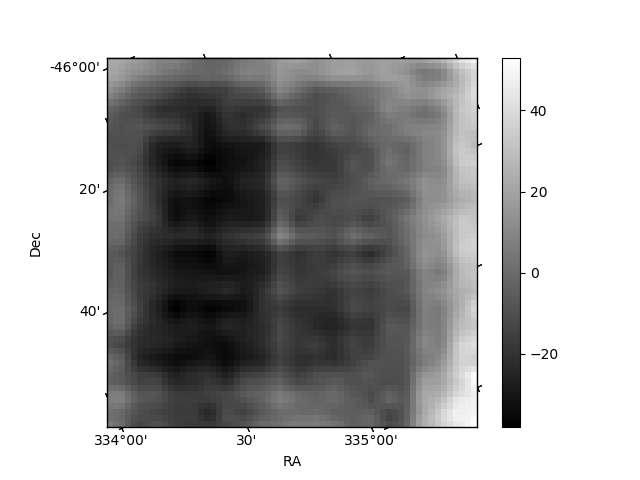
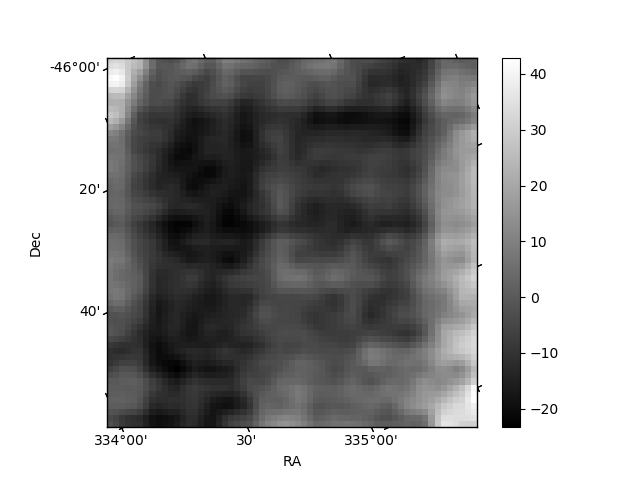
Histogram calculated using DETX and DETY for each event in the final _common_clean file
| Quadrant A | 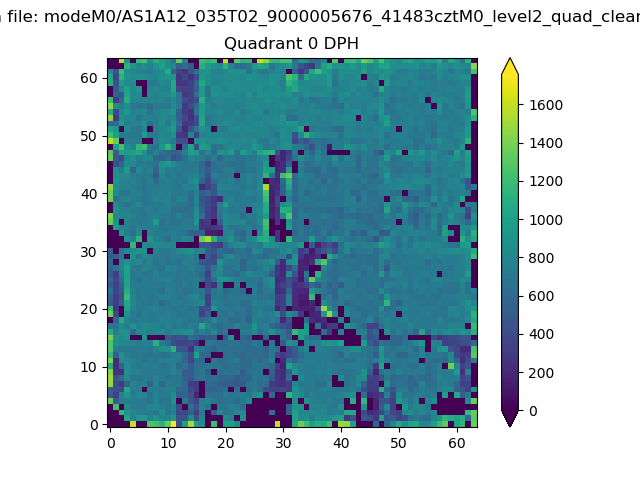 |
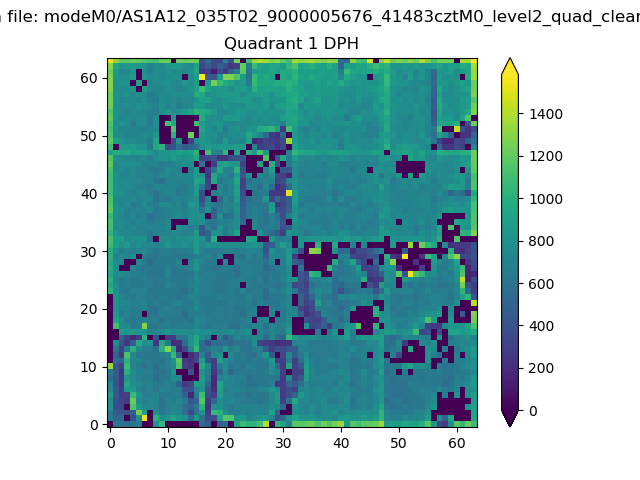 |
Quadrant B |
|---|---|---|---|
| Quadrant D | 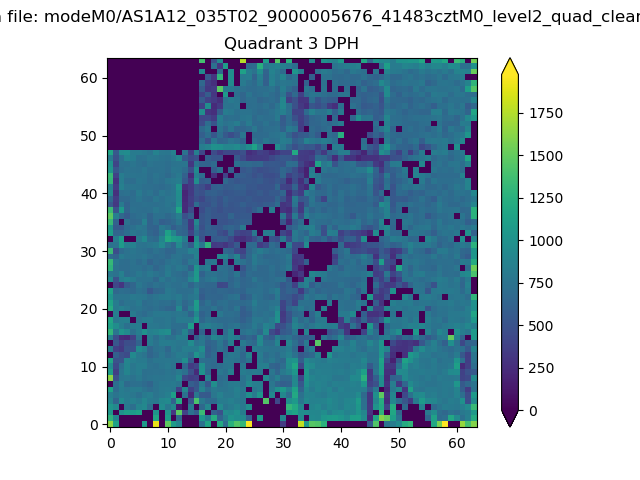 |
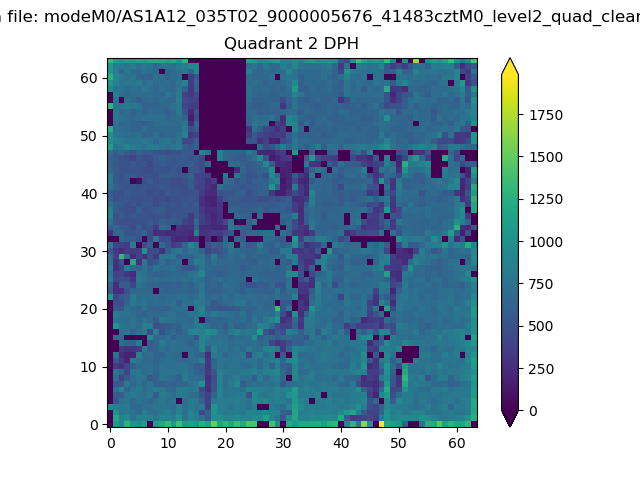 |
Quadrant C |
| Plot type | Count rate plots | Images |
|---|---|---|
| Comparison with Poisson distribution Blue bars denote a histogram of data divided into 1 sec bins. Red curve is a Poisson curve with rate = median count rate of data. |
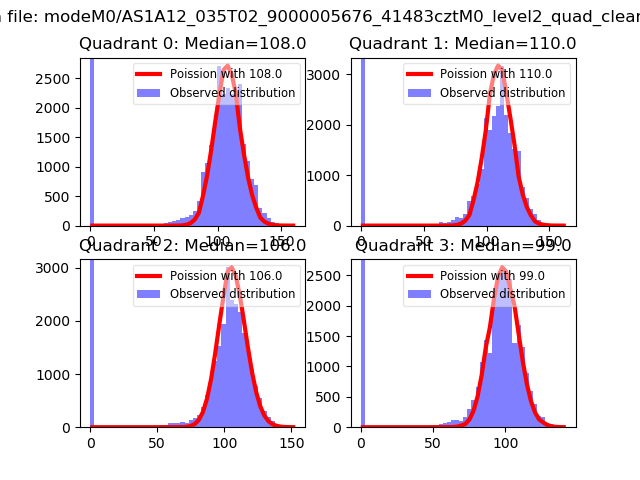 |
 |
| Quadrant-wise count rates Data is divided into 100 sec bins |
 |
|
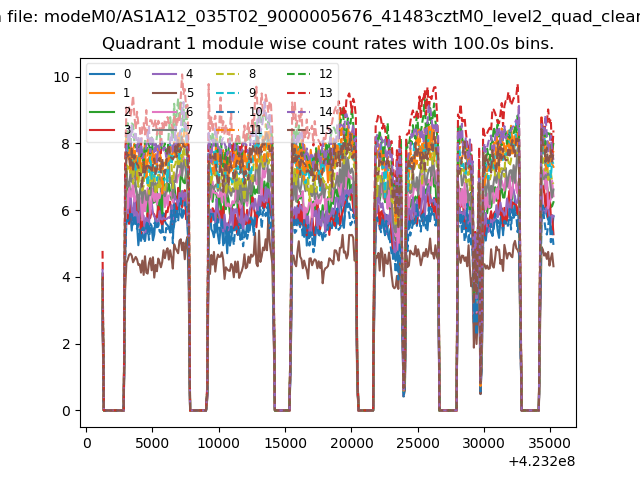
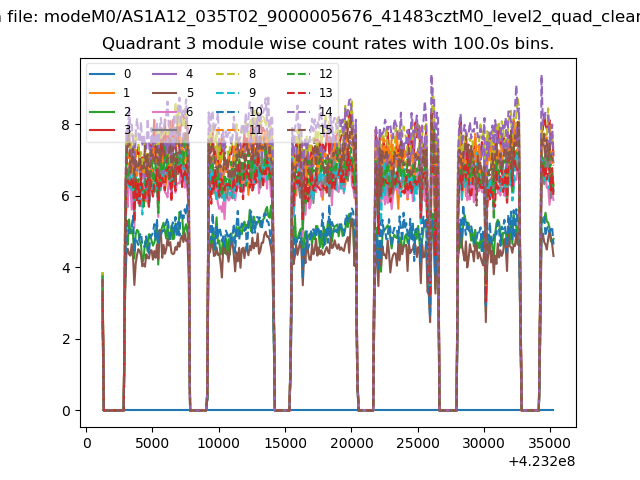
| Module-wise count rates for Quadrant A Data is divided into 100 sec bins |
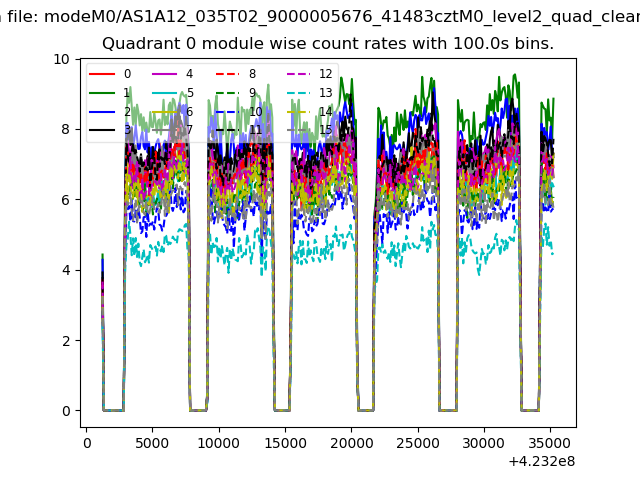 |
 |
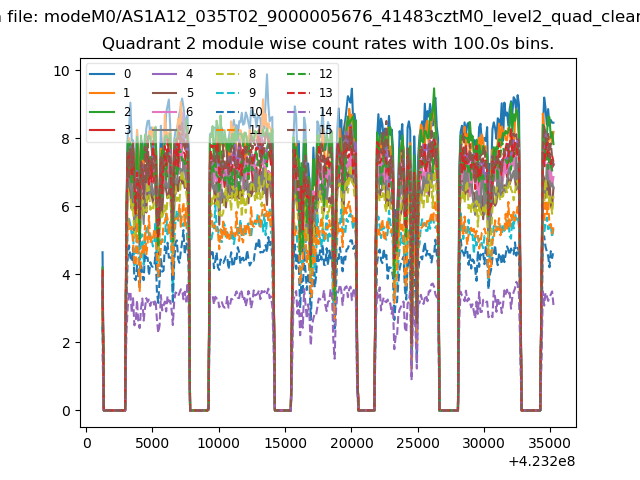
| Module-wise count rates for Quadrant B Data is divided into 100 sec bins |
 |
 |
| Module-wise count rates for Quadrant C Data is divided into 100 sec bins |
 |
 |
| Module-wise count rates for Quadrant D Data is divided into 100 sec bins |
 |
 |
| Parameter | Plot |
|---|---|
| CZT HV Monitor | 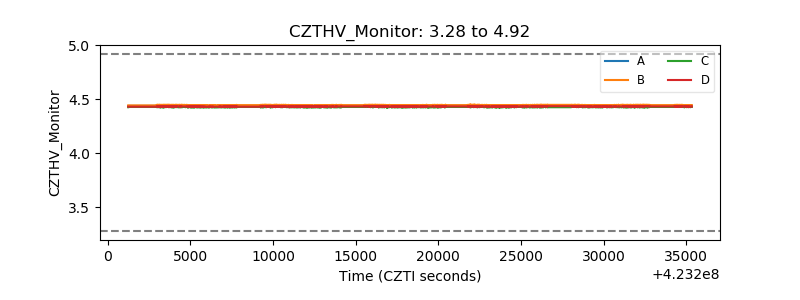 |
| D_VDD | 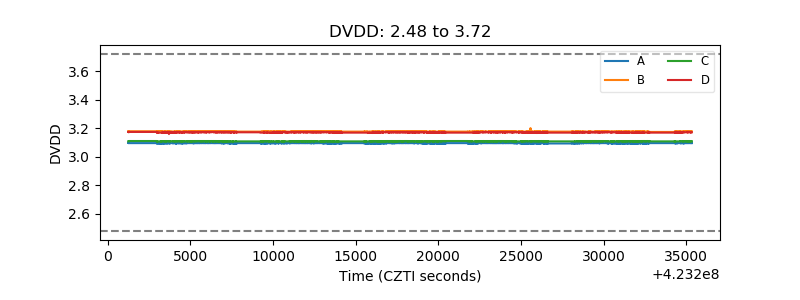 |
| Temperature 1 | 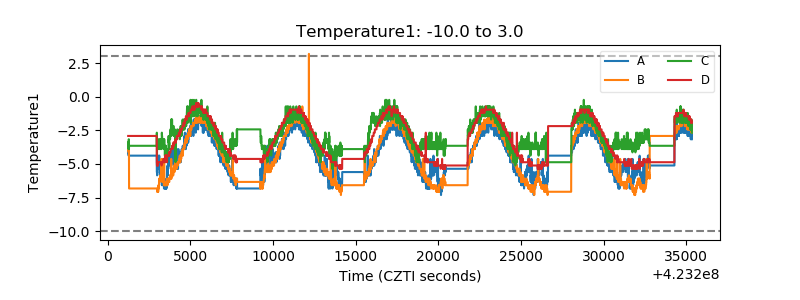 |
| Veto HV Monitor | 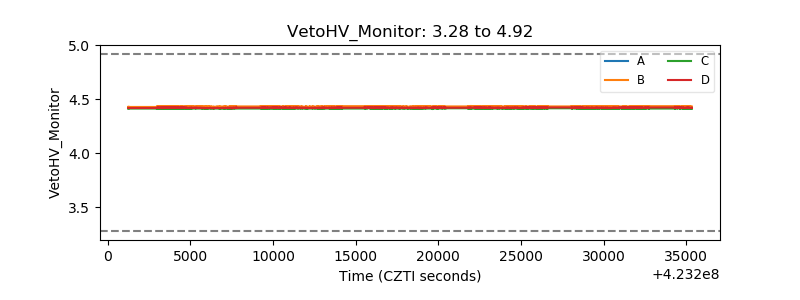 |
| Veto LLD |  |
| Alpha Counter | 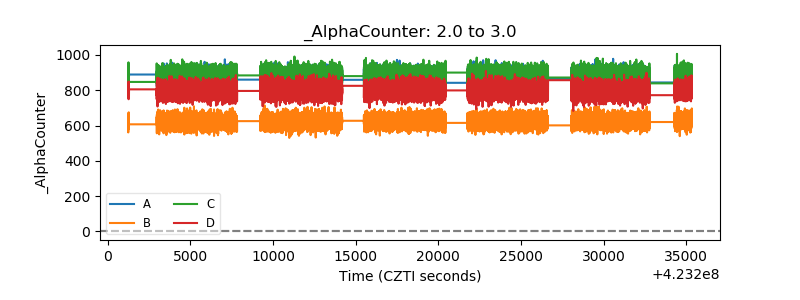 |
| _CPM_Rate |  |
| CZT Counter | 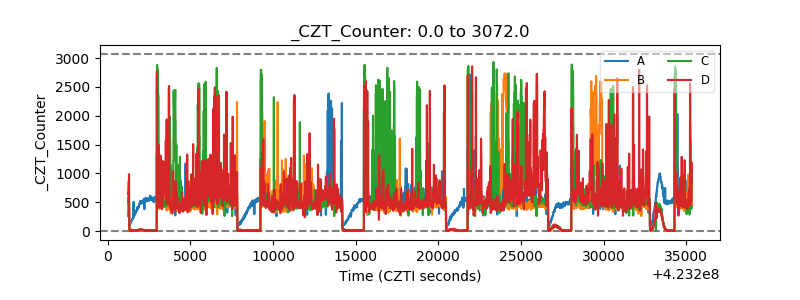 |
| +2.5 Volts monitor | 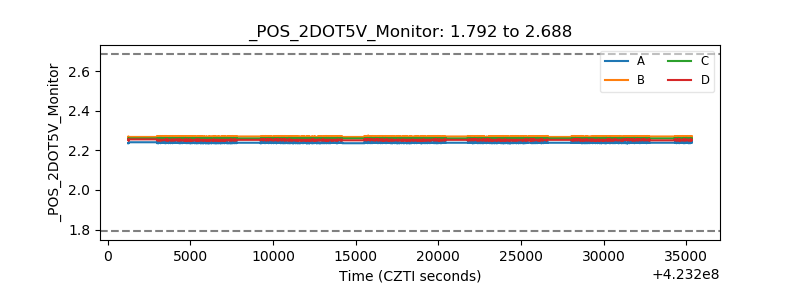 |
| +5 Volts monitor | 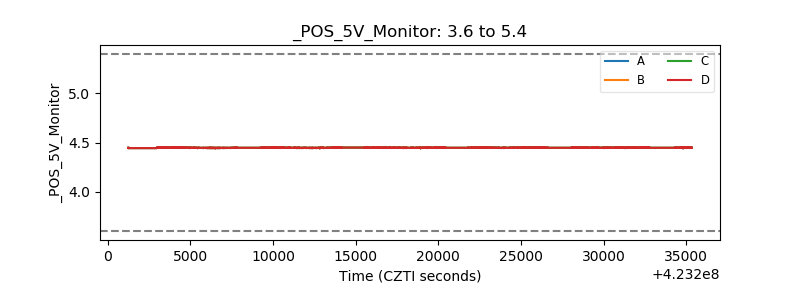 |
| _ROLL_ROT | 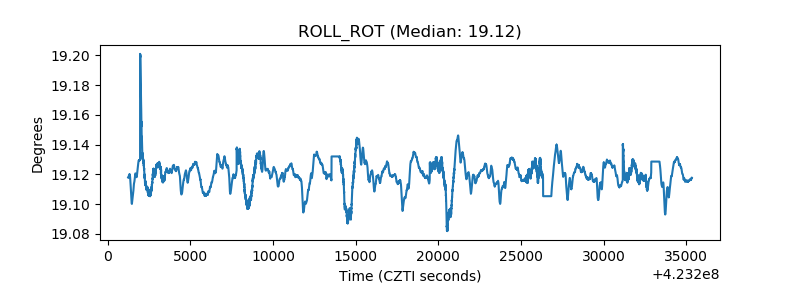 |
| _Roll_DEC | 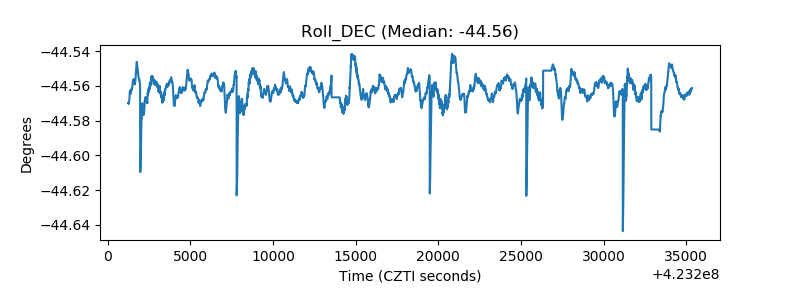 |
| _Roll_RA | 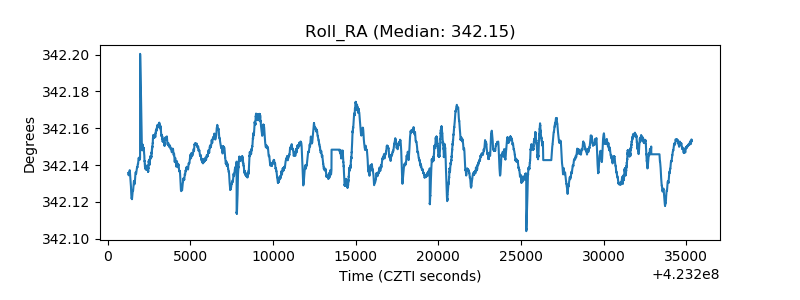 |
| Veto Counter | 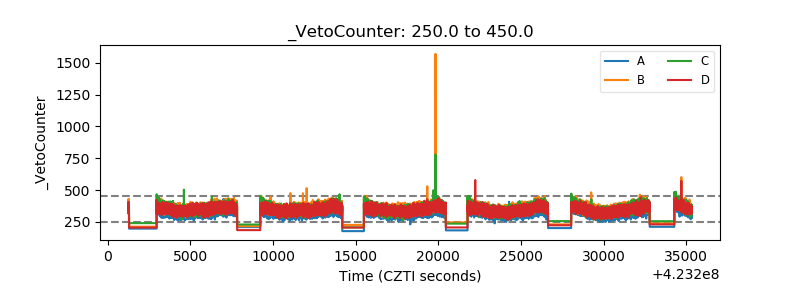 |