| Param | Original file | Final file |
|---|---|---|
| Filename | modeM0/AS1A12_035T02_9000005676_41484cztM0_level2.fits | modeM0/AS1A12_035T02_9000005676_41484cztM0_level2_quad_clean.evt |
| Size (bytes) | 381,283,200 | 89,236,800 |
| Size | 363.6 MB | 85.1 MB |
| Events in quadrant A | 3,069,373 | 615,492 |
| Events in quadrant B | 2,821,945 | 607,873 |
| Events in quadrant C | 3,180,736 | 567,784 |
| Events in quadrant D | 4,611,199 | 523,244 |
| Mode SS | |||
|---|---|---|---|
| Quadrant | BADHDUFLAG | Total packets | Discarded packets |
| A | 0 | 114 | 0 |
| B | 0 | 114 | 0 |
| C | 0 | 114 | 0 |
| D | 0 | 114 | 0 |
| Mode M0 | |||
|---|---|---|---|
| Quadrant | BADHDUFLAG | Total packets | Discarded packets |
| A | 0 | 12512 | 3 |
| B | 0 | 12236 | 2 |
| C | 0 | 12879 | 2 |
| D | 0 | 17467 | 2 |
| Mode M9 | |||
|---|---|---|---|
| Quadrant | BADHDUFLAG | Total packets | Discarded packets |
| A | 0 | 24 | 0 |
| B | 0 | 24 | 0 |
| C | 0 | 24 | 0 |
| D | 0 | 25 | 0 |
| Quadrant | Total seconds | Saturated seconds | Saturation percentage |
|---|---|---|---|
| A | 5533 | 29 | 0.524128% |
| B | 5533 | 117 | 2.114585% |
| C | 5533 | 230 | 4.156877% |
| D | 5533 | 461 | 8.331827% |
Noise dominated data is calculated using 1-second bins in cleaned event files. If a bin has >2000 counts, and if more than 50% of those come from <1% of pixels, then it is considered to be noise-dominated and hence unusable.
| Quadrant | # 1 sec bins | Bins with >0 counts | Bins with >2000 counts | High rate bins dominated by noise | Noise dominated (total time) | Noise dominated (detector-on time) | Marked lightcurve |
|---|---|---|---|---|---|---|---|
| A | 7147 | 5534 | 12 | 12 | 0.17% | 0.22% | 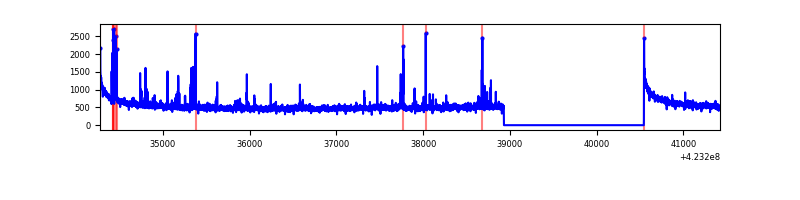 |
| B | 7147 | 5534 | 77 | 77 | 1.08% | 1.39% | 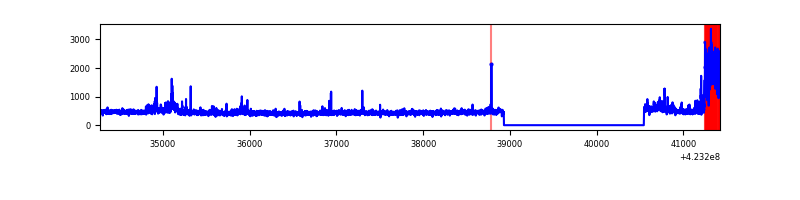 |
| C | 7147 | 5534 | 228 | 228 | 3.19% | 4.12% | 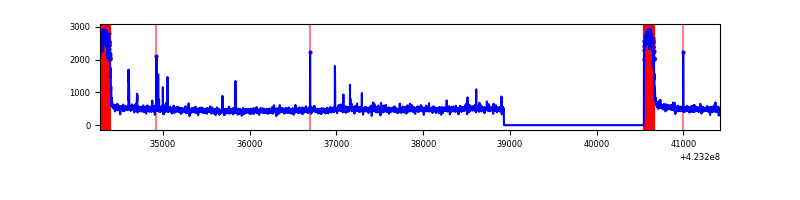 |
| D | 7146 | 5533 | 428 | 428 | 5.99% | 7.74% | 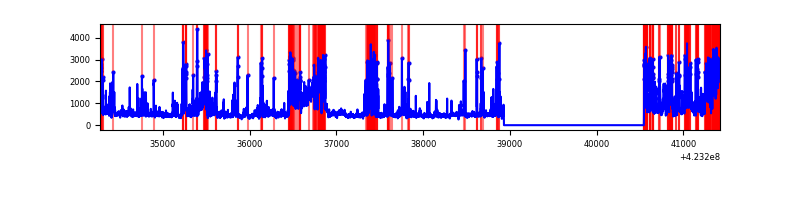 |
Top three noisy pixels from each quadrant. If the there are fewer than three noisy pixels in the level2.evt file, extra rows are filled as -1
| Pixel properties | Quadrant properties | ||||||
|---|---|---|---|---|---|---|---|
| Quadrant | DetID | PixID | Counts | Sigma | Mean | Median | Sigma |
| A | 10 | 83 | 551399 | 4364.34 | 614 | 601 | 126.2 |
| A | 13 | 248 | 74612 | 586.44 | 614 | 601 | 126.2 |
| A | 2 | 79 | 63140 | 495.54 | 614 | 601 | 126.2 |
| B | 0 | 186 | 365462 | 3117.95 | 603 | 586 | 117.0 |
| B | 0 | 190 | 34799 | 292.36 | 603 | 586 | 117.0 |
| B | 0 | 245 | 34466 | 289.51 | 603 | 586 | 117.0 |
| C | 0 | 10 | 638356 | 4725.11 | 574 | 576 | 135.0 |
| C | 15 | 214 | 227993 | 1684.86 | 574 | 576 | 135.0 |
| C | 3 | 233 | 27145 | 196.84 | 574 | 576 | 135.0 |
| D | 12 | 16 | 1225460 | 8812.32 | 576 | 560 | 139.0 |
| D | 5 | 222 | 456446 | 3279.79 | 576 | 560 | 139.0 |
| D | 1 | 47 | 216197 | 1551.36 | 576 | 560 | 139.0 |
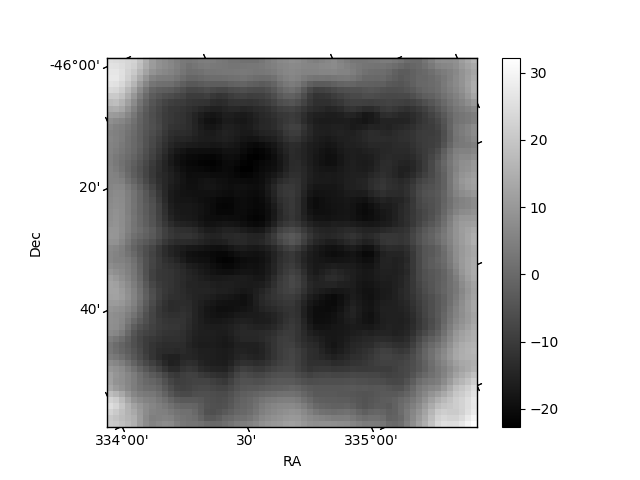
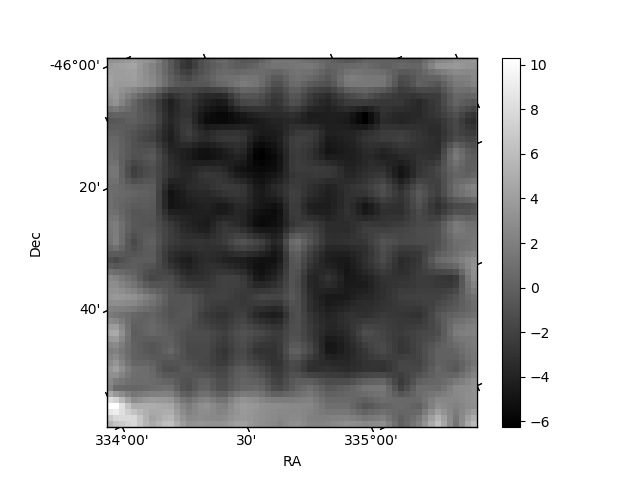
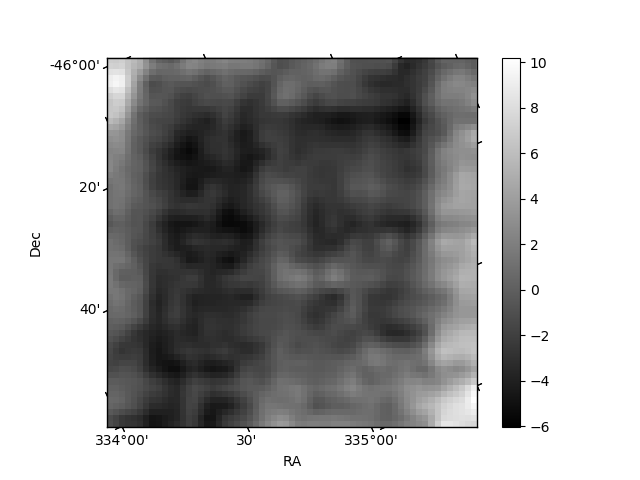
Histogram calculated using DETX and DETY for each event in the final _common_clean file
| Quadrant A | 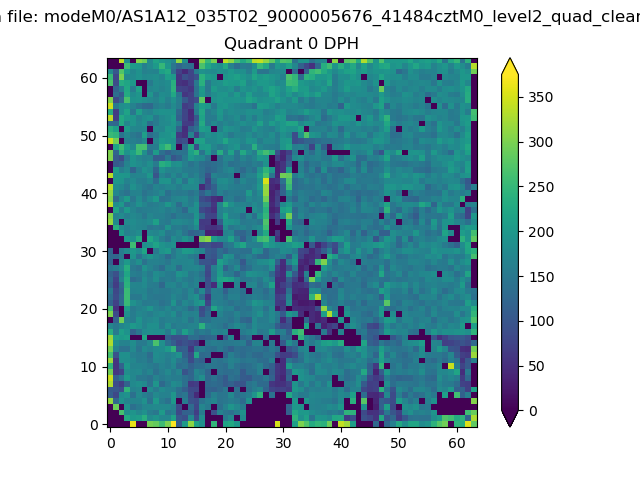 |
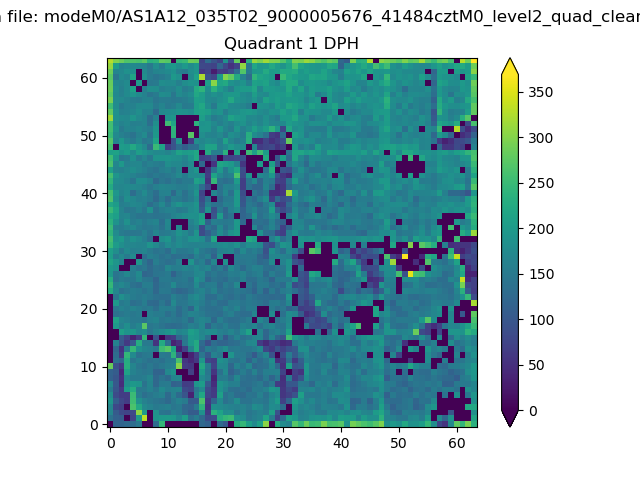 |
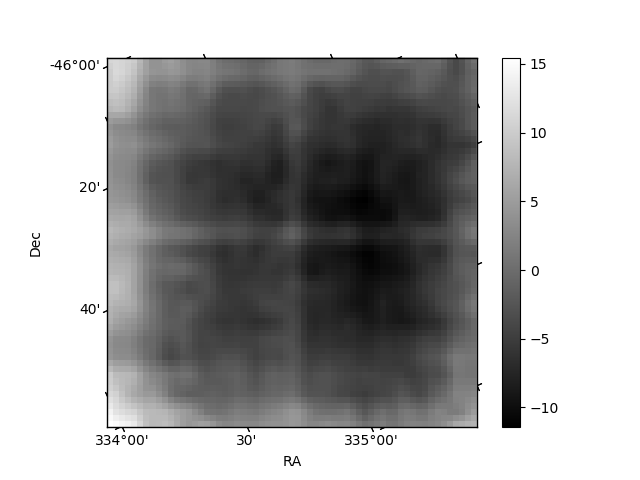
Quadrant B |
|---|---|---|---|
| Quadrant D | 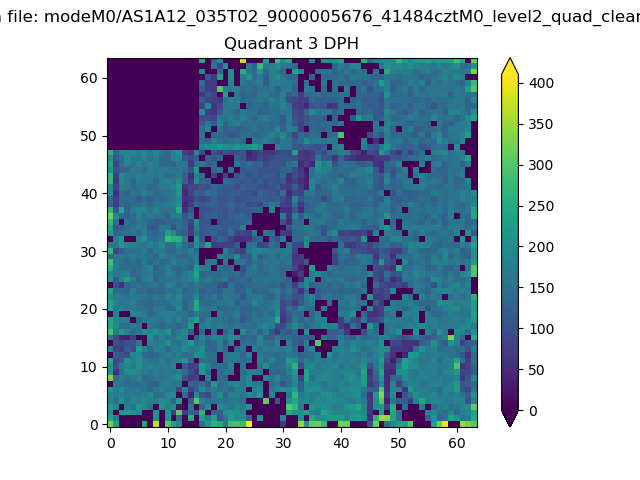 |
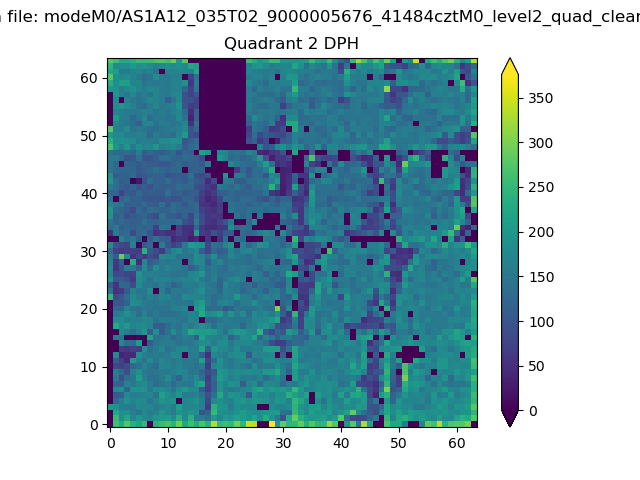 |
Quadrant C |
| Plot type | Count rate plots | Images |
|---|---|---|
| Comparison with Poisson distribution Blue bars denote a histogram of data divided into 1 sec bins. Red curve is a Poisson curve with rate = median count rate of data. |
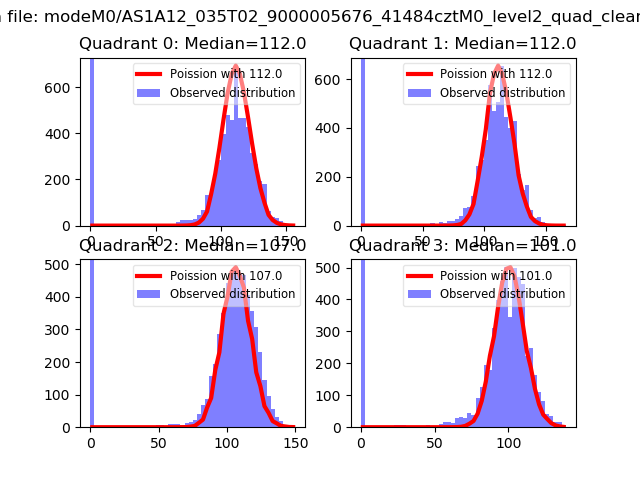 |
 |
| Quadrant-wise count rates Data is divided into 100 sec bins |
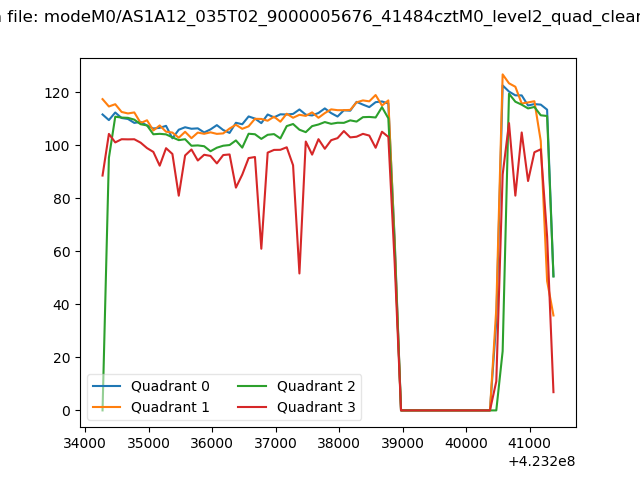 |
|
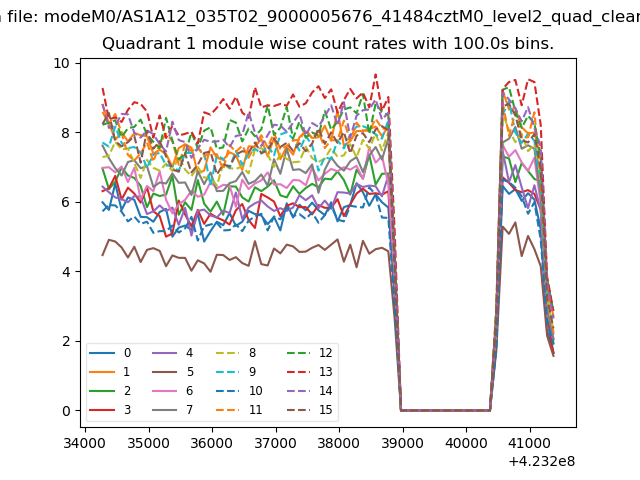
| Module-wise count rates for Quadrant A Data is divided into 100 sec bins |
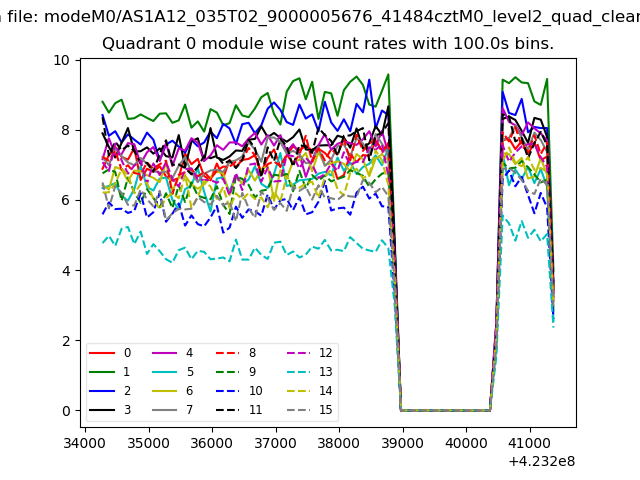 |
 |
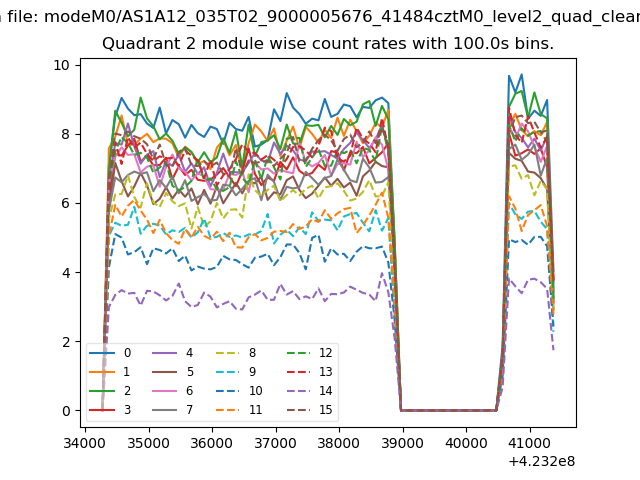
| Module-wise count rates for Quadrant B Data is divided into 100 sec bins |
 |
 |
| Module-wise count rates for Quadrant C Data is divided into 100 sec bins |
 |
 |
| Module-wise count rates for Quadrant D Data is divided into 100 sec bins |
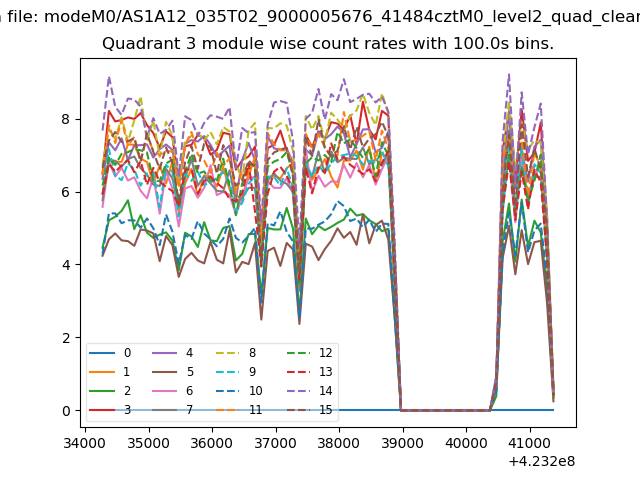 |
 |
| Parameter | Plot |
|---|---|
| CZT HV Monitor | 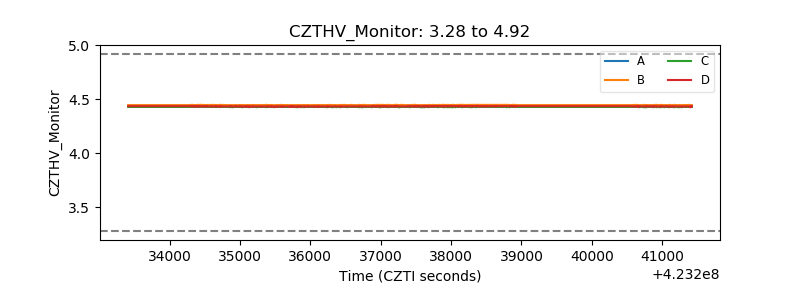 |
| D_VDD | 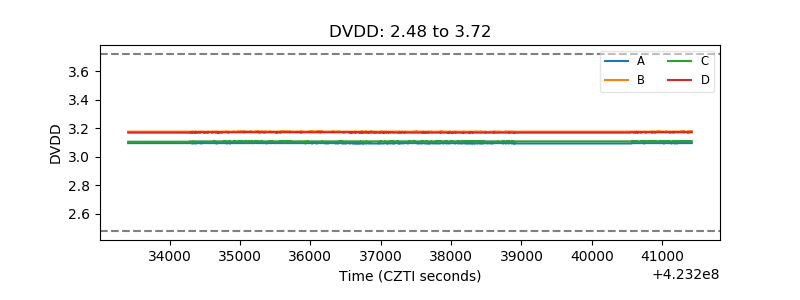 |
| Temperature 1 | 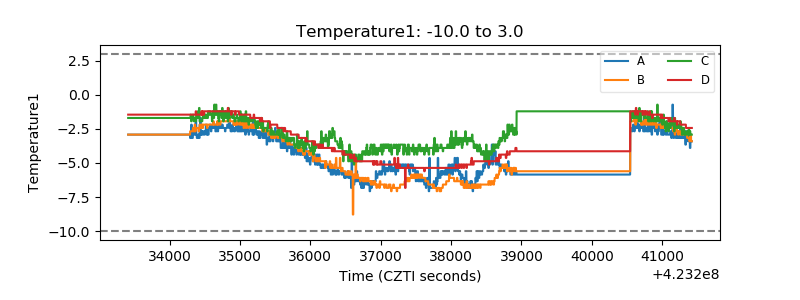 |
| Veto HV Monitor | 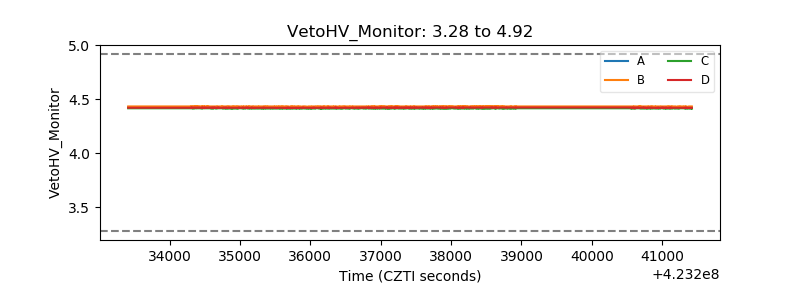 |
| Veto LLD | 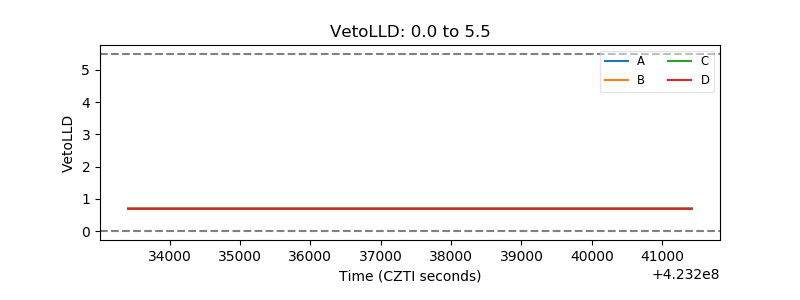 |
| Alpha Counter | 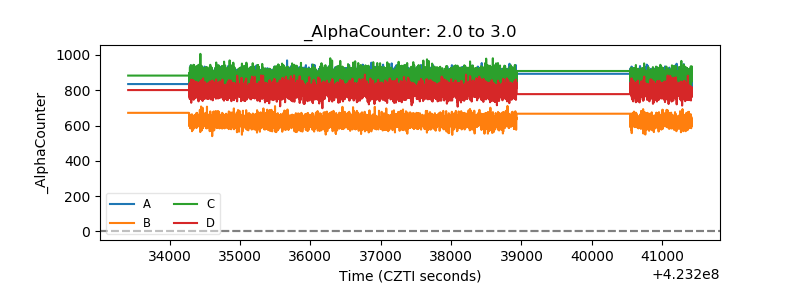 |
| _CPM_Rate | 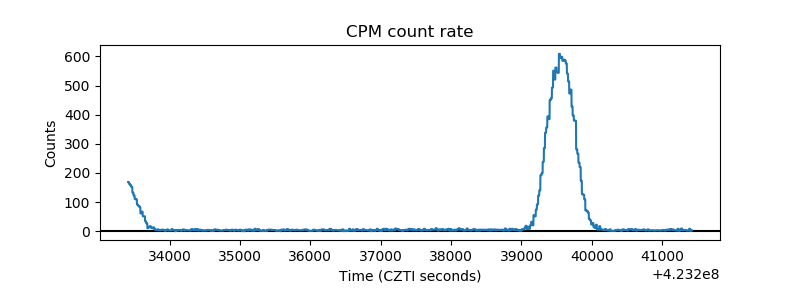 |
| CZT Counter | 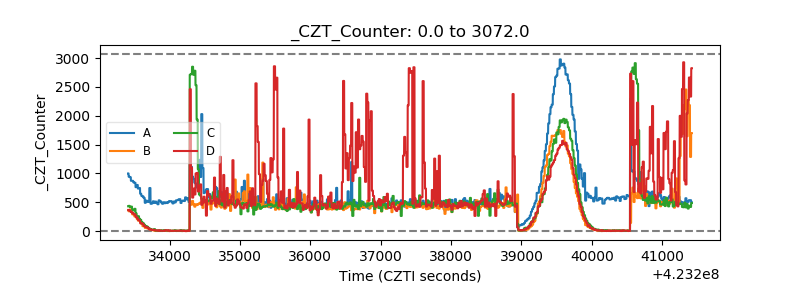 |
| +2.5 Volts monitor | 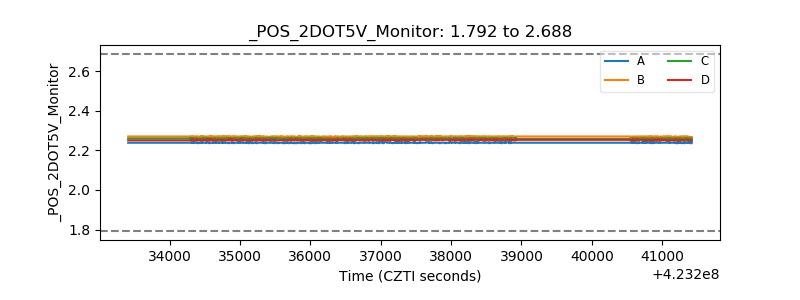 |
| +5 Volts monitor | 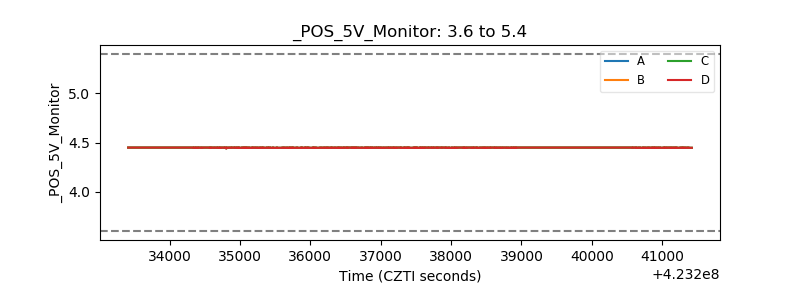 |
| _ROLL_ROT |  |
| _Roll_DEC | 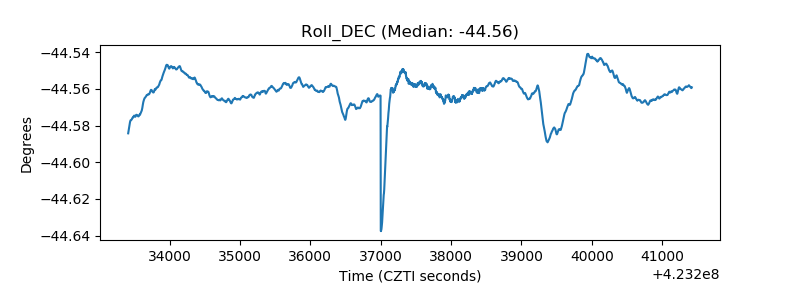 |
| _Roll_RA | 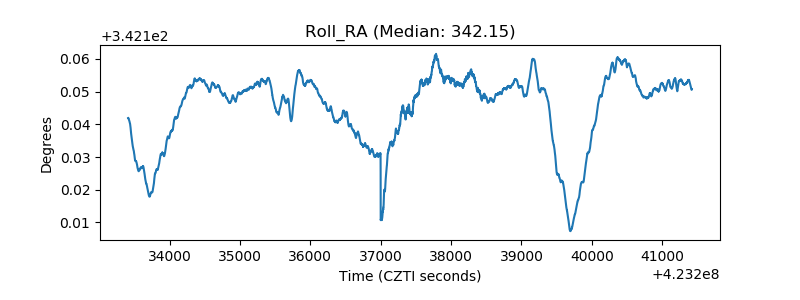 |
| Veto Counter | 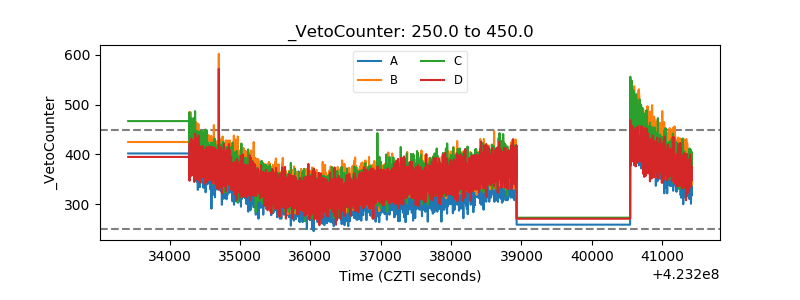 |