| Param | Original file | Final file |
|---|---|---|
| Filename | modeM0/AS1A12_035T02_9000005676_41486cztM0_level2.fits | modeM0/AS1A12_035T02_9000005676_41486cztM0_level2_quad_clean.evt |
| Size (bytes) | 393,802,560 | 80,170,560 |
| Size | 375.6 MB | 76.5 MB |
| Events in quadrant A | 2,700,867 | 572,141 |
| Events in quadrant B | 2,786,014 | 566,019 |
| Events in quadrant C | 3,448,170 | 517,570 |
| Events in quadrant D | 5,256,633 | 424,081 |
| Mode SS | |||
|---|---|---|---|
| Quadrant | BADHDUFLAG | Total packets | Discarded packets |
| A | 0 | 108 | 4 |
| B | 0 | 104 | 6 |
| C | 0 | 108 | 4 |
| D | 0 | 105 | 1 |
| Mode M0 | |||
|---|---|---|---|
| Quadrant | BADHDUFLAG | Total packets | Discarded packets |
| A | 0 | 11839 | 742 |
| B | 0 | 12452 | 732 |
| C | 0 | 14527 | 1117 |
| D | 0 | 21016 | 2114 |
| Mode M9 | |||
|---|---|---|---|
| Quadrant | BADHDUFLAG | Total packets | Discarded packets |
| A | 0 | 24 | 3 |
| B | 0 | 22 | 2 |
| C | 0 | 24 | 3 |
| D | 0 | 24 | 3 |
| Quadrant | Total seconds | Saturated seconds | Saturation percentage |
|---|---|---|---|
| A | 4998 | 20 | 0.400160% |
| B | 4991 | 143 | 2.865157% |
| C | 4963 | 250 | 5.037276% |
| D | 4839 | 817 | 16.883654% |
Noise dominated data is calculated using 1-second bins in cleaned event files. If a bin has >2000 counts, and if more than 50% of those come from <1% of pixels, then it is considered to be noise-dominated and hence unusable.
| Quadrant | # 1 sec bins | Bins with >0 counts | Bins with >2000 counts | High rate bins dominated by noise | Noise dominated (total time) | Noise dominated (detector-on time) | Marked lightcurve |
|---|---|---|---|---|---|---|---|
| A | 7130 | 5234 | 3 | 3 | 0.04% | 0.06% | 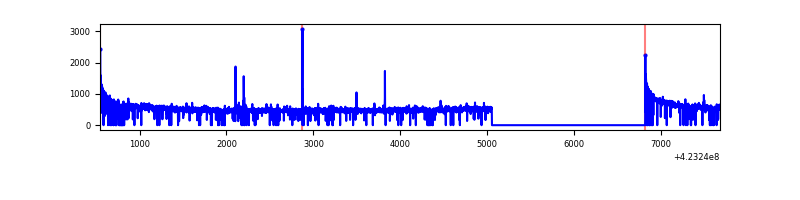 |
| B | 7130 | 5239 | 82 | 82 | 1.15% | 1.57% | 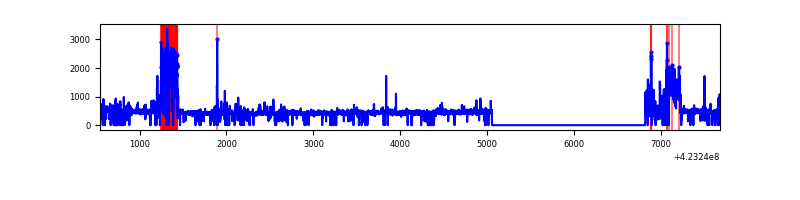 |
| C | 7130 | 5199 | 235 | 235 | 3.30% | 4.52% | 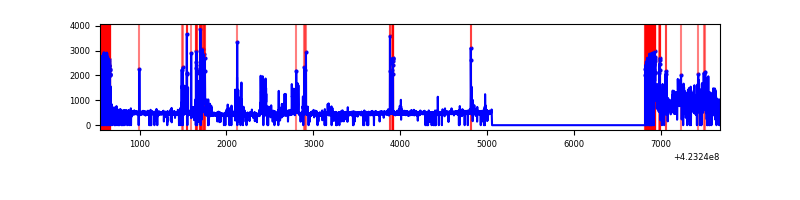 |
| D | 7130 | 5135 | 742 | 742 | 10.41% | 14.45% | 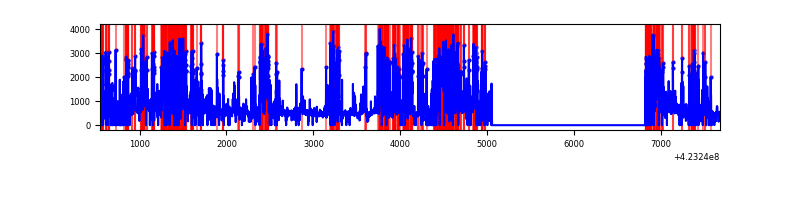 |
Top three noisy pixels from each quadrant. If the there are fewer than three noisy pixels in the level2.evt file, extra rows are filled as -1
| Pixel properties | Quadrant properties | ||||||
|---|---|---|---|---|---|---|---|
| Quadrant | DetID | PixID | Counts | Sigma | Mean | Median | Sigma |
| A | 10 | 83 | 484864 | 4197.49 | 560 | 549 | 115.4 |
| A | 2 | 79 | 24974 | 211.68 | 560 | 549 | 115.4 |
| A | 15 | 254 | 10256 | 84.13 | 560 | 549 | 115.4 |
| B | 0 | 186 | 499523 | 4660.82 | 553 | 537 | 107.1 |
| B | 0 | 245 | 50712 | 468.66 | 553 | 537 | 107.1 |
| B | 0 | 190 | 46755 | 431.7 | 553 | 537 | 107.1 |
| C | 0 | 10 | 507991 | 4206.76 | 518 | 522 | 120.6 |
| C | 9 | 54 | 490994 | 4065.86 | 518 | 522 | 120.6 |
| C | 15 | 214 | 203649 | 1683.86 | 518 | 522 | 120.6 |
| D | 12 | 16 | 2644209 | 22283.86 | 486 | 472 | 118.6 |
| D | 12 | 79 | 201741 | 1696.48 | 486 | 472 | 118.6 |
| D | 12 | 128 | 175914 | 1478.79 | 486 | 472 | 118.6 |
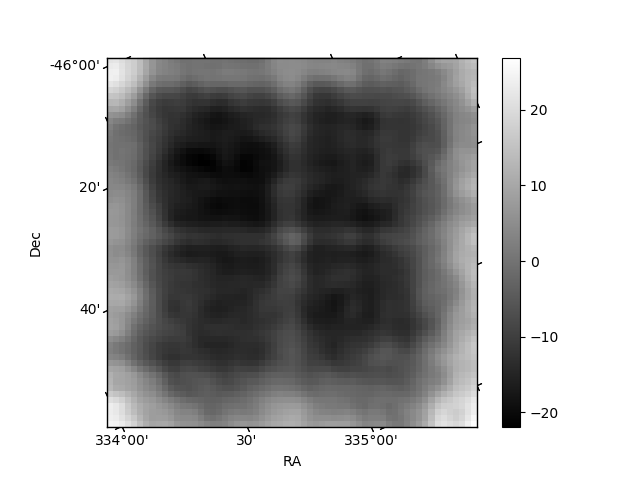
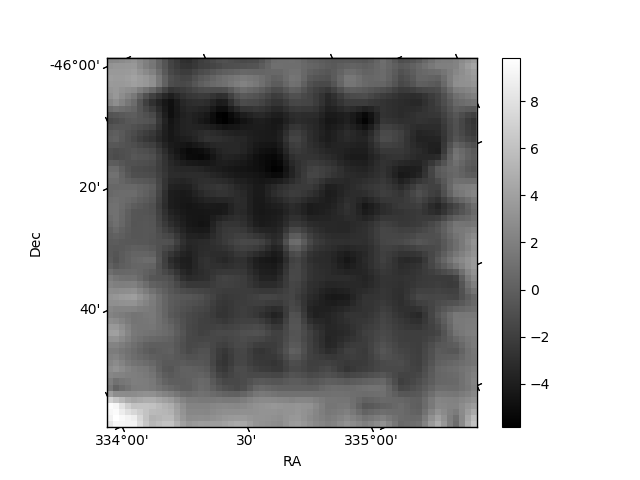
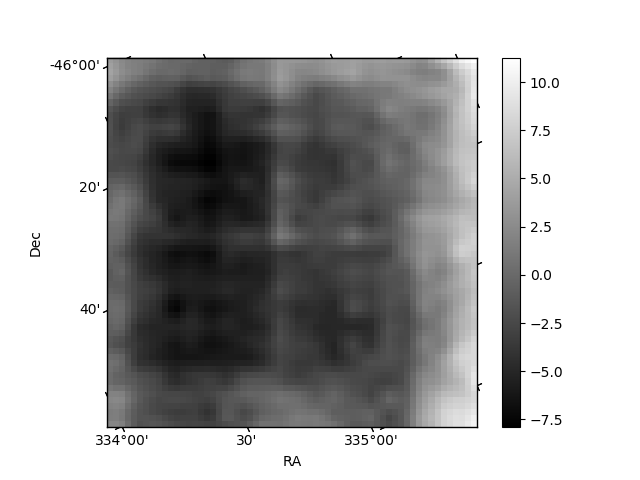
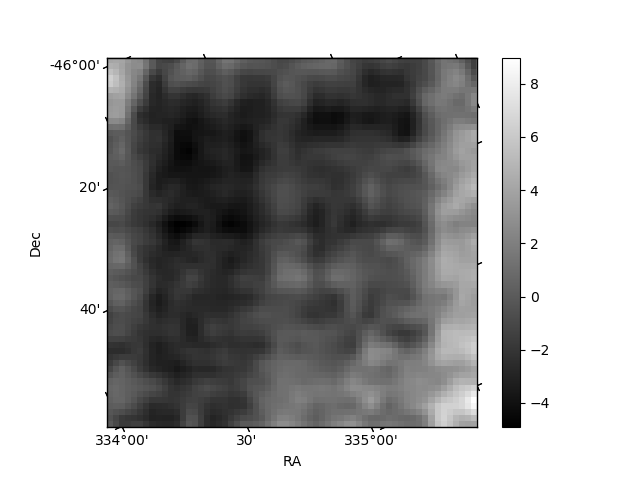
Histogram calculated using DETX and DETY for each event in the final _common_clean file
| Quadrant A | 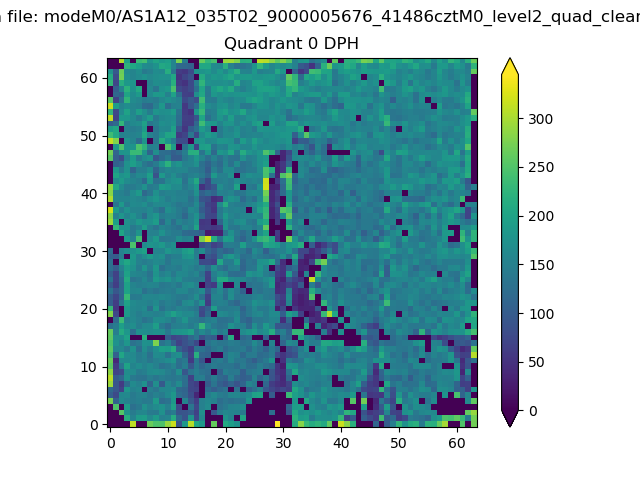 |
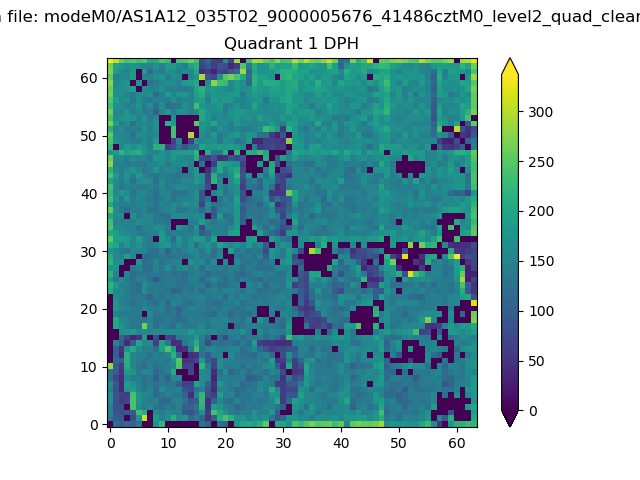 |
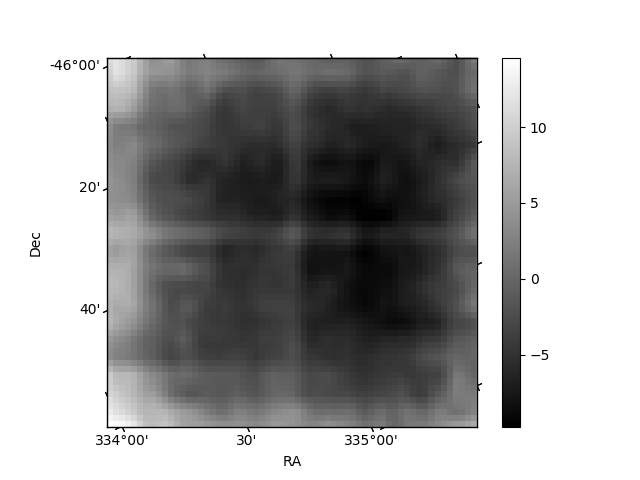
Quadrant B |
|---|---|---|---|
| Quadrant D | 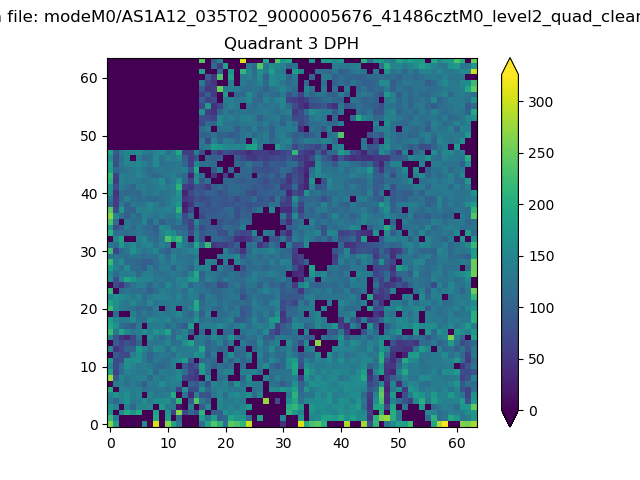 |
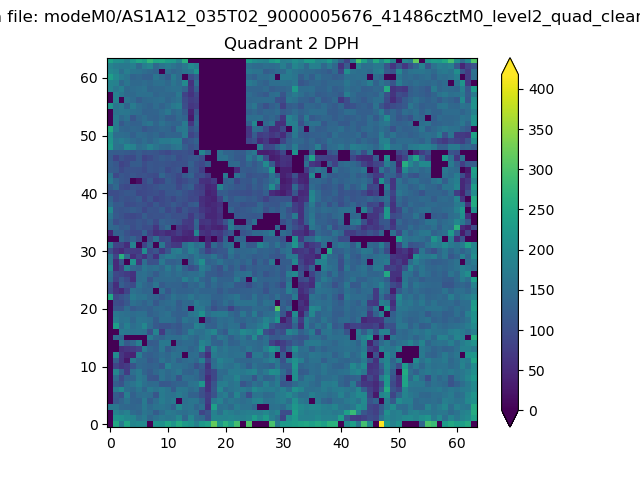 |
Quadrant C |
| Plot type | Count rate plots | Images |
|---|---|---|
| Comparison with Poisson distribution Blue bars denote a histogram of data divided into 1 sec bins. Red curve is a Poisson curve with rate = median count rate of data. |
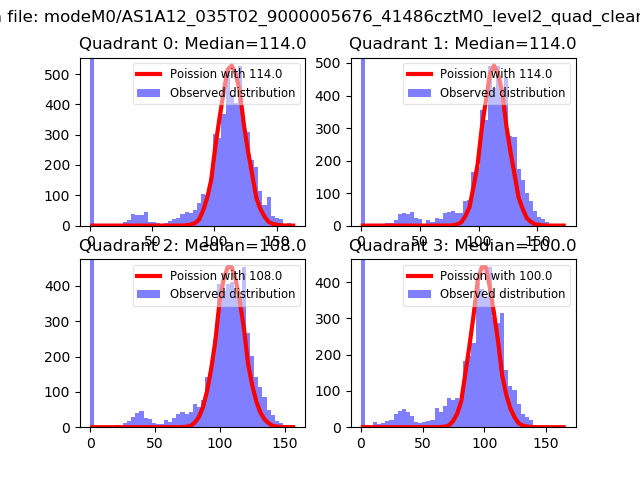 |
 |
| Quadrant-wise count rates Data is divided into 100 sec bins |
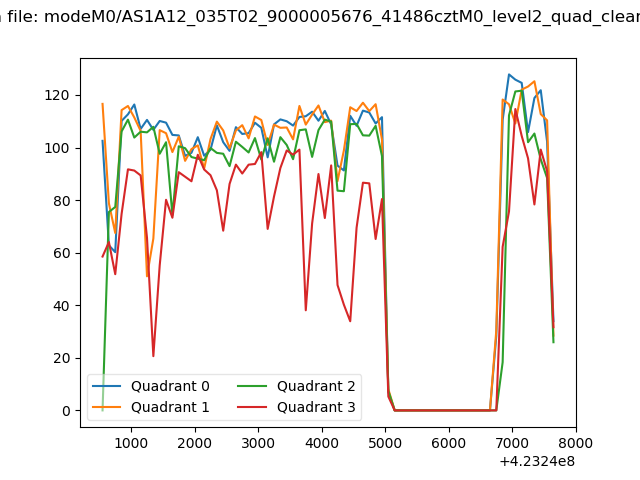 |
|
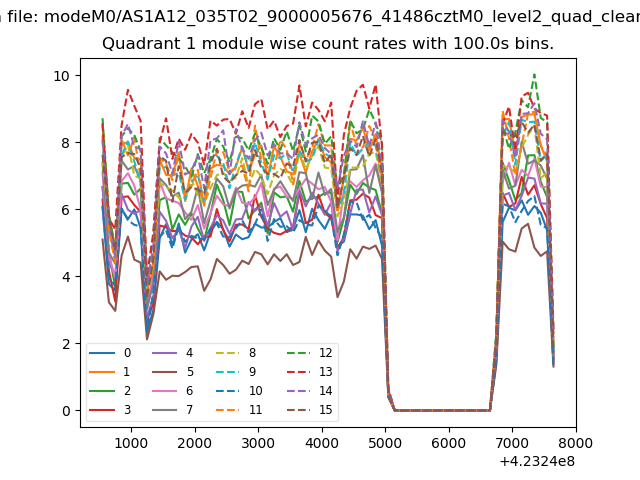
| Module-wise count rates for Quadrant A Data is divided into 100 sec bins |
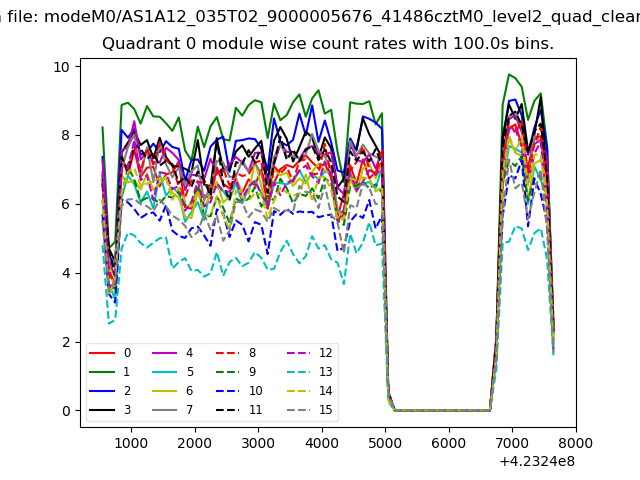 |
 |
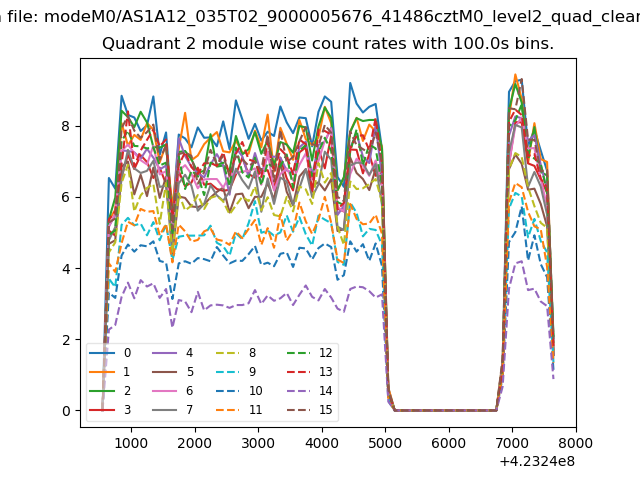
| Module-wise count rates for Quadrant B Data is divided into 100 sec bins |
 |
 |
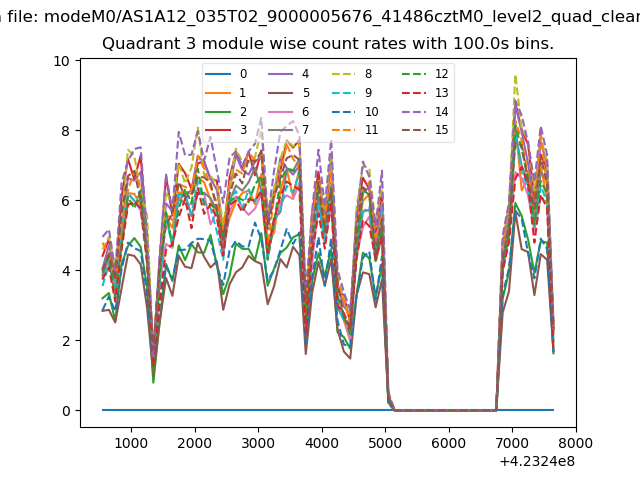
| Module-wise count rates for Quadrant C Data is divided into 100 sec bins |
 |
 |
| Module-wise count rates for Quadrant D Data is divided into 100 sec bins |
 |
 |
| Parameter | Plot |
|---|---|
| CZT HV Monitor | 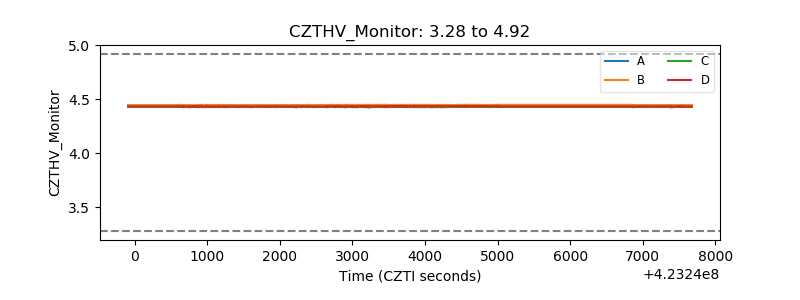 |
| D_VDD | 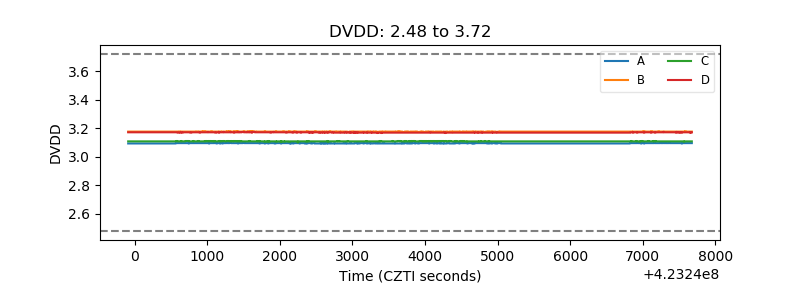 |
| Temperature 1 | 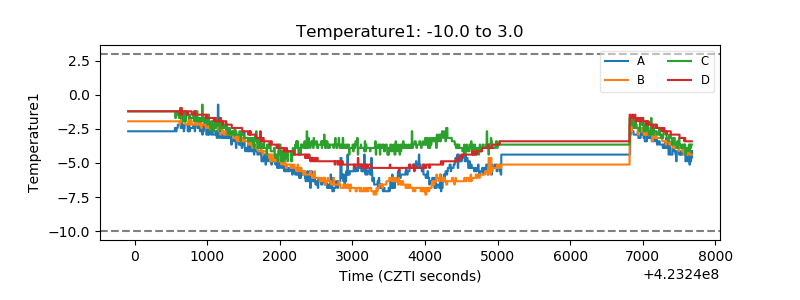 |
| Veto HV Monitor | 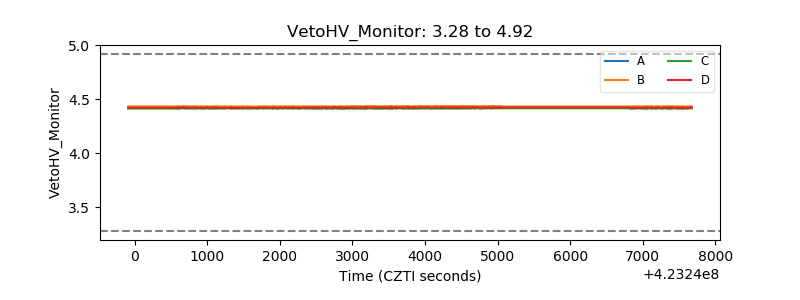 |
| Veto LLD | 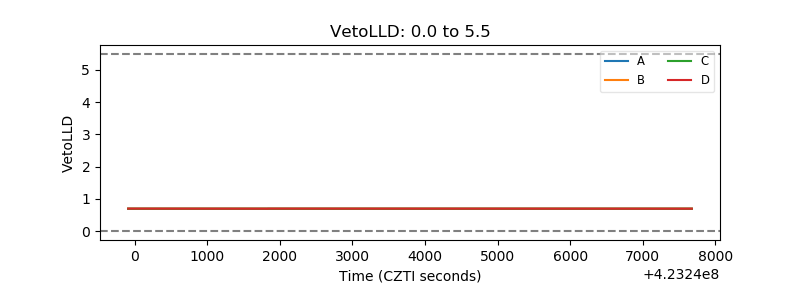 |
| Alpha Counter | 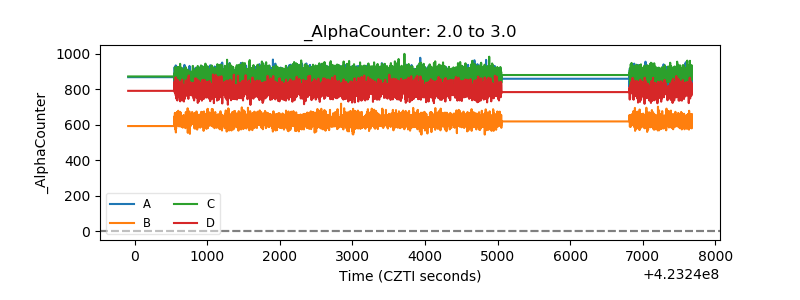 |
| _CPM_Rate | 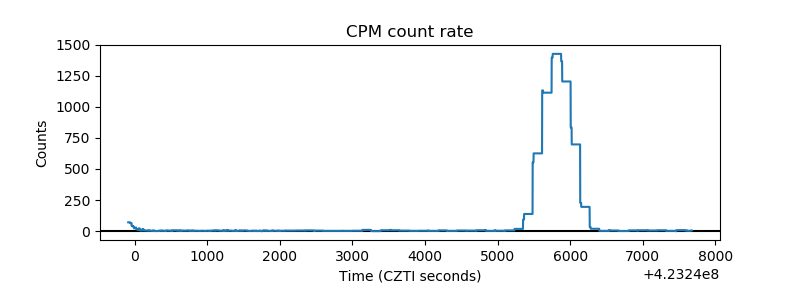 |
| CZT Counter | 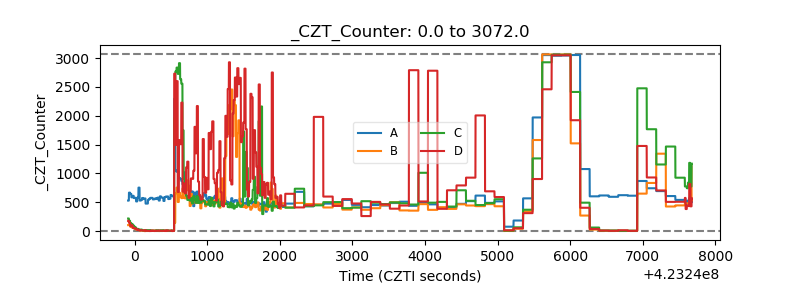 |
| +2.5 Volts monitor | 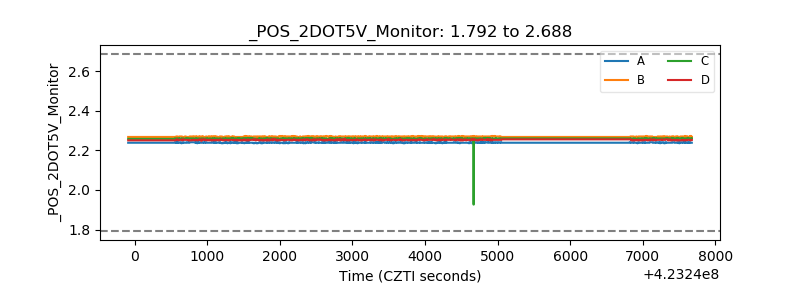 |
| +5 Volts monitor | 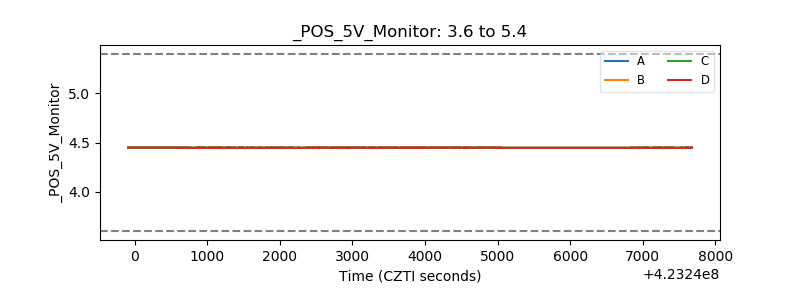 |
| _ROLL_ROT | 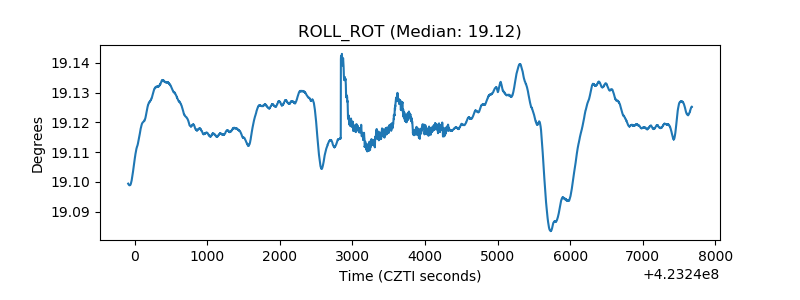 |
| _Roll_DEC | 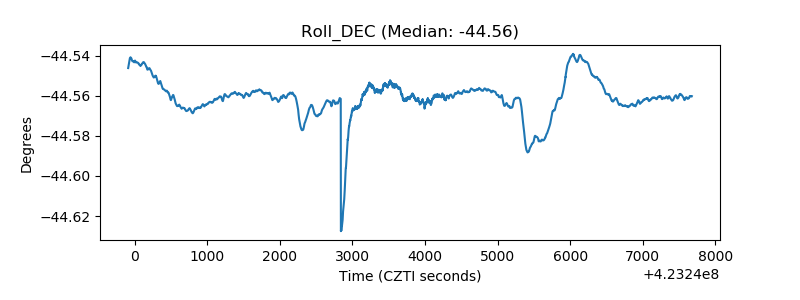 |
| _Roll_RA | 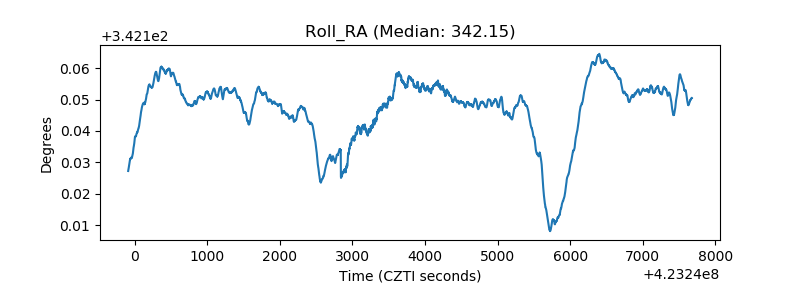 |
| Veto Counter | 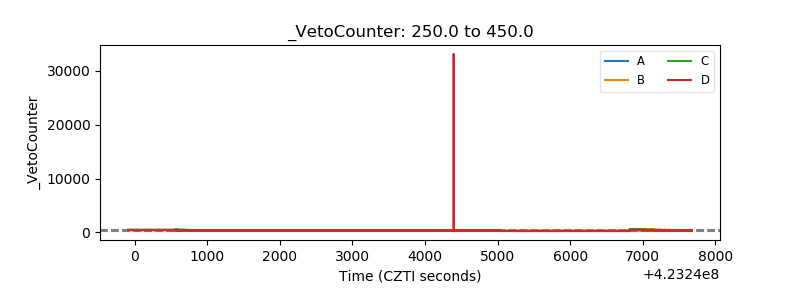 |