| Param | Original file | Final file |
|---|---|---|
| Filename | modeM0/AS1A12_035T02_9000005676_41487cztM0_level2.fits | modeM0/AS1A12_035T02_9000005676_41487cztM0_level2_quad_clean.evt |
| Size (bytes) | 370,981,440 | 88,050,240 |
| Size | 353.8 MB | 84.0 MB |
| Events in quadrant A | 2,919,088 | 615,947 |
| Events in quadrant B | 2,729,894 | 623,533 |
| Events in quadrant C | 4,048,572 | 551,223 |
| Events in quadrant D | 3,640,647 | 520,630 |
| Mode SS | |||
|---|---|---|---|
| Quadrant | BADHDUFLAG | Total packets | Discarded packets |
| A | 0 | 102 | 0 |
| B | 0 | 102 | 0 |
| C | 0 | 102 | 0 |
| D | 0 | 102 | 0 |
| Mode M0 | |||
|---|---|---|---|
| Quadrant | BADHDUFLAG | Total packets | Discarded packets |
| A | 0 | 11838 | 3 |
| B | 0 | 11558 | 2 |
| C | 0 | 15280 | 2 |
| D | 0 | 14268 | 2 |
| Mode M9 | |||
|---|---|---|---|
| Quadrant | BADHDUFLAG | Total packets | Discarded packets |
| A | 0 | 25 | 0 |
| B | 0 | 25 | 0 |
| C | 0 | 25 | 0 |
| D | 0 | 26 | 0 |
| Quadrant | Total seconds | Saturated seconds | Saturation percentage |
|---|---|---|---|
| A | 5068 | 23 | 0.453828% |
| B | 5068 | 72 | 1.420679% |
| C | 5068 | 299 | 5.899763% |
| D | 5068 | 336 | 6.629834% |
Noise dominated data is calculated using 1-second bins in cleaned event files. If a bin has >2000 counts, and if more than 50% of those come from <1% of pixels, then it is considered to be noise-dominated and hence unusable.
| Quadrant | # 1 sec bins | Bins with >0 counts | Bins with >2000 counts | High rate bins dominated by noise | Noise dominated (total time) | Noise dominated (detector-on time) | Marked lightcurve |
|---|---|---|---|---|---|---|---|
| A | 6981 | 5069 | 10 | 10 | 0.14% | 0.20% | 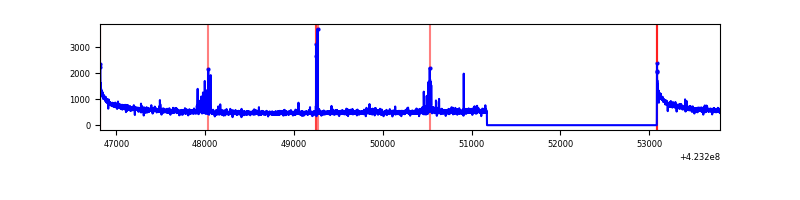 |
| B | 6981 | 5069 | 37 | 37 | 0.53% | 0.73% | 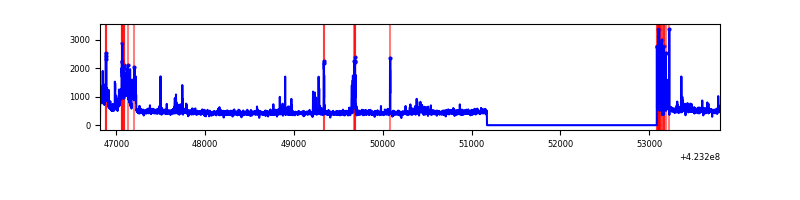 |
| C | 6981 | 5069 | 282 | 282 | 4.04% | 5.56% | 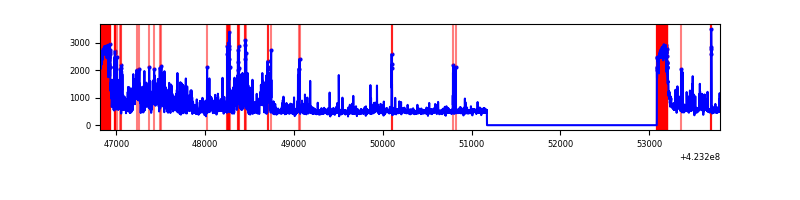 |
| D | 6981 | 5069 | 315 | 315 | 4.51% | 6.21% | 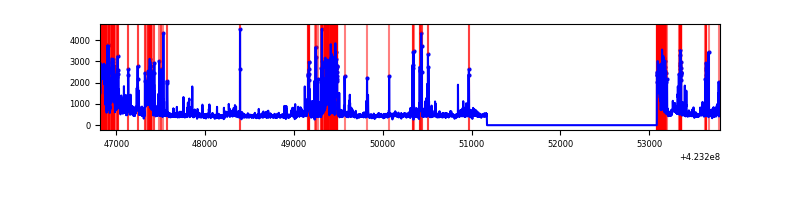 |
Top three noisy pixels from each quadrant. If the there are fewer than three noisy pixels in the level2.evt file, extra rows are filled as -1
| Pixel properties | Quadrant properties | ||||||
|---|---|---|---|---|---|---|---|
| Quadrant | DetID | PixID | Counts | Sigma | Mean | Median | Sigma |
| A | 10 | 83 | 511188 | 4302.13 | 583 | 572 | 118.7 |
| A | 2 | 79 | 86515 | 724.1 | 583 | 572 | 118.7 |
| A | 13 | 248 | 37812 | 313.76 | 583 | 572 | 118.7 |
| B | 0 | 186 | 283312 | 2565.21 | 579 | 563 | 110.2 |
| B | 0 | 190 | 131609 | 1188.9 | 579 | 563 | 110.2 |
| B | 0 | 245 | 19780 | 174.34 | 579 | 563 | 110.2 |
| C | 9 | 54 | 1043297 | 8275.03 | 539 | 542 | 126.0 |
| C | 0 | 10 | 635823 | 5041.42 | 539 | 542 | 126.0 |
| C | 15 | 214 | 208692 | 1651.82 | 539 | 542 | 126.0 |
| D | 12 | 16 | 941948 | 7001.0 | 549 | 535 | 134.5 |
| D | 12 | 6 | 140017 | 1037.29 | 549 | 535 | 134.5 |
| D | 1 | 47 | 115120 | 852.13 | 549 | 535 | 134.5 |
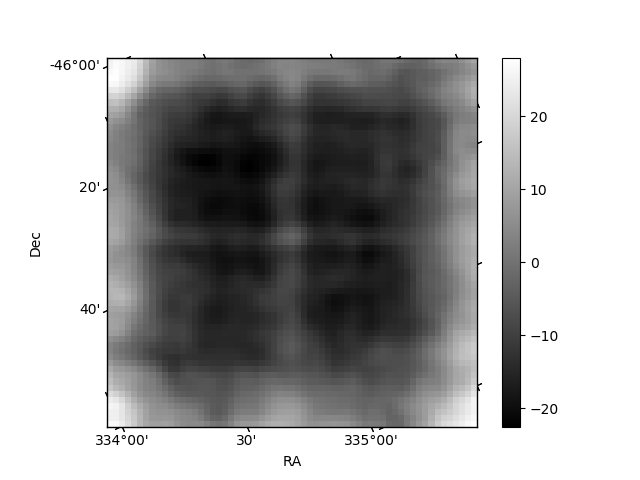
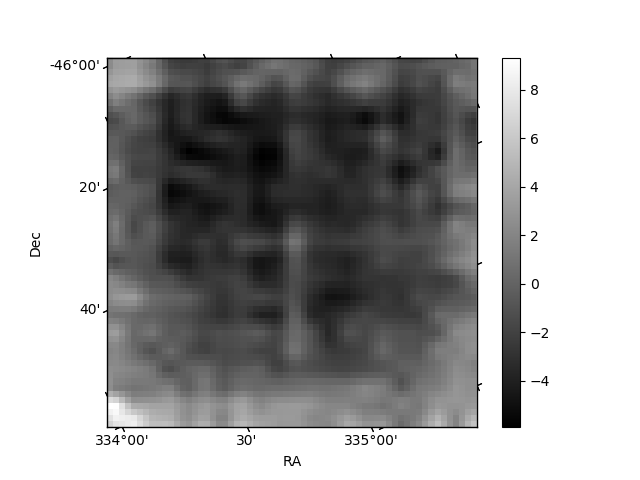
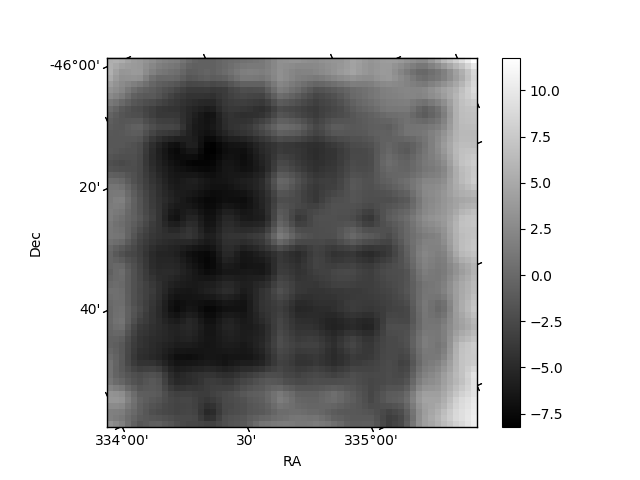
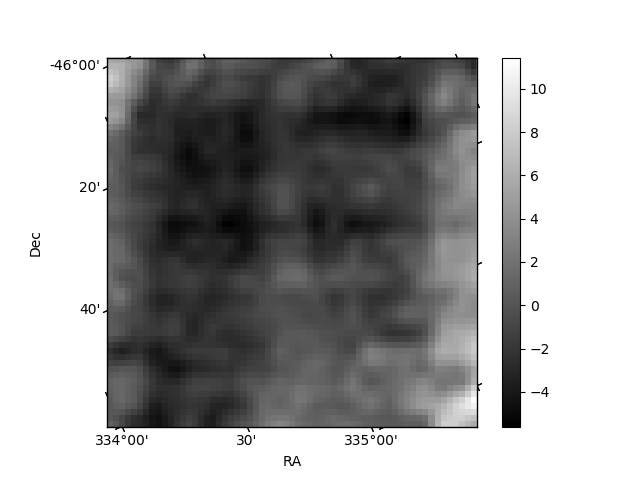
Histogram calculated using DETX and DETY for each event in the final _common_clean file
| Quadrant A | 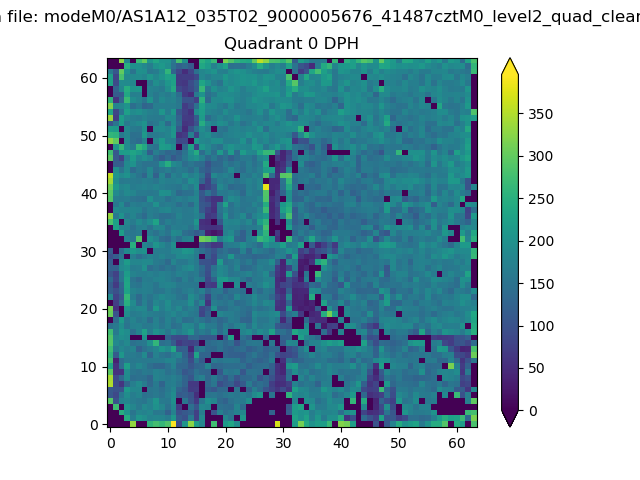 |
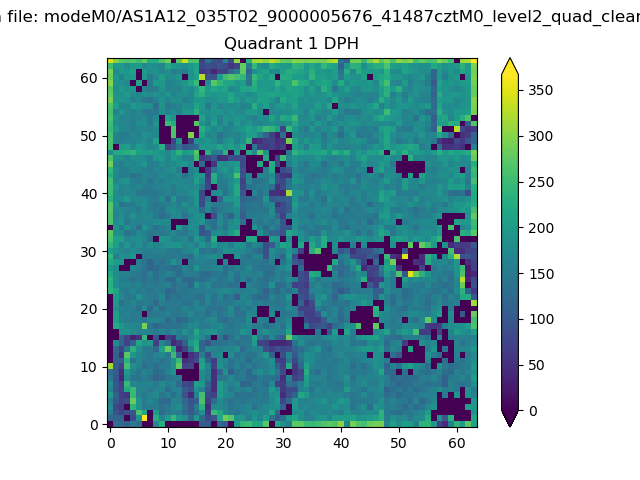 |
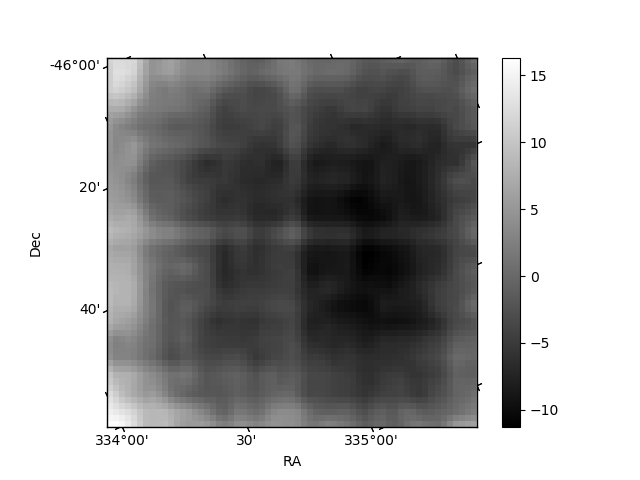
Quadrant B |
|---|---|---|---|
| Quadrant D | 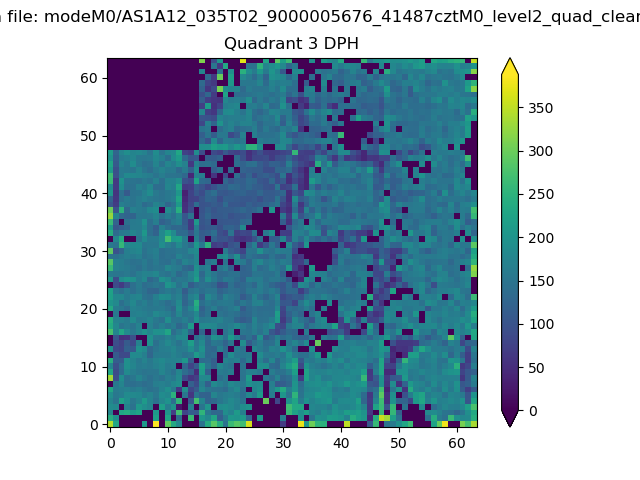 |
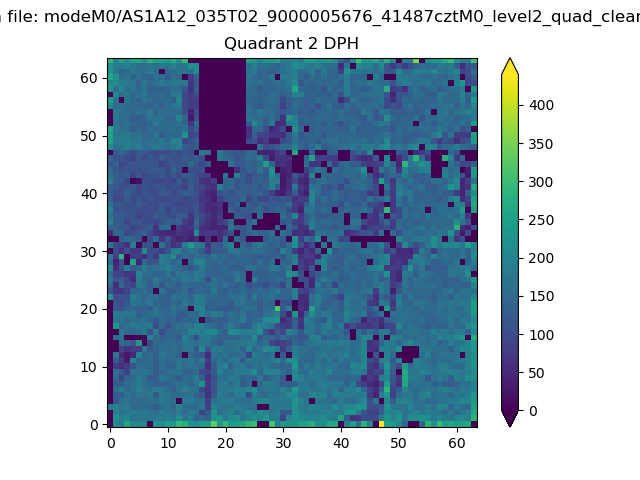 |
Quadrant C |
| Plot type | Count rate plots | Images |
|---|---|---|
| Comparison with Poisson distribution Blue bars denote a histogram of data divided into 1 sec bins. Red curve is a Poisson curve with rate = median count rate of data. |
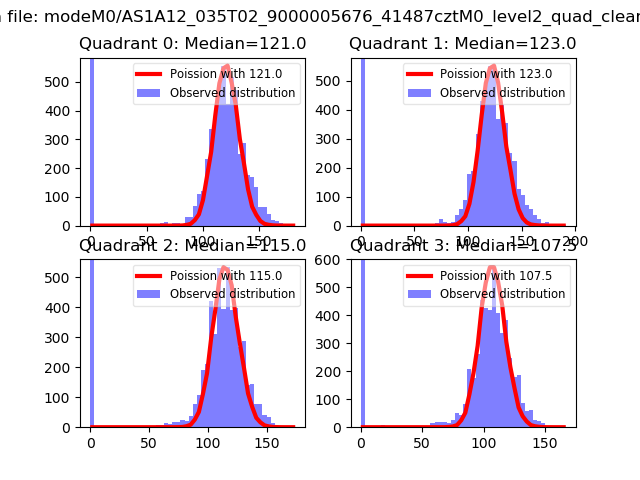 |
 |
| Quadrant-wise count rates Data is divided into 100 sec bins |
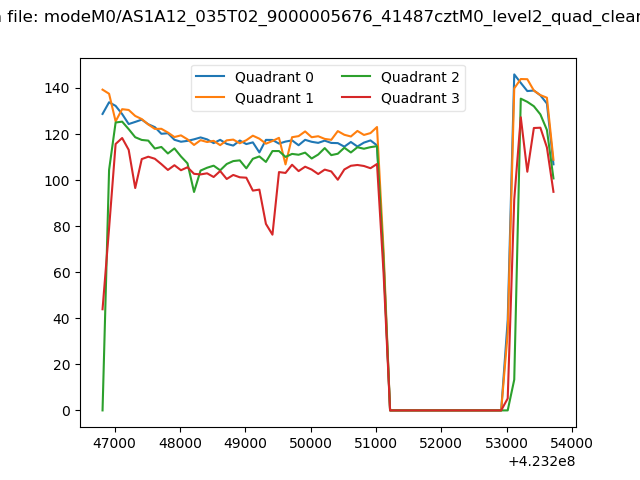 |
|
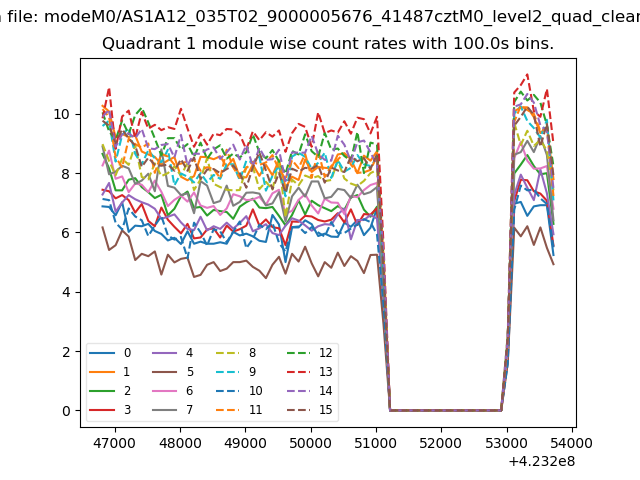
| Module-wise count rates for Quadrant A Data is divided into 100 sec bins |
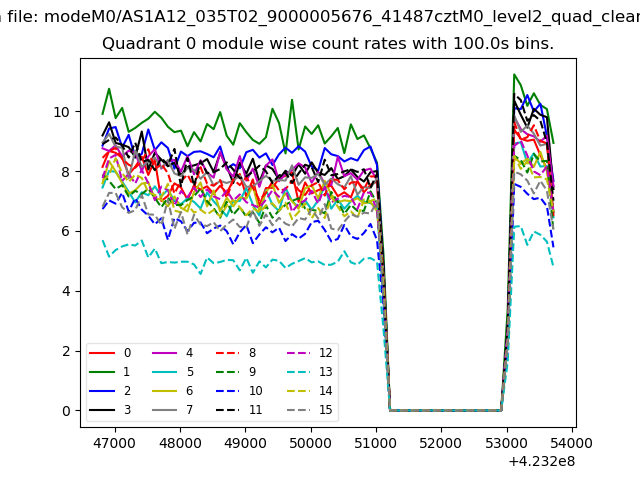 |
 |
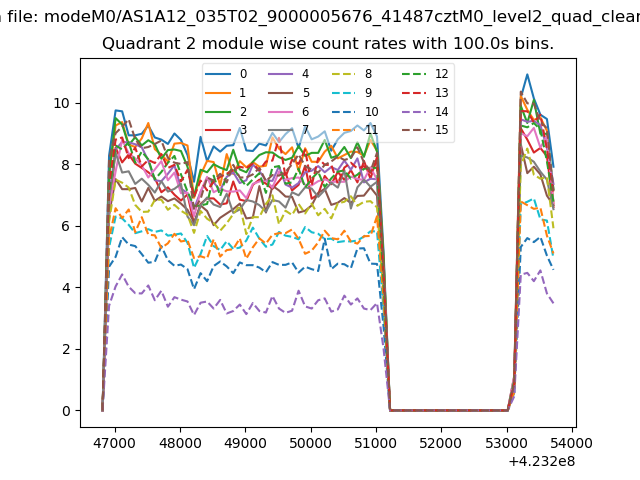
| Module-wise count rates for Quadrant B Data is divided into 100 sec bins |
 |
 |
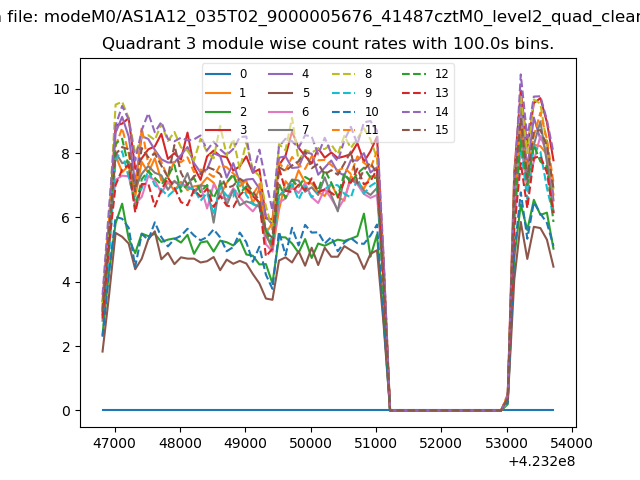
| Module-wise count rates for Quadrant C Data is divided into 100 sec bins |
 |
 |
| Module-wise count rates for Quadrant D Data is divided into 100 sec bins |
 |
 |
| Parameter | Plot |
|---|---|
| CZT HV Monitor | 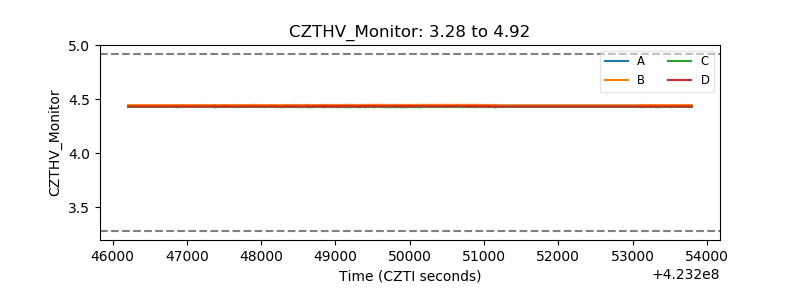 |
| D_VDD | 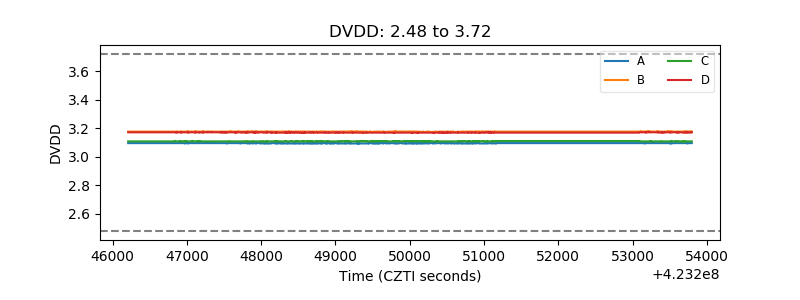 |
| Temperature 1 | 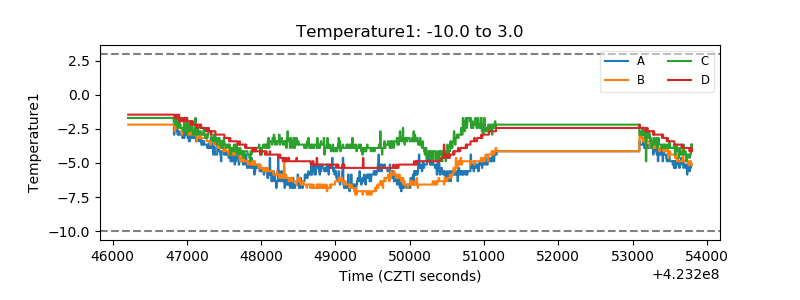 |
| Veto HV Monitor | 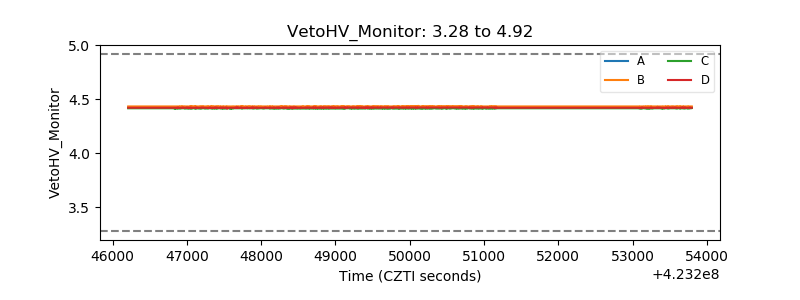 |
| Veto LLD | 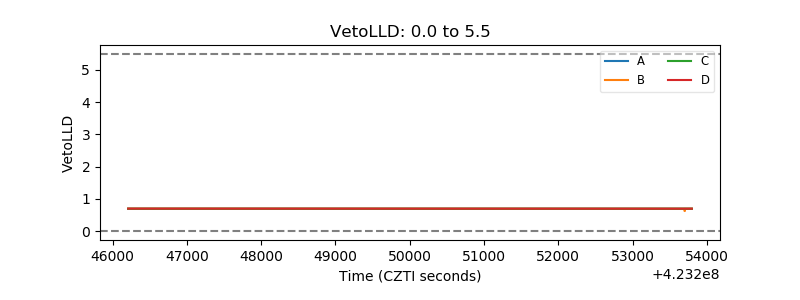 |
| Alpha Counter | 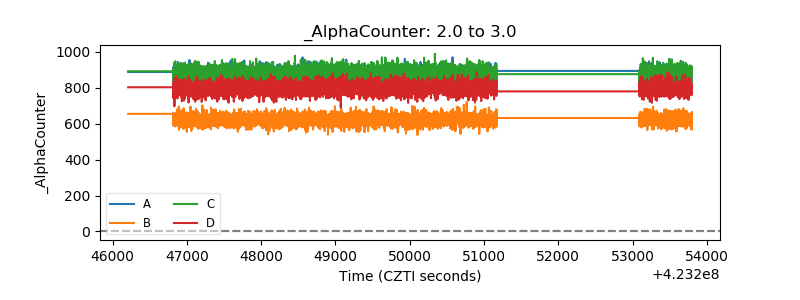 |
| _CPM_Rate | 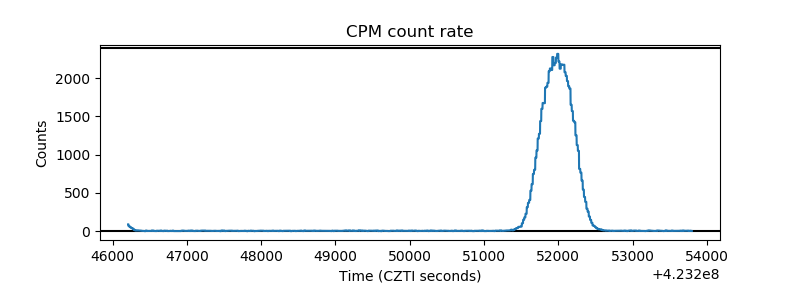 |
| CZT Counter | 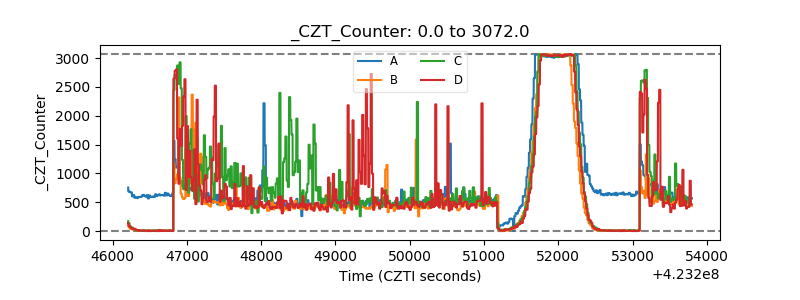 |
| +2.5 Volts monitor | 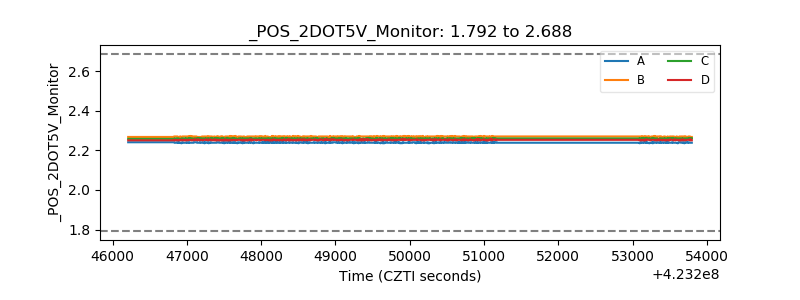 |
| +5 Volts monitor | 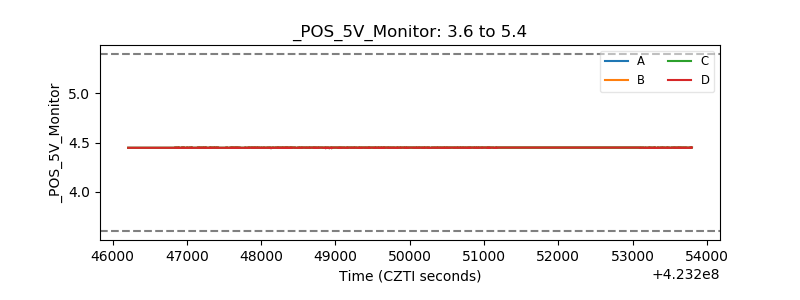 |
| _ROLL_ROT | 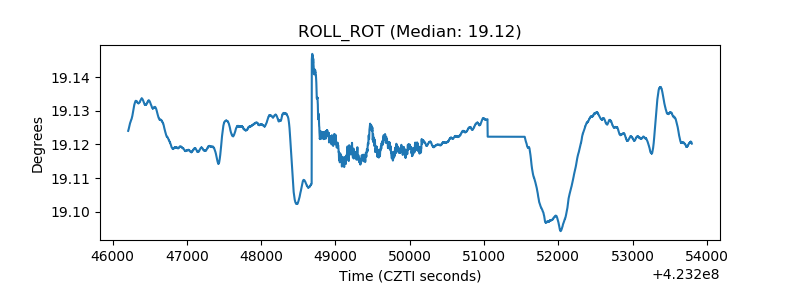 |
| _Roll_DEC | 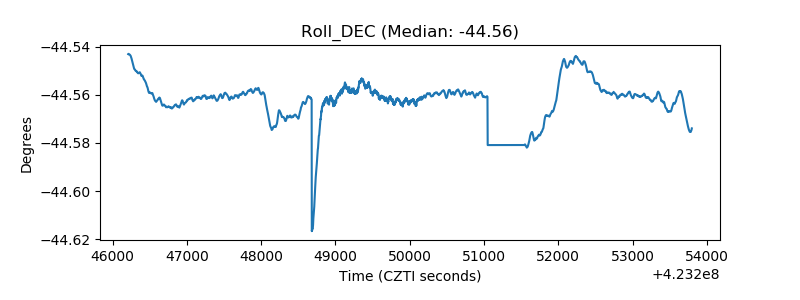 |
| _Roll_RA | 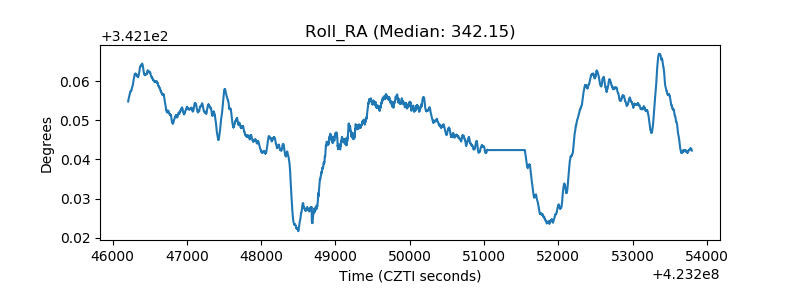 |
| Veto Counter | 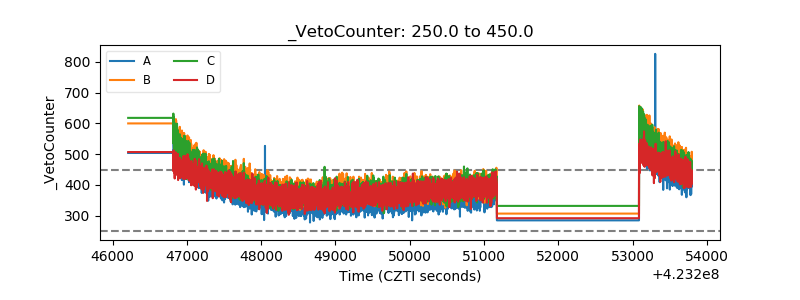 |