| Param | Original file | Final file |
|---|---|---|
| Filename | modeM0/AS1A12_035T02_9000005676_41488cztM0_level2.fits | modeM0/AS1A12_035T02_9000005676_41488cztM0_level2_quad_clean.evt |
| Size (bytes) | 346,933,440 | 91,635,840 |
| Size | 330.9 MB | 87.4 MB |
| Events in quadrant A | 2,840,865 | 644,968 |
| Events in quadrant B | 2,507,928 | 655,176 |
| Events in quadrant C | 4,061,068 | 563,143 |
| Events in quadrant D | 3,040,097 | 558,241 |
| Mode SS | |||
|---|---|---|---|
| Quadrant | BADHDUFLAG | Total packets | Discarded packets |
| A | 0 | 104 | 0 |
| B | 0 | 104 | 0 |
| C | 0 | 104 | 0 |
| D | 0 | 104 | 0 |
| Mode M0 | |||
|---|---|---|---|
| Quadrant | BADHDUFLAG | Total packets | Discarded packets |
| A | 0 | 11429 | 3 |
| B | 0 | 10705 | 2 |
| C | 0 | 15186 | 2 |
| D | 0 | 12423 | 2 |
| Mode M9 | |||
|---|---|---|---|
| Quadrant | BADHDUFLAG | Total packets | Discarded packets |
| A | 0 | 34 | 0 |
| B | 0 | 34 | 0 |
| C | 0 | 34 | 0 |
| D | 0 | 35 | 0 |
| Quadrant | Total seconds | Saturated seconds | Saturation percentage |
|---|---|---|---|
| A | 5038 | 15 | 0.297737% |
| B | 5038 | 29 | 0.575625% |
| C | 5038 | 415 | 8.237396% |
| D | 5038 | 137 | 2.719333% |
Noise dominated data is calculated using 1-second bins in cleaned event files. If a bin has >2000 counts, and if more than 50% of those come from <1% of pixels, then it is considered to be noise-dominated and hence unusable.
| Quadrant | # 1 sec bins | Bins with >0 counts | Bins with >2000 counts | High rate bins dominated by noise | Noise dominated (total time) | Noise dominated (detector-on time) | Marked lightcurve |
|---|---|---|---|---|---|---|---|
| A | 7071 | 5039 | 5 | 5 | 0.07% | 0.10% | 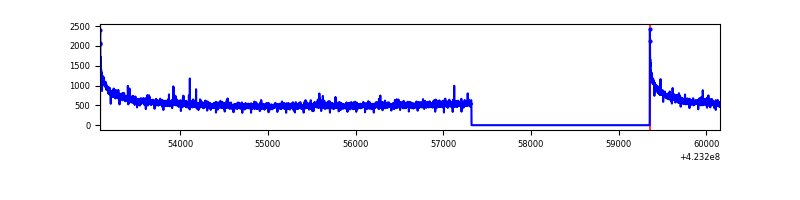 |
| B | 7071 | 5039 | 19 | 19 | 0.27% | 0.38% | 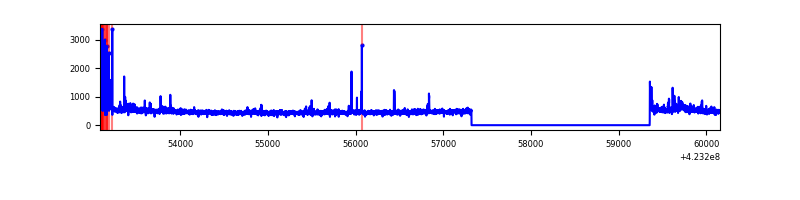 |
| C | 7070 | 5038 | 390 | 390 | 5.52% | 7.74% | 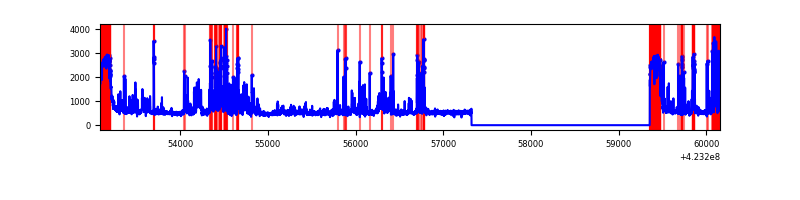 |
| D | 7071 | 5039 | 125 | 125 | 1.77% | 2.48% | 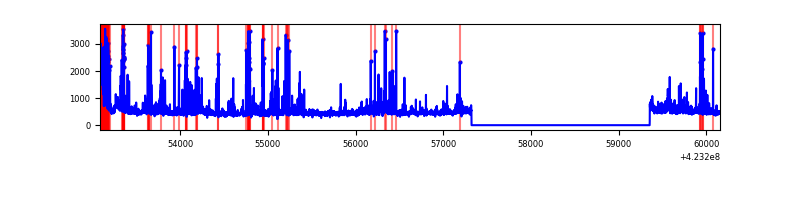 |
Top three noisy pixels from each quadrant. If the there are fewer than three noisy pixels in the level2.evt file, extra rows are filled as -1
| Pixel properties | Quadrant properties | ||||||
|---|---|---|---|---|---|---|---|
| Quadrant | DetID | PixID | Counts | Sigma | Mean | Median | Sigma |
| A | 10 | 83 | 501479 | 4158.57 | 595 | 583 | 120.4 |
| A | 2 | 79 | 24921 | 202.06 | 595 | 583 | 120.4 |
| A | 13 | 254 | 8974 | 69.66 | 595 | 583 | 120.4 |
| B | 0 | 190 | 81296 | 715.12 | 591 | 576 | 112.9 |
| B | 0 | 186 | 62238 | 546.28 | 591 | 576 | 112.9 |
| B | 0 | 245 | 18877 | 162.13 | 591 | 576 | 112.9 |
| C | 0 | 10 | 680061 | 5407.06 | 548 | 553 | 125.7 |
| C | 14 | 254 | 587701 | 4672.12 | 548 | 553 | 125.7 |
| C | 9 | 54 | 303170 | 2408.02 | 548 | 553 | 125.7 |
| D | 1 | 47 | 205734 | 1474.25 | 573 | 558 | 139.2 |
| D | 12 | 6 | 141089 | 1009.76 | 573 | 558 | 139.2 |
| D | 12 | 16 | 117168 | 837.88 | 573 | 558 | 139.2 |
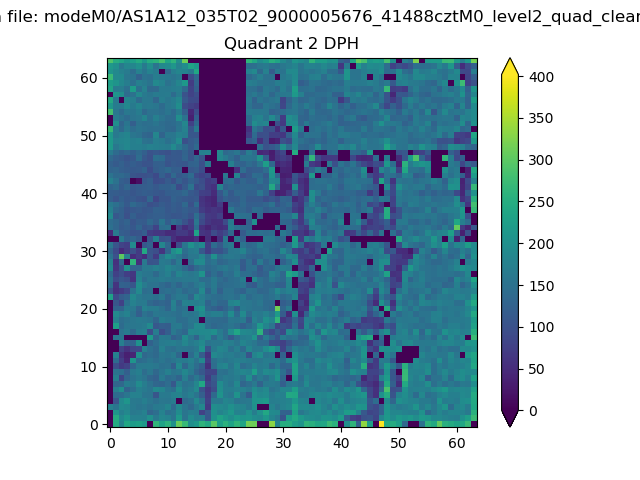
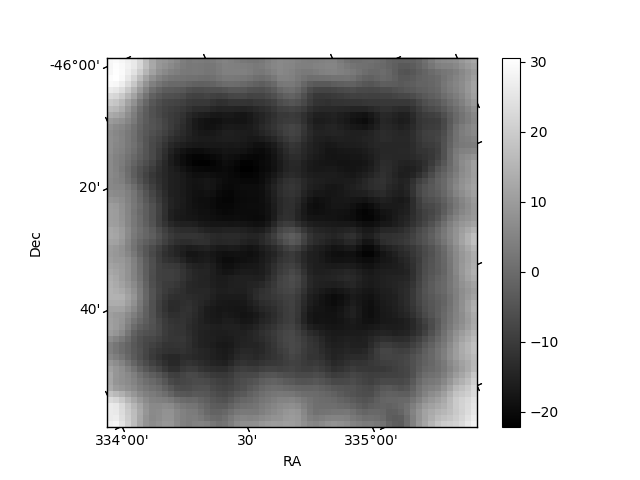
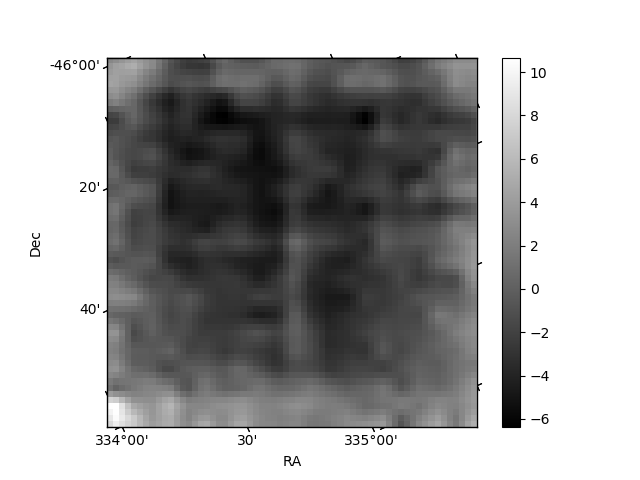
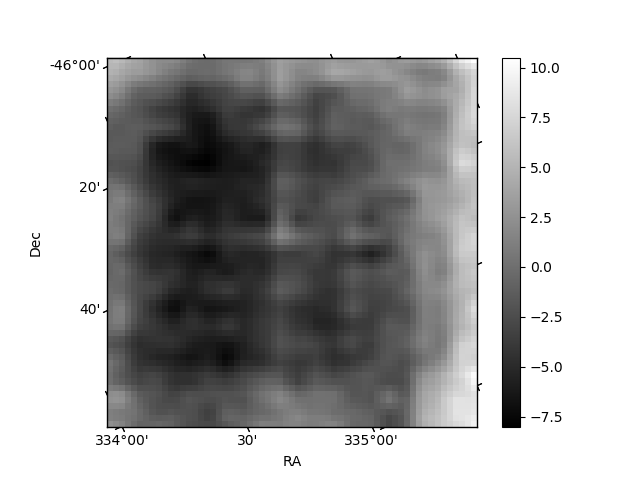
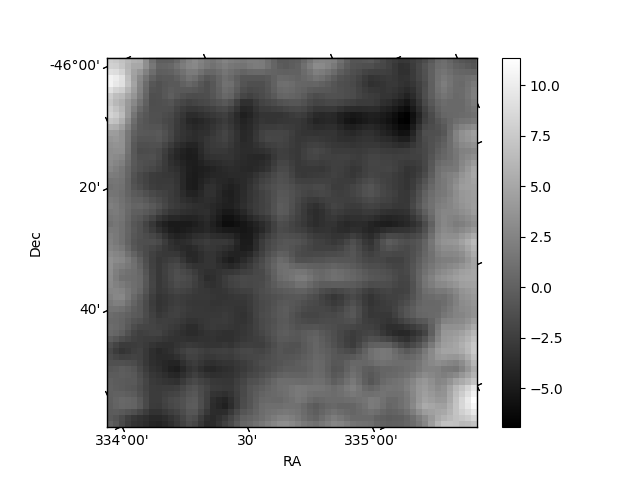
Histogram calculated using DETX and DETY for each event in the final _common_clean file
| Quadrant A | 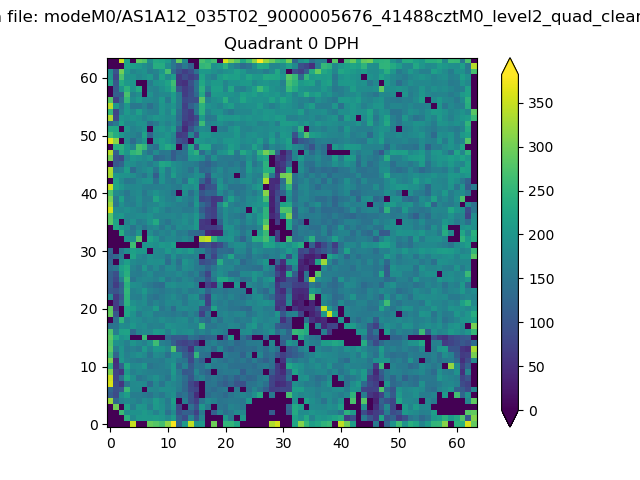 |
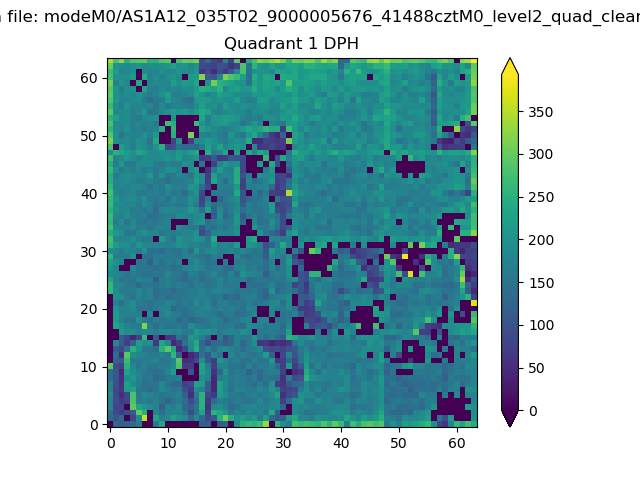 |
Quadrant B |
|---|---|---|---|
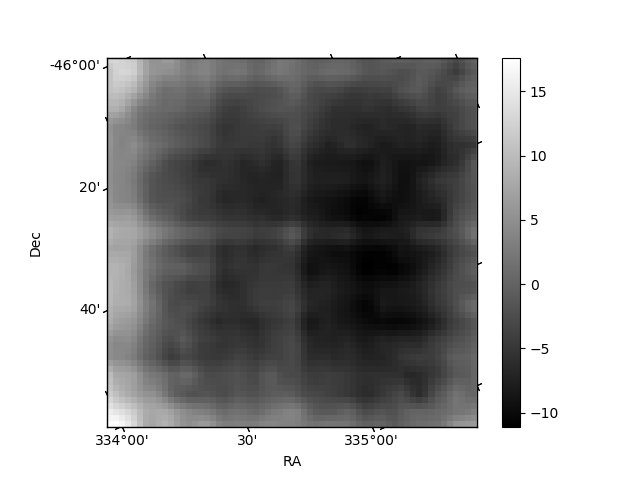
| Quadrant D | 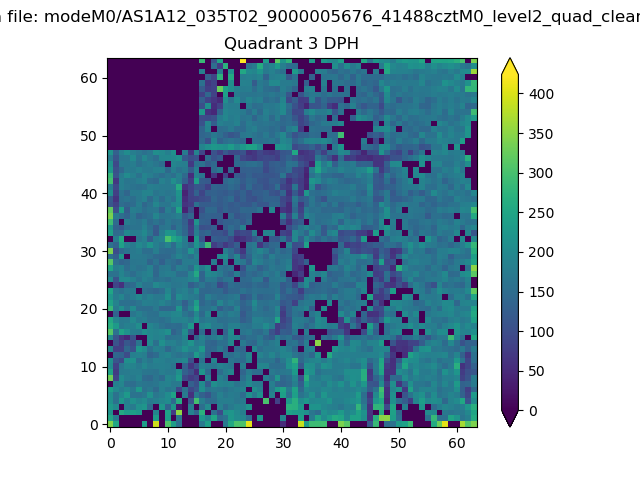 |
 |
Quadrant C |
| Plot type | Count rate plots | Images |
|---|---|---|
| Comparison with Poisson distribution Blue bars denote a histogram of data divided into 1 sec bins. Red curve is a Poisson curve with rate = median count rate of data. |
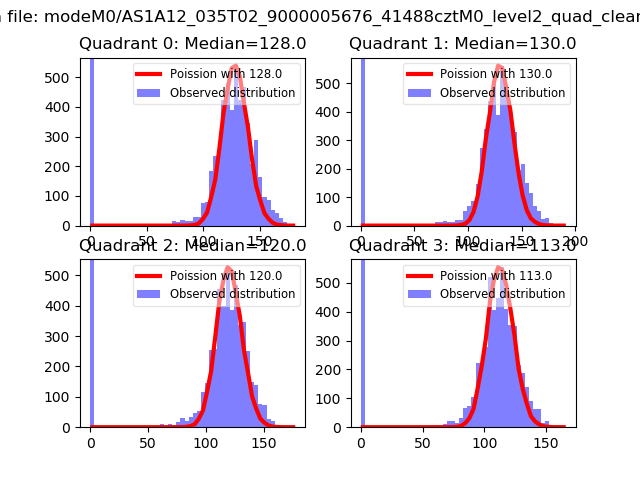 |
 |
| Quadrant-wise count rates Data is divided into 100 sec bins |
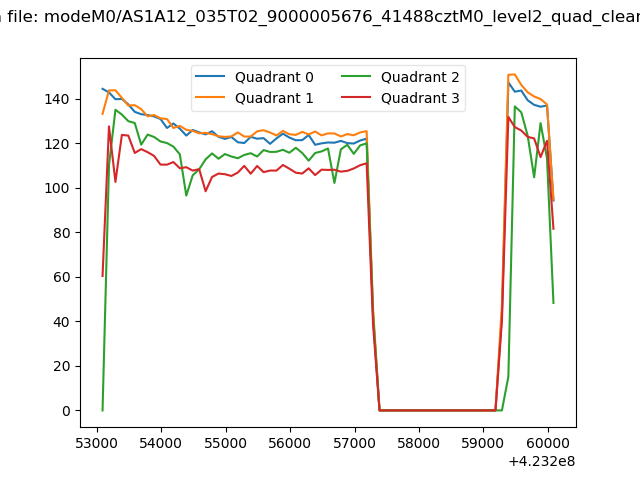 |
|
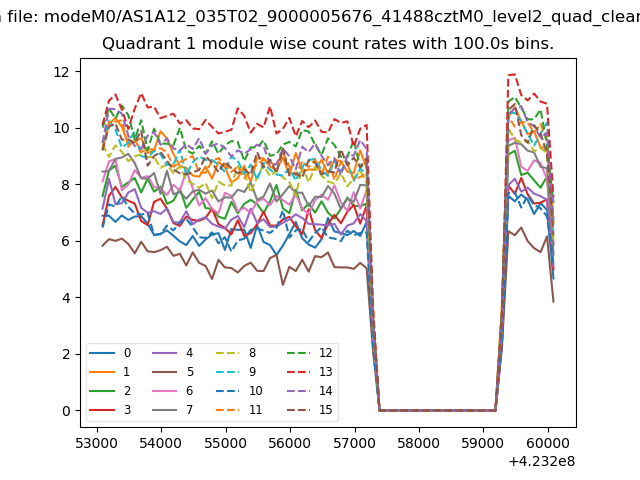
| Module-wise count rates for Quadrant A Data is divided into 100 sec bins |
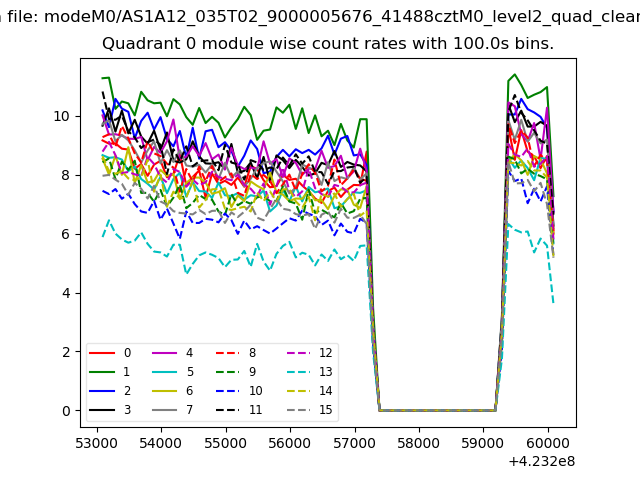 |
 |
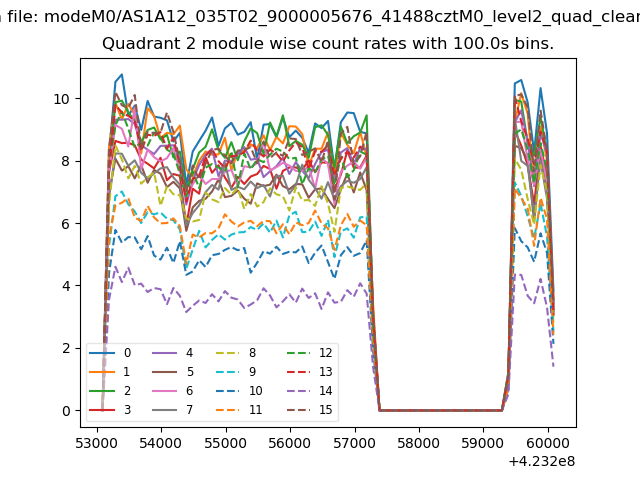
| Module-wise count rates for Quadrant B Data is divided into 100 sec bins |
 |
 |
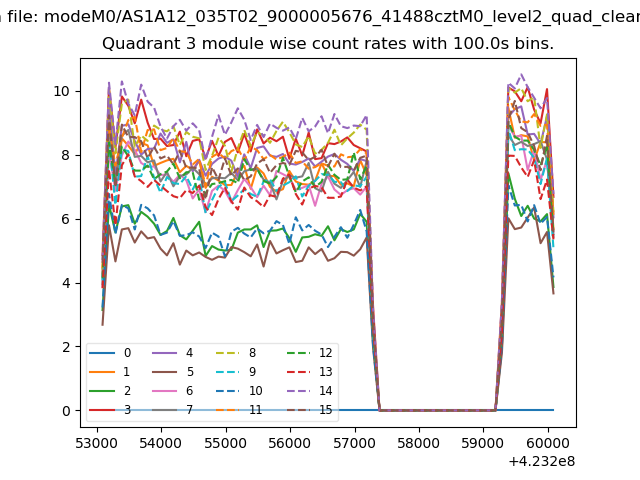
| Module-wise count rates for Quadrant C Data is divided into 100 sec bins |
 |
 |
| Module-wise count rates for Quadrant D Data is divided into 100 sec bins |
 |
 |
| Parameter | Plot |
|---|---|
| CZT HV Monitor | 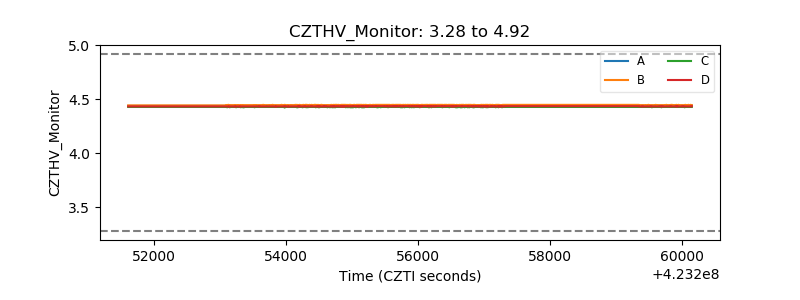 |
| D_VDD | 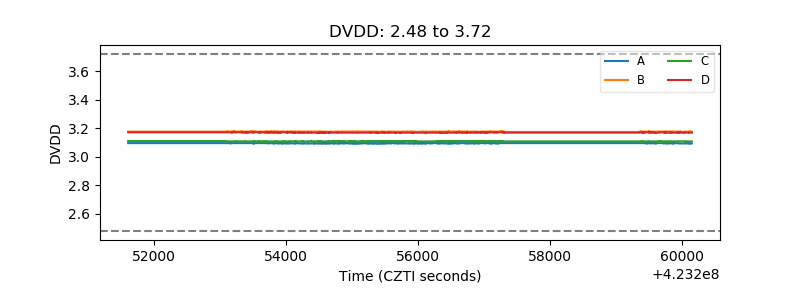 |
| Temperature 1 | 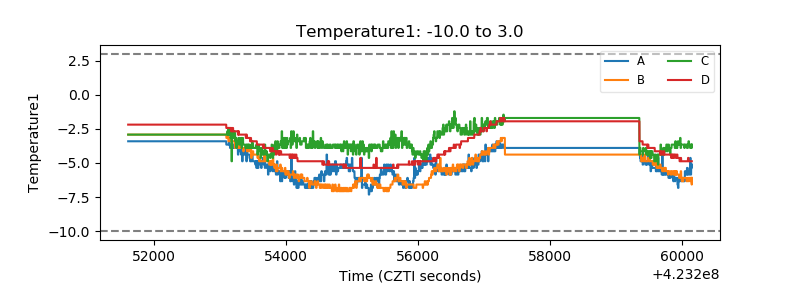 |
| Veto HV Monitor |  |
| Veto LLD | 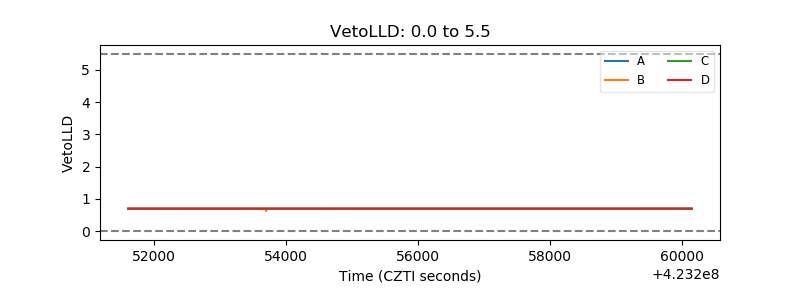 |
| Alpha Counter | 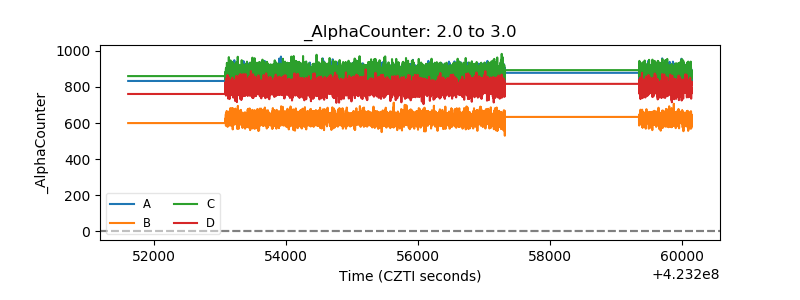 |
| _CPM_Rate | 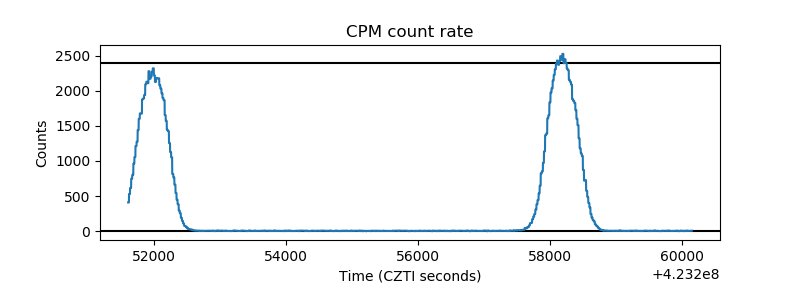 |
| CZT Counter | 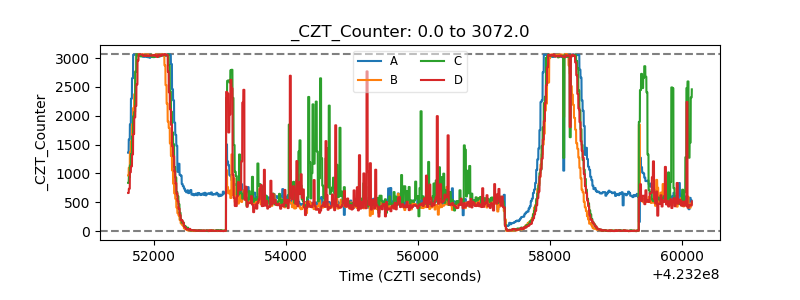 |
| +2.5 Volts monitor | 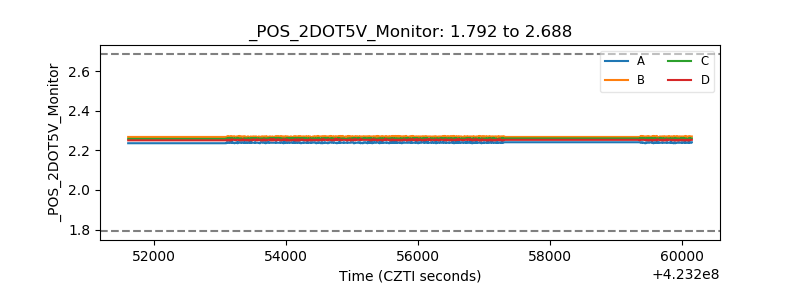 |
| +5 Volts monitor | 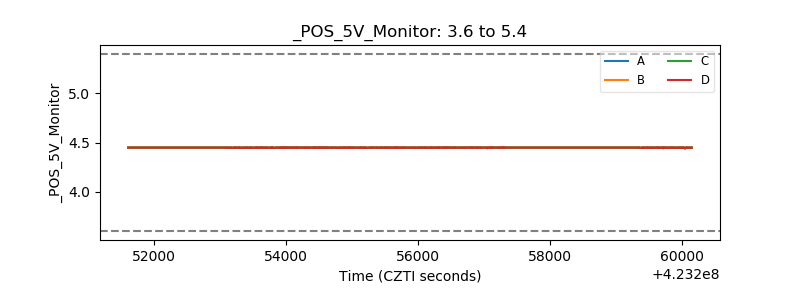 |
| _ROLL_ROT | 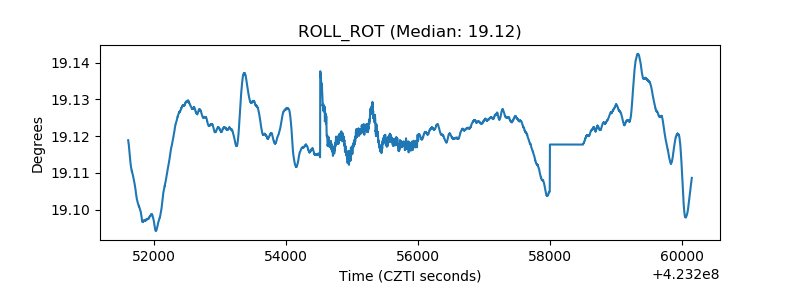 |
| _Roll_DEC | 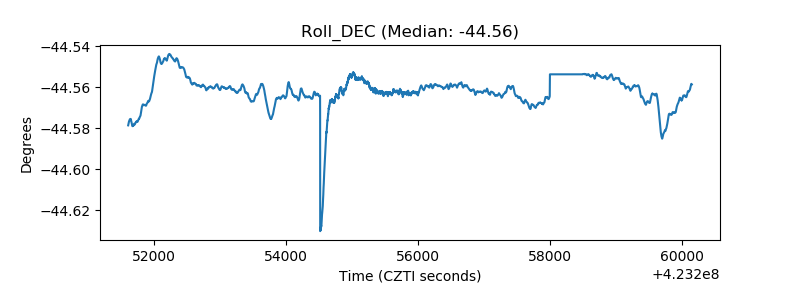 |
| _Roll_RA | 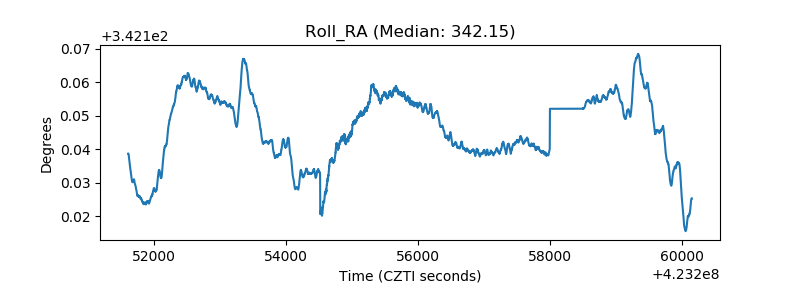 |
| Veto Counter | 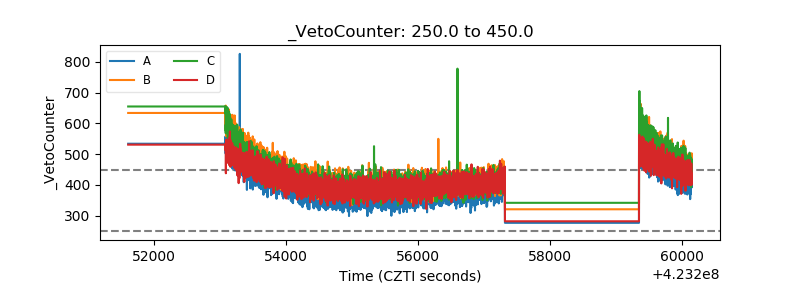 |