| Param | Original file | Final file |
|---|---|---|
| Filename | modeM0/AS1A12_035T02_9000005676_41489cztM0_level2.fits | modeM0/AS1A12_035T02_9000005676_41489cztM0_level2_quad_clean.evt |
| Size (bytes) | 316,048,320 | 88,721,280 |
| Size | 301.4 MB | 84.6 MB |
| Events in quadrant A | 2,728,151 | 617,103 |
| Events in quadrant B | 2,321,873 | 633,736 |
| Events in quadrant C | 3,675,849 | 548,301 |
| Events in quadrant D | 2,595,085 | 547,626 |
| Mode SS | |||
|---|---|---|---|
| Quadrant | BADHDUFLAG | Total packets | Discarded packets |
| A | 0 | 98 | 0 |
| B | 0 | 98 | 0 |
| C | 0 | 98 | 0 |
| D | 0 | 98 | 0 |
| Mode M0 | |||
|---|---|---|---|
| Quadrant | BADHDUFLAG | Total packets | Discarded packets |
| A | 0 | 10981 | 3 |
| B | 0 | 9954 | 2 |
| C | 0 | 13820 | 2 |
| D | 0 | 10923 | 2 |
| Mode M9 | |||
|---|---|---|---|
| Quadrant | BADHDUFLAG | Total packets | Discarded packets |
| A | 0 | 30 | 0 |
| B | 0 | 30 | 0 |
| C | 0 | 30 | 0 |
| D | 0 | 31 | 0 |
| Quadrant | Total seconds | Saturated seconds | Saturation percentage |
|---|---|---|---|
| A | 4850 | 12 | 0.247423% |
| B | 4850 | 5 | 0.103093% |
| C | 4850 | 384 | 7.917526% |
| D | 4850 | 58 | 1.195876% |
Noise dominated data is calculated using 1-second bins in cleaned event files. If a bin has >2000 counts, and if more than 50% of those come from <1% of pixels, then it is considered to be noise-dominated and hence unusable.
| Quadrant | # 1 sec bins | Bins with >0 counts | Bins with >2000 counts | High rate bins dominated by noise | Noise dominated (total time) | Noise dominated (detector-on time) | Marked lightcurve |
|---|---|---|---|---|---|---|---|
| A | 6974 | 4851 | 4 | 4 | 0.06% | 0.08% | 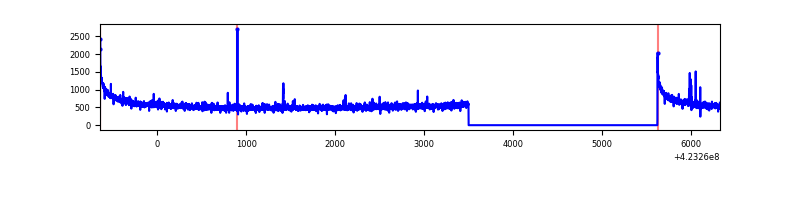 |
| B | 6974 | 4851 | 0 | 0 | 0.00% | 0.00% | 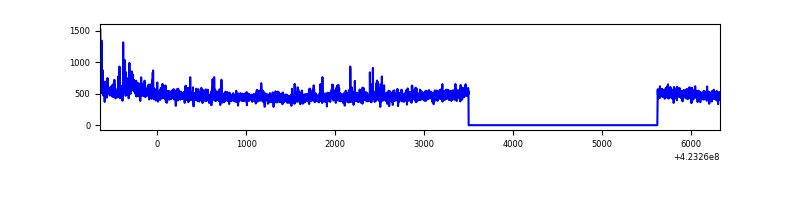 |
| C | 6974 | 4851 | 366 | 366 | 5.25% | 7.54% | 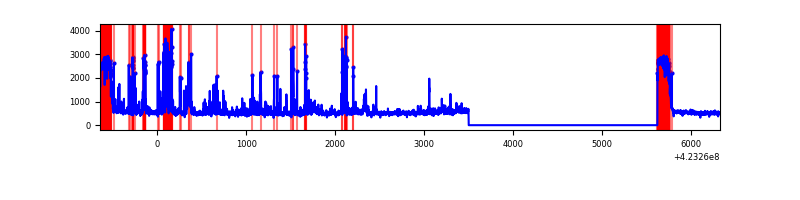 |
| D | 6974 | 4851 | 51 | 51 | 0.73% | 1.05% | 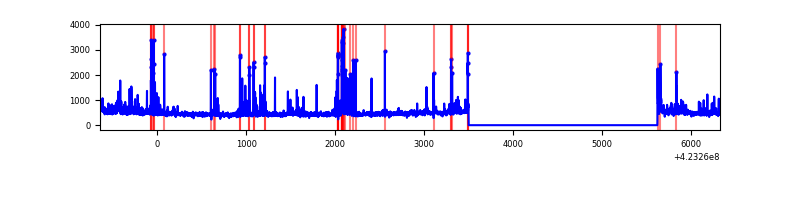 |
Top three noisy pixels from each quadrant. If the there are fewer than three noisy pixels in the level2.evt file, extra rows are filled as -1
| Pixel properties | Quadrant properties | ||||||
|---|---|---|---|---|---|---|---|
| Quadrant | DetID | PixID | Counts | Sigma | Mean | Median | Sigma |
| A | 10 | 83 | 481753 | 4194.27 | 570 | 559 | 114.7 |
| A | 13 | 248 | 19178 | 162.29 | 570 | 559 | 114.7 |
| A | 2 | 79 | 15017 | 126.02 | 570 | 559 | 114.7 |
| B | 0 | 190 | 56147 | 515.05 | 569 | 556 | 107.9 |
| B | 0 | 245 | 15946 | 142.59 | 569 | 556 | 107.9 |
| B | 12 | 111 | 13109 | 116.3 | 569 | 556 | 107.9 |
| C | 0 | 10 | 690924 | 5593.13 | 532 | 535 | 123.4 |
| C | 14 | 254 | 476221 | 3853.73 | 532 | 535 | 123.4 |
| C | 15 | 214 | 196967 | 1591.38 | 532 | 535 | 123.4 |
| D | 12 | 6 | 159604 | 1185.08 | 556 | 542 | 134.2 |
| D | 1 | 47 | 94316 | 698.66 | 556 | 542 | 134.2 |
| D | 2 | 249 | 44532 | 327.74 | 556 | 542 | 134.2 |
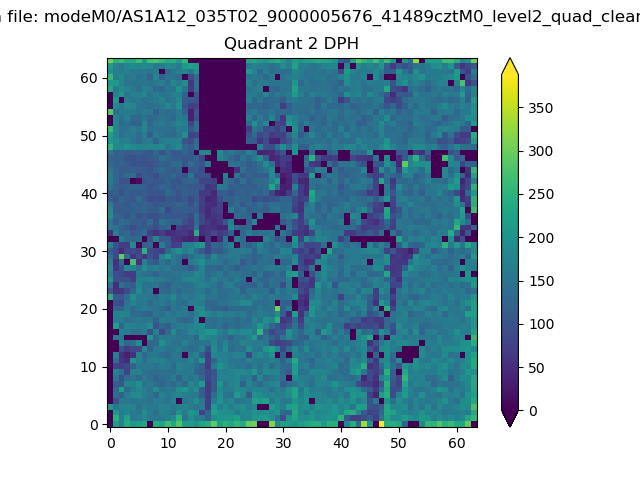
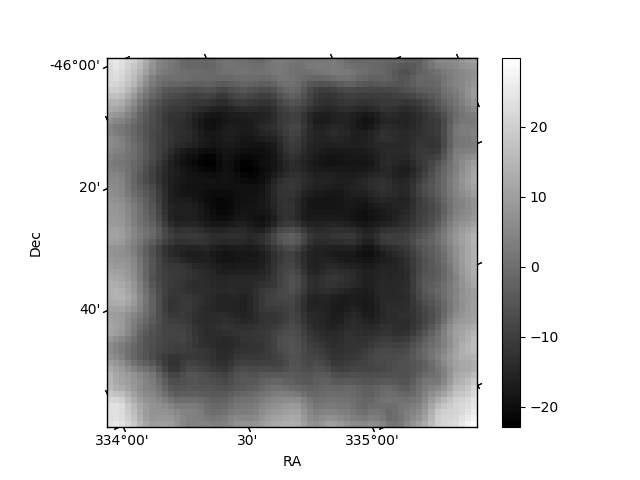
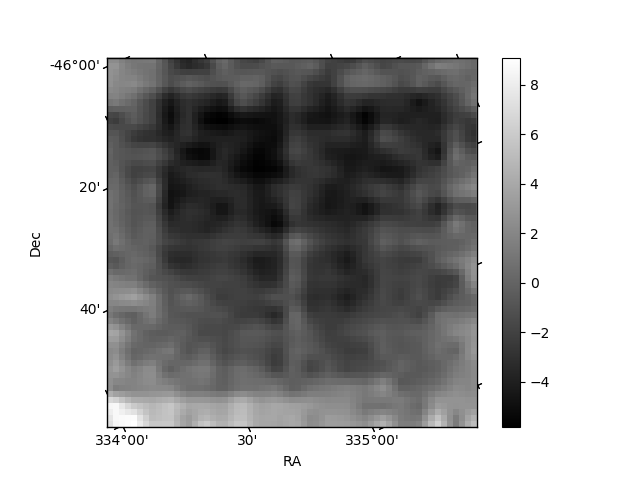
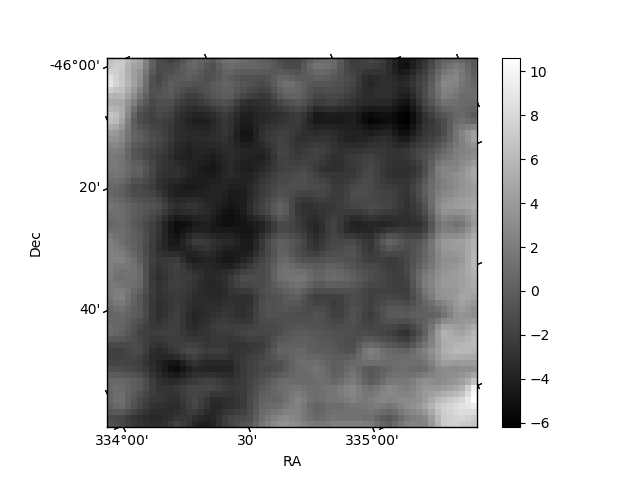
Histogram calculated using DETX and DETY for each event in the final _common_clean file
| Quadrant A | 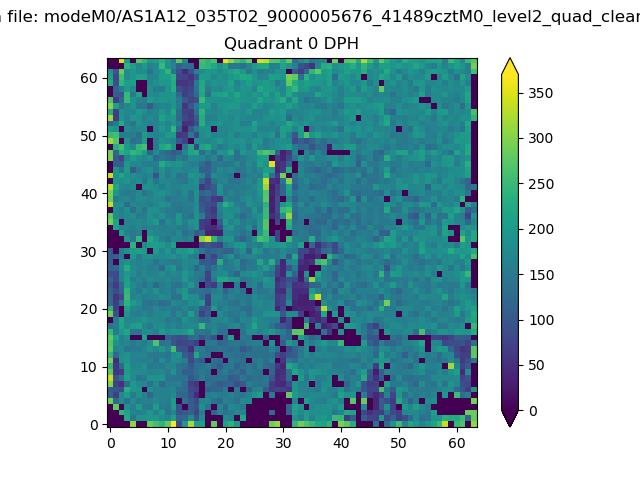 |
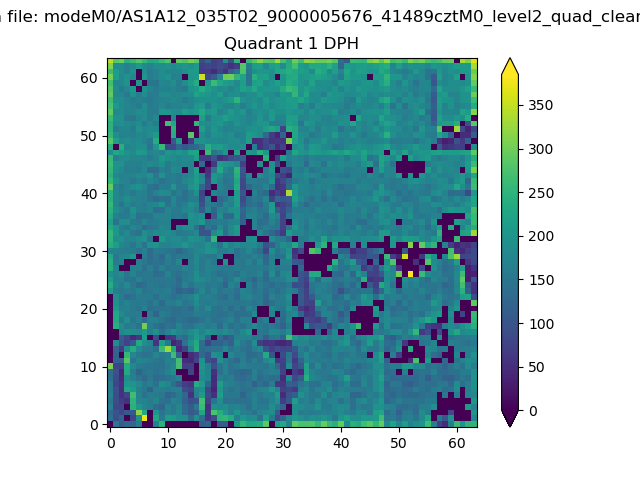 |
Quadrant B |
|---|---|---|---|
| Quadrant D | 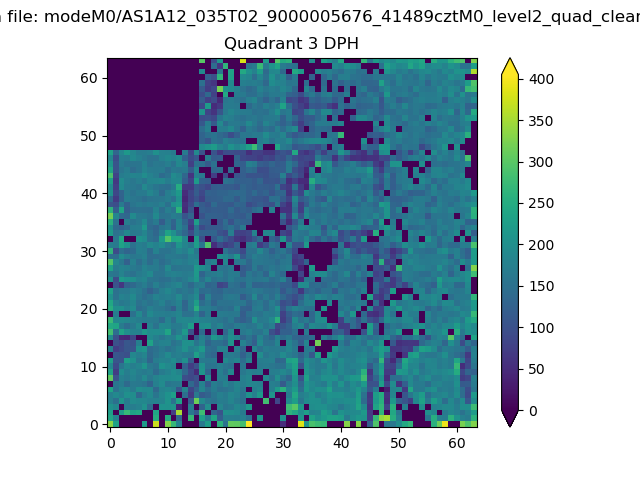 |
 |
Quadrant C |
| Plot type | Count rate plots | Images |
|---|---|---|
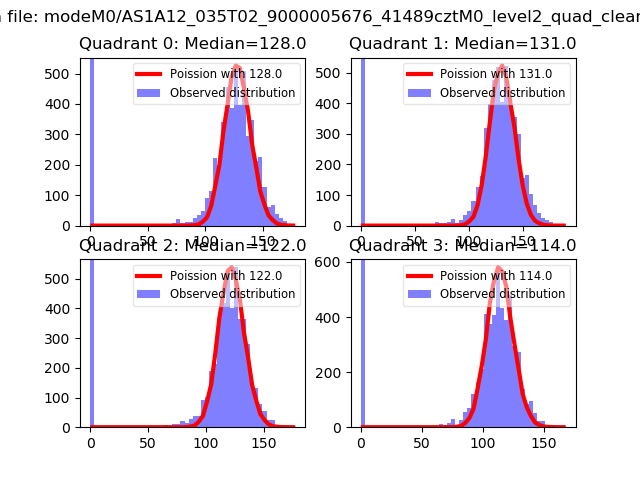
| Comparison with Poisson distribution Blue bars denote a histogram of data divided into 1 sec bins. Red curve is a Poisson curve with rate = median count rate of data. |
 |
 |
| Quadrant-wise count rates Data is divided into 100 sec bins |
 |
|
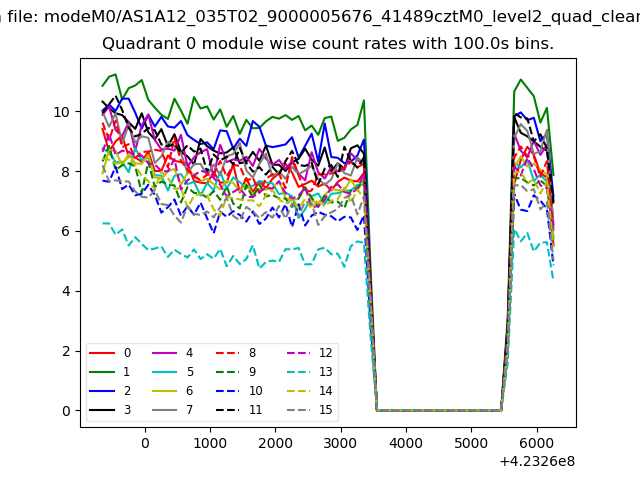
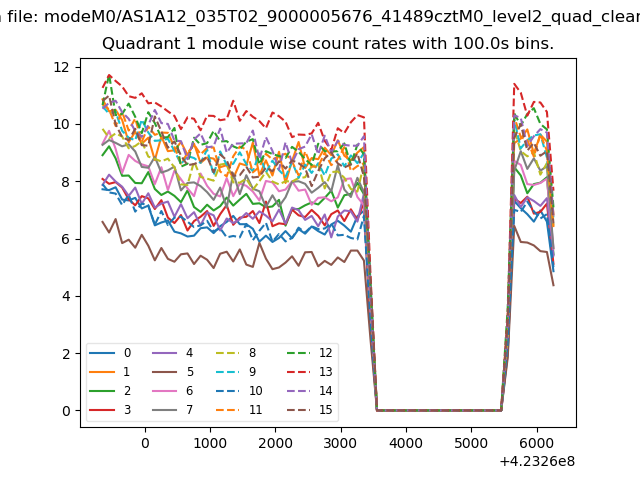
| Module-wise count rates for Quadrant A Data is divided into 100 sec bins |
 |
 |
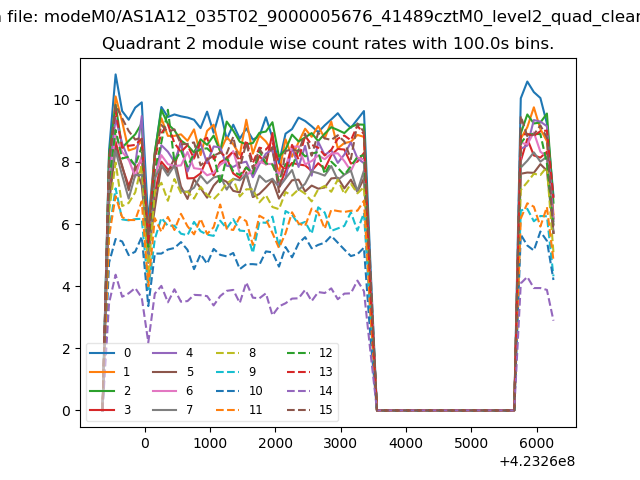
| Module-wise count rates for Quadrant B Data is divided into 100 sec bins |
 |
 |
| Module-wise count rates for Quadrant C Data is divided into 100 sec bins |
 |
 |
| Module-wise count rates for Quadrant D Data is divided into 100 sec bins |
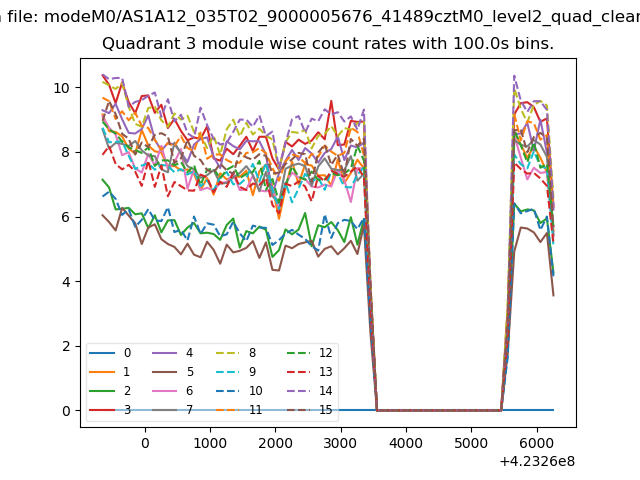 |
 |
| Parameter | Plot |
|---|---|
| CZT HV Monitor | 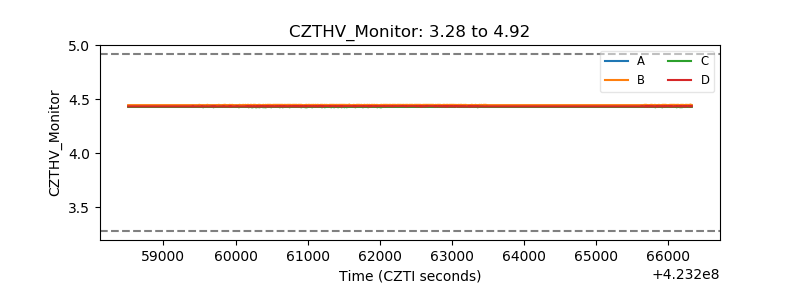 |
| D_VDD | 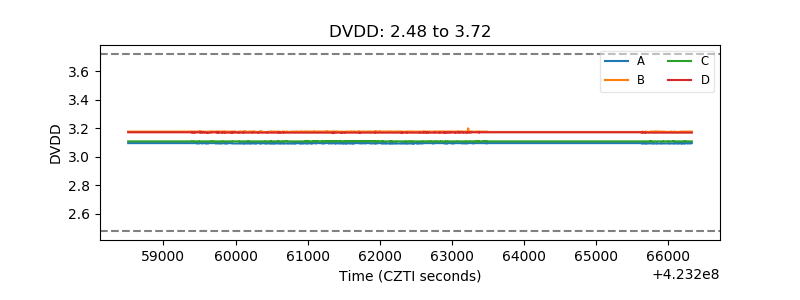 |
| Temperature 1 | 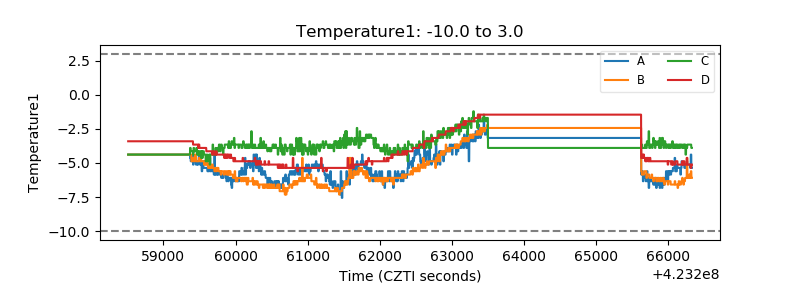 |
| Veto HV Monitor |  |
| Veto LLD | 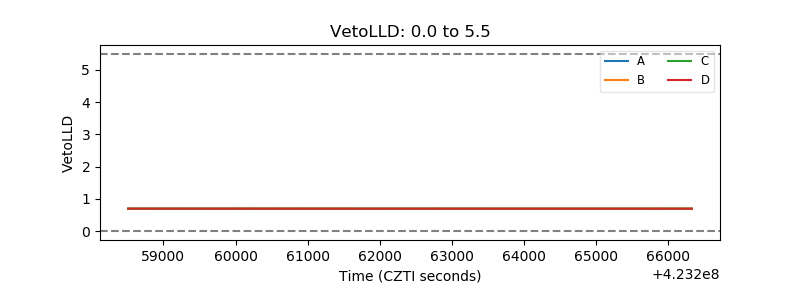 |
| Alpha Counter | 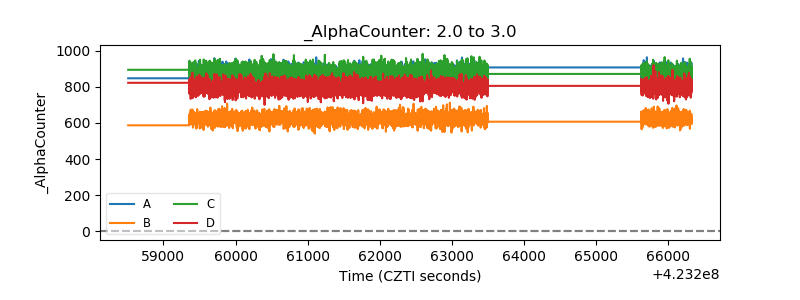 |
| _CPM_Rate |  |
| CZT Counter | 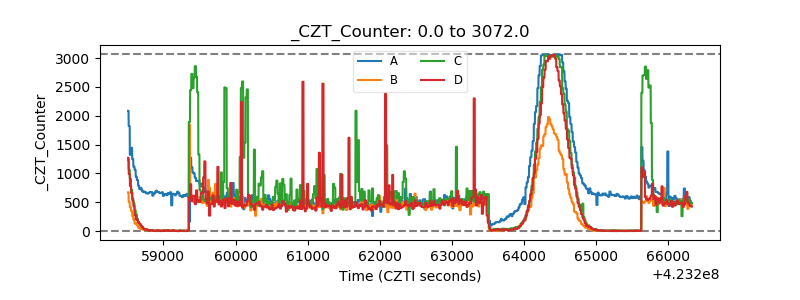 |
| +2.5 Volts monitor | 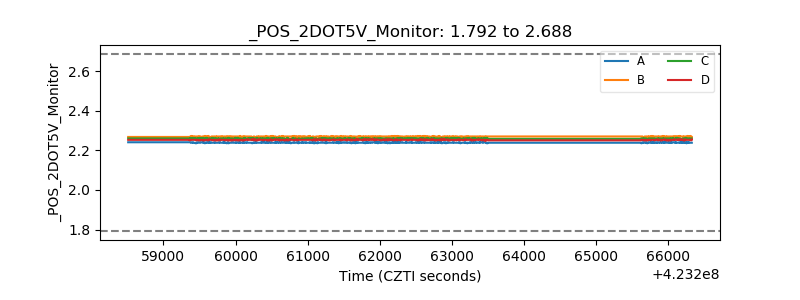 |
| +5 Volts monitor | 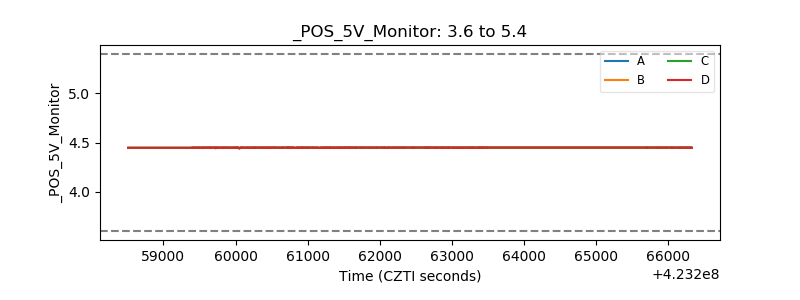 |
| _ROLL_ROT | 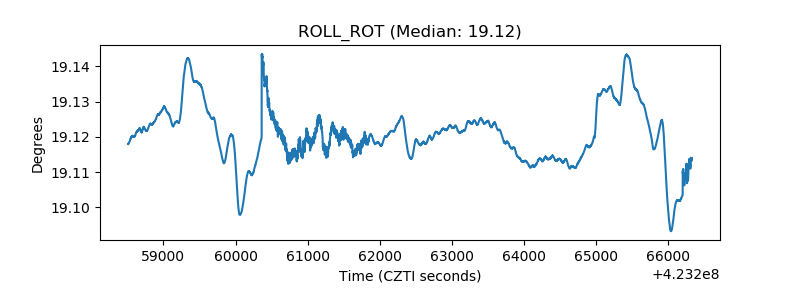 |
| _Roll_DEC | 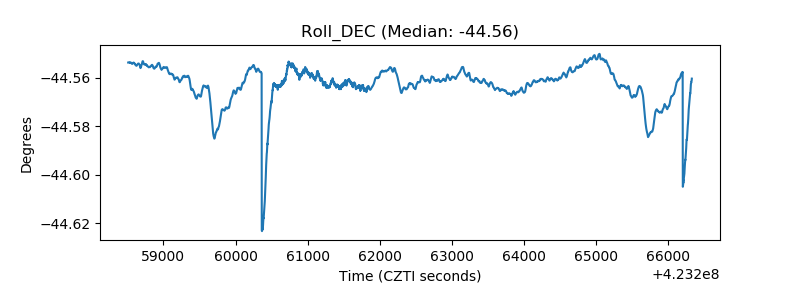 |
| _Roll_RA | 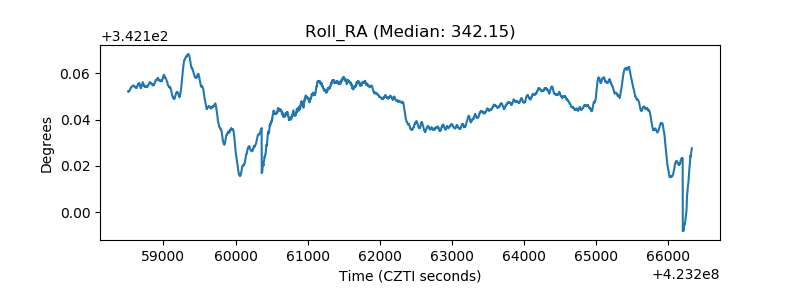 |
| Veto Counter | 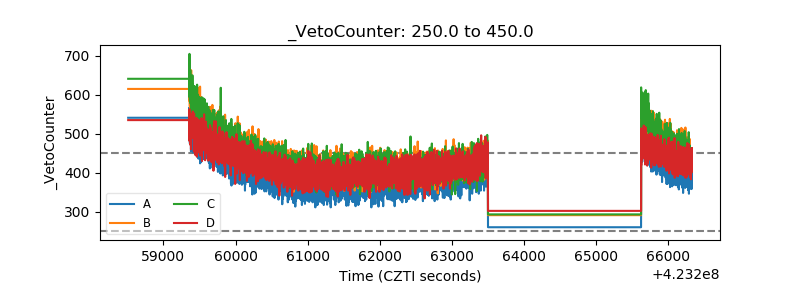 |