| Param | Original file | Final file |
|---|---|---|
| Filename | modeM0/AS1A12_035T02_9000005676_41490cztM0_level2.fits | modeM0/AS1A12_035T02_9000005676_41490cztM0_level2_quad_clean.evt |
| Size (bytes) | 1,435,991,040 | 375,304,320 |
| Size | 1.3 GB | 357.9 MB |
| Events in quadrant A | 11,544,365 | 2,602,866 |
| Events in quadrant B | 10,623,248 | 2,646,456 |
| Events in quadrant C | 14,651,274 | 2,397,063 |
| Events in quadrant D | 14,671,202 | 2,235,523 |
| Mode SS | |||
|---|---|---|---|
| Quadrant | BADHDUFLAG | Total packets | Discarded packets |
| A | 0 | 440 | 0 |
| B | 0 | 440 | 0 |
| C | 0 | 440 | 0 |
| D | 0 | 440 | 0 |
| Mode M0 | |||
|---|---|---|---|
| Quadrant | BADHDUFLAG | Total packets | Discarded packets |
| A | 0 | 46974 | 6 |
| B | 0 | 46096 | 5 |
| C | 0 | 56681 | 5 |
| D | 0 | 58099 | 5 |
| Mode M9 | |||
|---|---|---|---|
| Quadrant | BADHDUFLAG | Total packets | Discarded packets |
| A | 0 | 100 | 0 |
| B | 0 | 100 | 0 |
| C | 0 | 100 | 0 |
| D | 0 | 100 | 0 |
| Quadrant | Total seconds | Saturated seconds | Saturation percentage |
|---|---|---|---|
| A | 21537 | 55 | 0.255374% |
| B | 21537 | 209 | 0.970423% |
| C | 21537 | 961 | 4.462088% |
| D | 21537 | 1169 | 5.427868% |
Noise dominated data is calculated using 1-second bins in cleaned event files. If a bin has >2000 counts, and if more than 50% of those come from <1% of pixels, then it is considered to be noise-dominated and hence unusable.
| Quadrant | # 1 sec bins | Bins with >0 counts | Bins with >2000 counts | High rate bins dominated by noise | Noise dominated (total time) | Noise dominated (detector-on time) | Marked lightcurve |
|---|---|---|---|---|---|---|---|
| A | 31492 | 21542 | 21 | 21 | 0.07% | 0.10% | 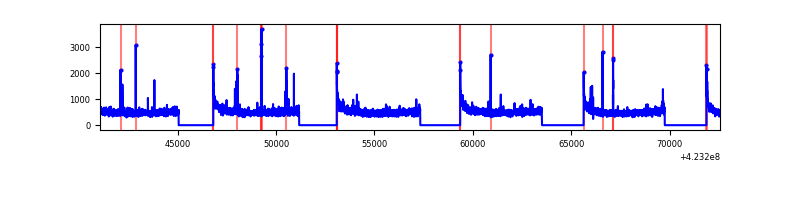 |
| B | 31492 | 21542 | 121 | 121 | 0.38% | 0.56% | 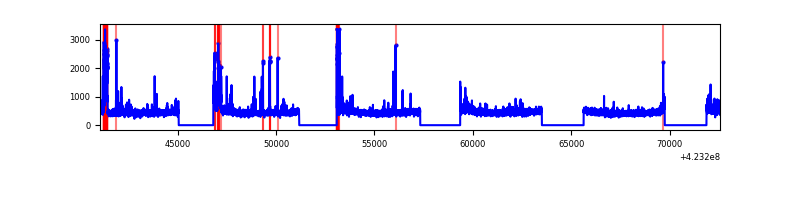 |
| C | 31492 | 21542 | 904 | 904 | 2.87% | 4.20% | 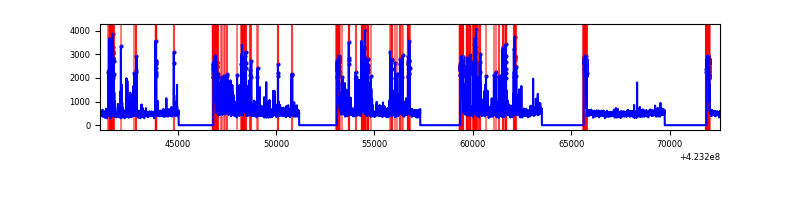 |
| D | 31492 | 21542 | 1102 | 1102 | 3.50% | 5.12% | 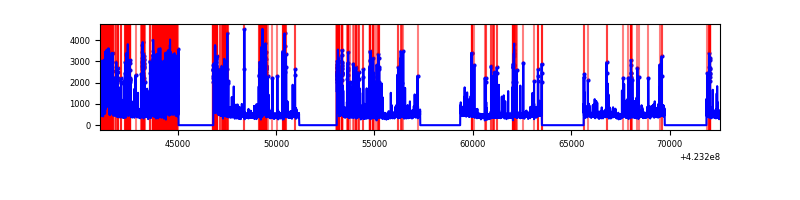 |
Top three noisy pixels from each quadrant. If the there are fewer than three noisy pixels in the level2.evt file, extra rows are filled as -1
| Pixel properties | Quadrant properties | ||||||
|---|---|---|---|---|---|---|---|
| Quadrant | DetID | PixID | Counts | Sigma | Mean | Median | Sigma |
| A | 10 | 83 | 1791220 | 3636.21 | 2450 | 2407 | 491.9 |
| A | 2 | 79 | 148304 | 296.57 | 2450 | 2407 | 491.9 |
| A | 13 | 248 | 72419 | 142.32 | 2450 | 2407 | 491.9 |
| B | 0 | 186 | 602755 | 1327.97 | 2434 | 2368 | 452.1 |
| B | 0 | 190 | 275619 | 604.39 | 2434 | 2368 | 452.1 |
| B | 0 | 245 | 81604 | 175.26 | 2434 | 2368 | 452.1 |
| C | 0 | 10 | 1765292 | 3318.53 | 2331 | 2347 | 531.2 |
| C | 9 | 54 | 1648833 | 3099.31 | 2331 | 2347 | 531.2 |
| C | 15 | 214 | 871187 | 1635.48 | 2331 | 2347 | 531.2 |
| D | 12 | 16 | 3126397 | 5532.83 | 2345 | 2288 | 564.6 |
| D | 12 | 6 | 556230 | 981.04 | 2345 | 2288 | 564.6 |
| D | 1 | 47 | 467082 | 823.15 | 2345 | 2288 | 564.6 |
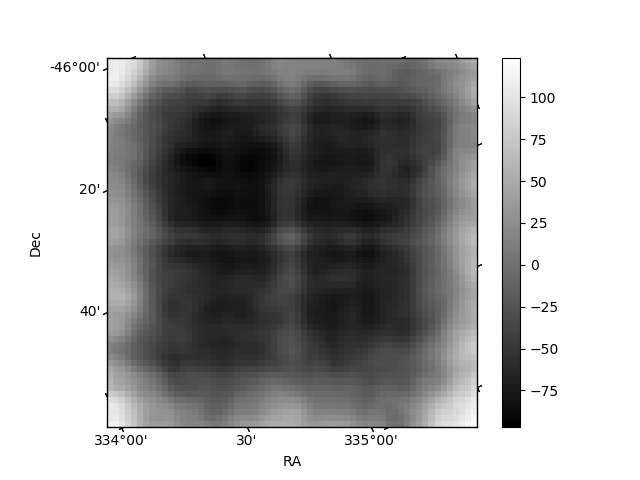
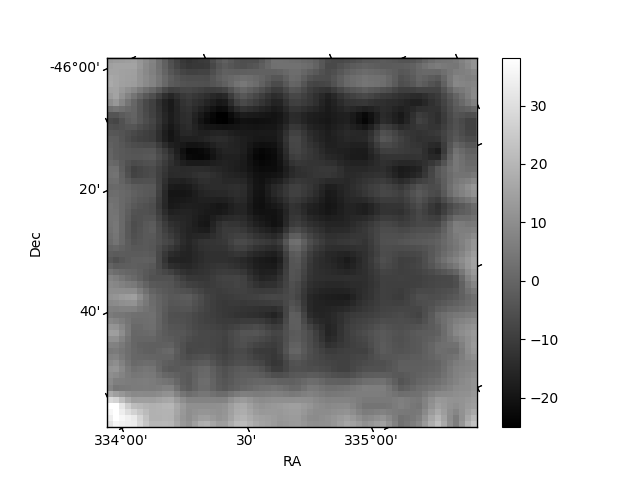
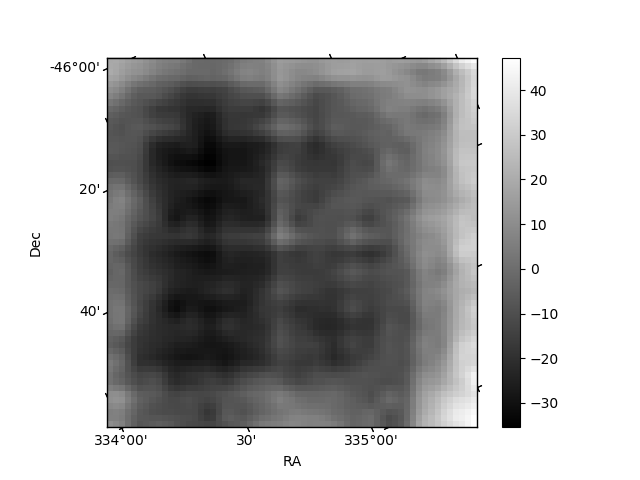
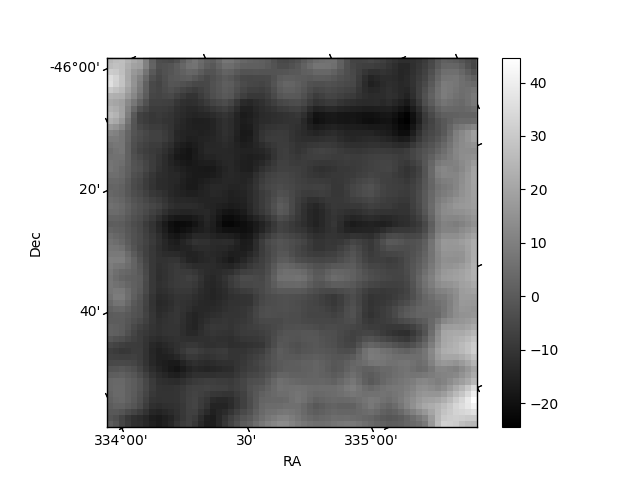
Histogram calculated using DETX and DETY for each event in the final _common_clean file
| Quadrant A | 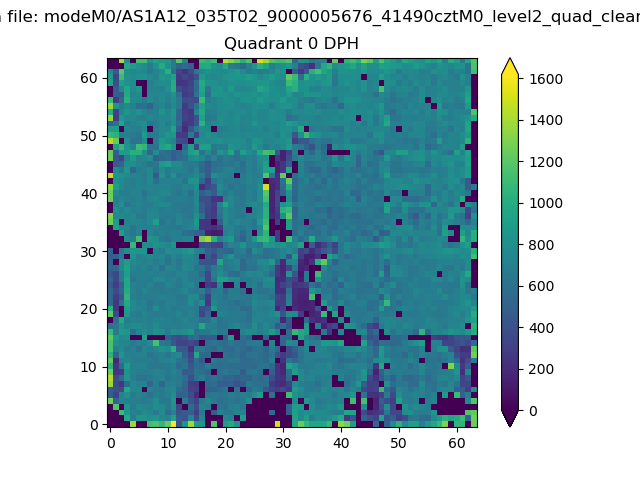 |
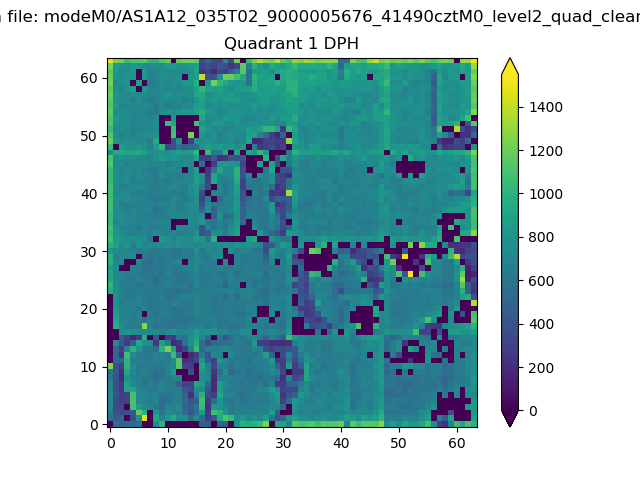 |
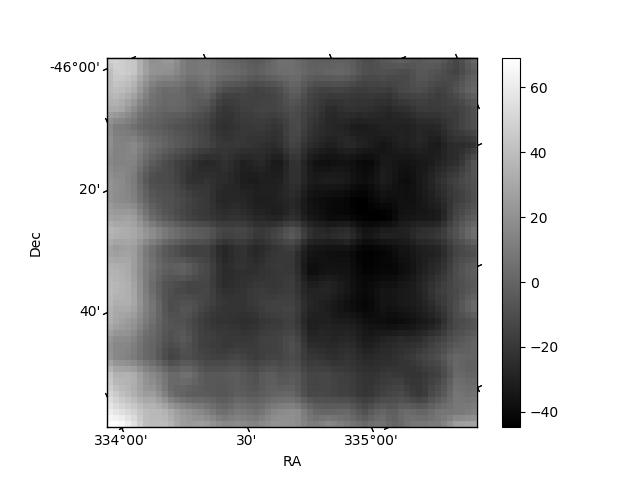
Quadrant B |
|---|---|---|---|
| Quadrant D | 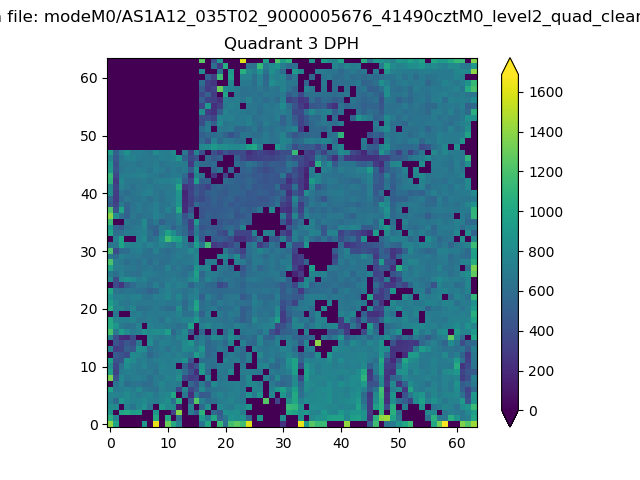 |
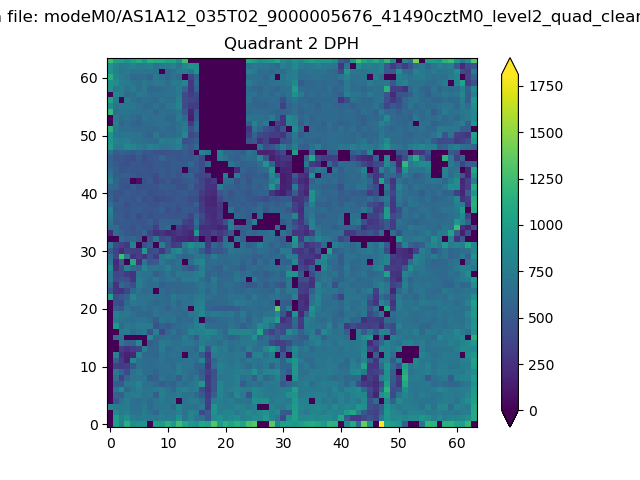 |
Quadrant C |
| Plot type | Count rate plots | Images |
|---|---|---|
| Comparison with Poisson distribution Blue bars denote a histogram of data divided into 1 sec bins. Red curve is a Poisson curve with rate = median count rate of data. |
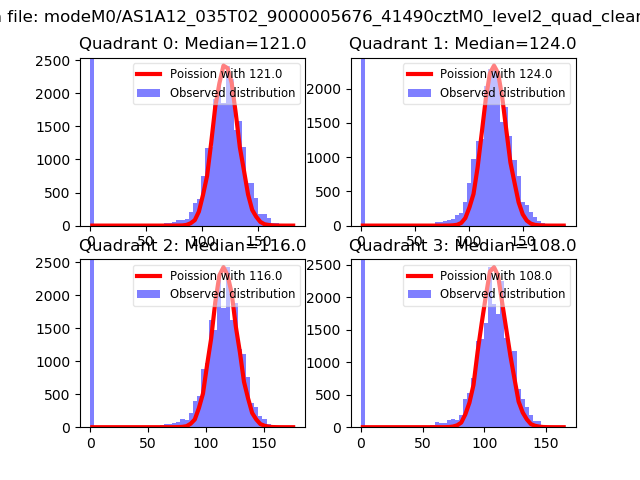 |
 |
| Quadrant-wise count rates Data is divided into 100 sec bins |
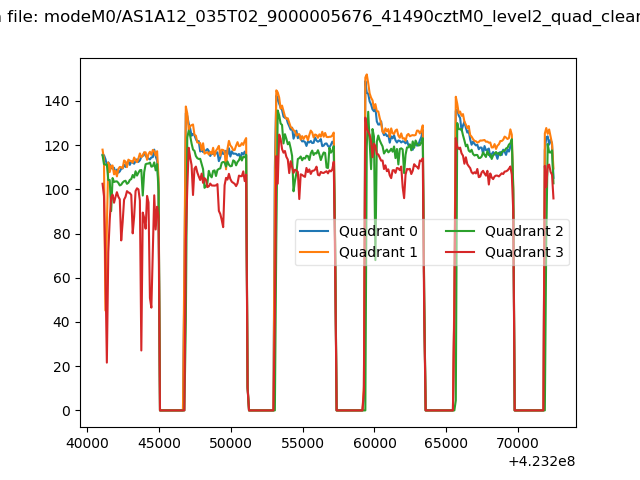 |
|
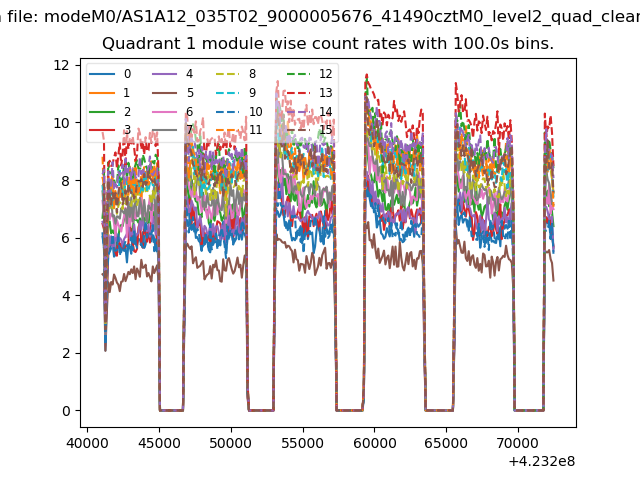
| Module-wise count rates for Quadrant A Data is divided into 100 sec bins |
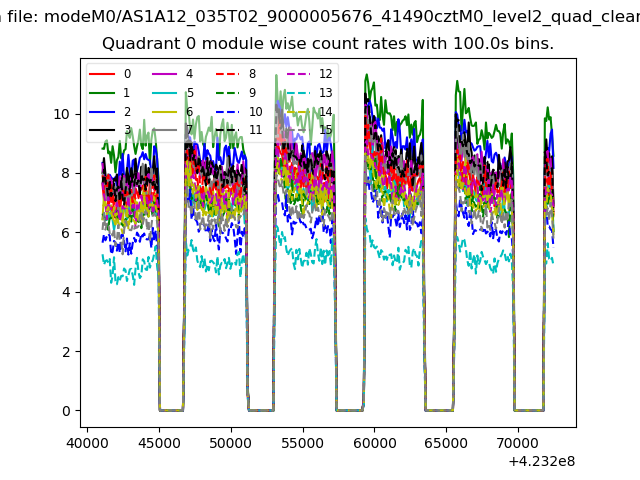 |
 |
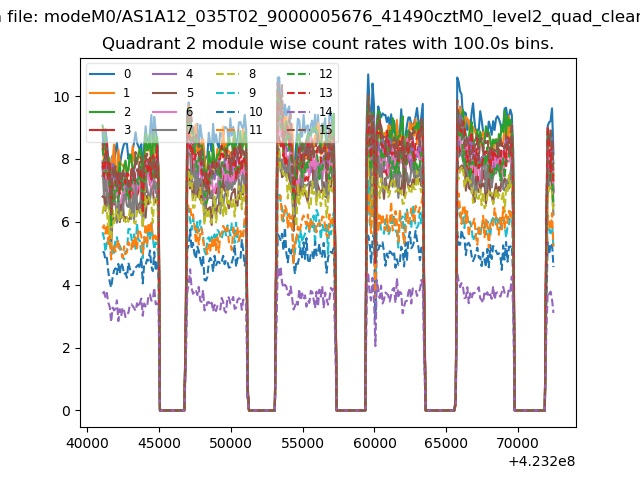
| Module-wise count rates for Quadrant B Data is divided into 100 sec bins |
 |
 |
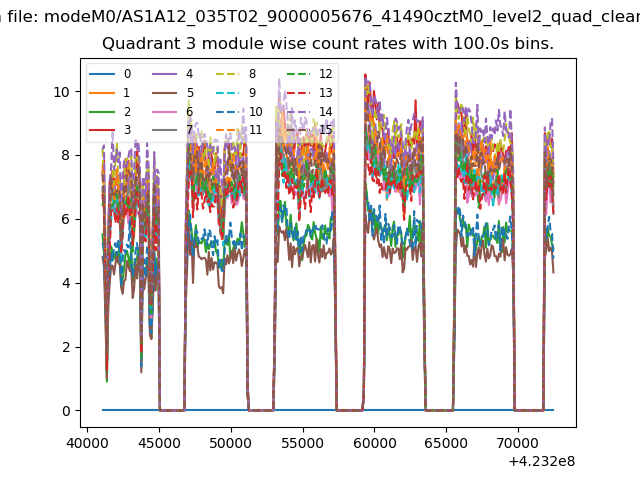
| Module-wise count rates for Quadrant C Data is divided into 100 sec bins |
 |
 |
| Module-wise count rates for Quadrant D Data is divided into 100 sec bins |
 |
 |
| Parameter | Plot |
|---|---|
| CZT HV Monitor | 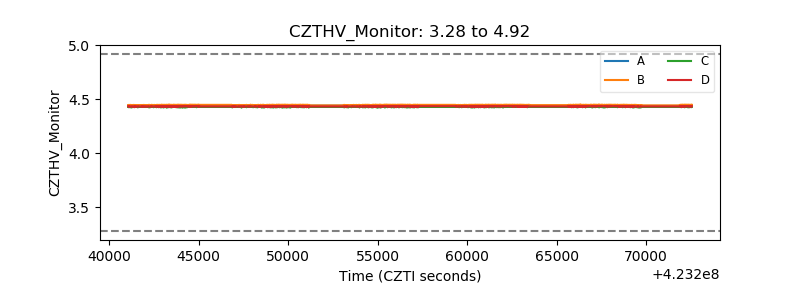 |
| D_VDD | 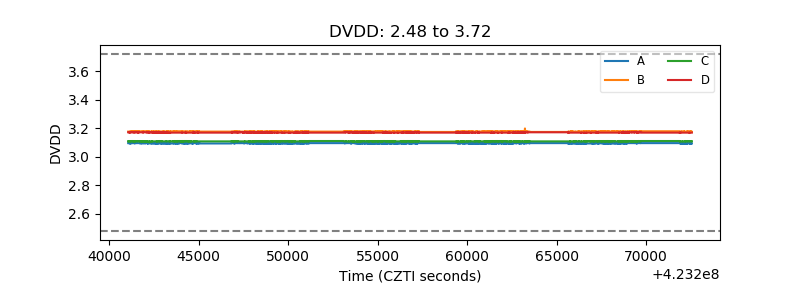 |
| Temperature 1 | 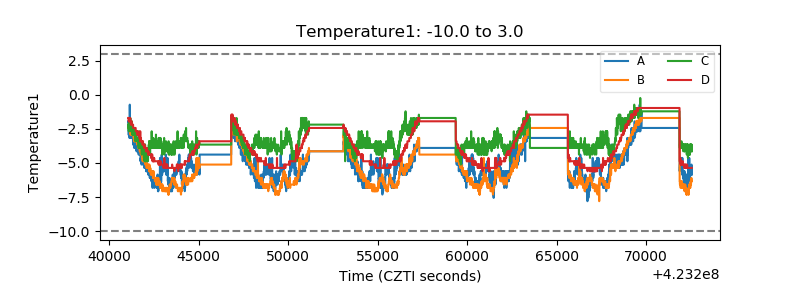 |
| Veto HV Monitor | 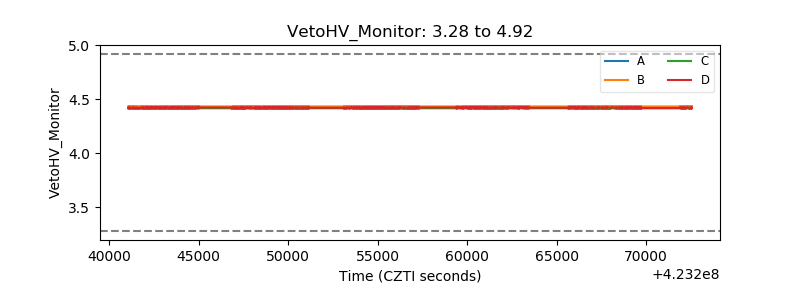 |
| Veto LLD | 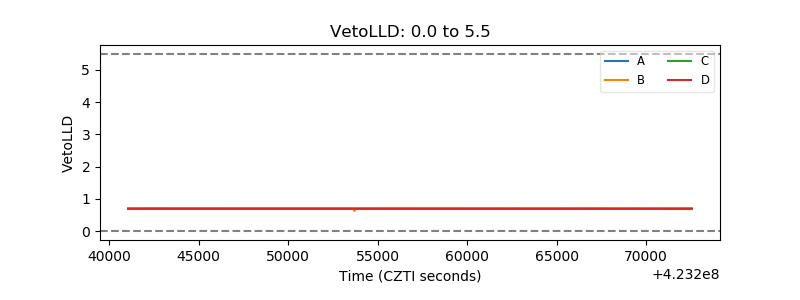 |
| Alpha Counter | 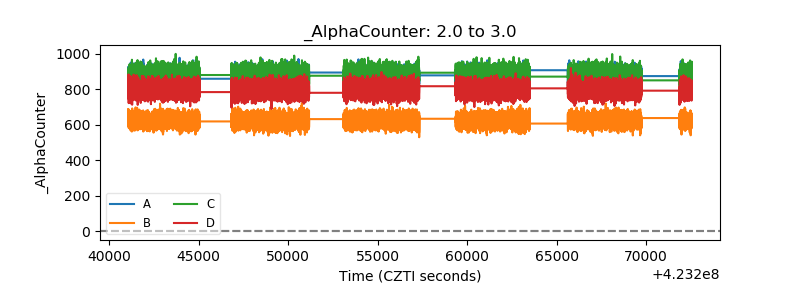 |
| _CPM_Rate | 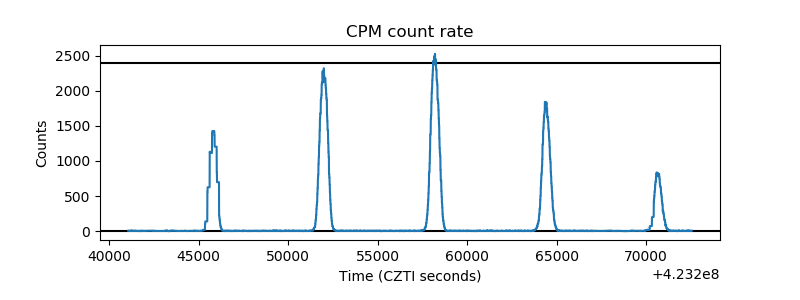 |
| CZT Counter | 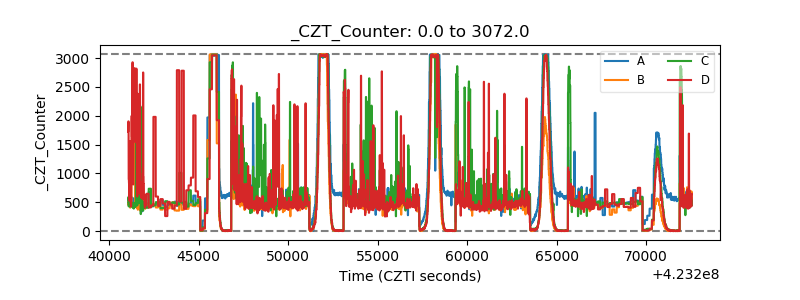 |
| +2.5 Volts monitor | 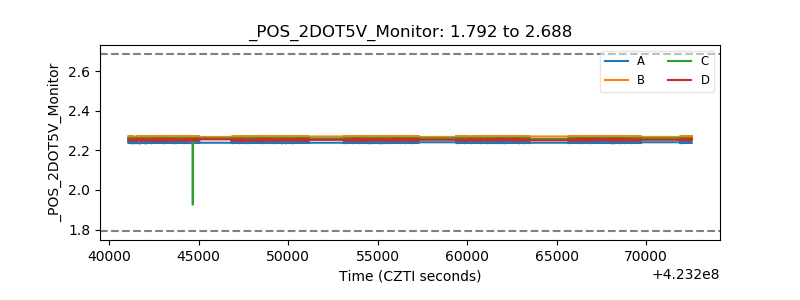 |
| +5 Volts monitor | 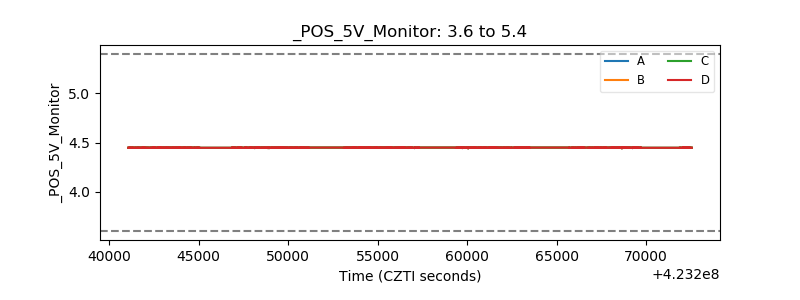 |
| _ROLL_ROT | 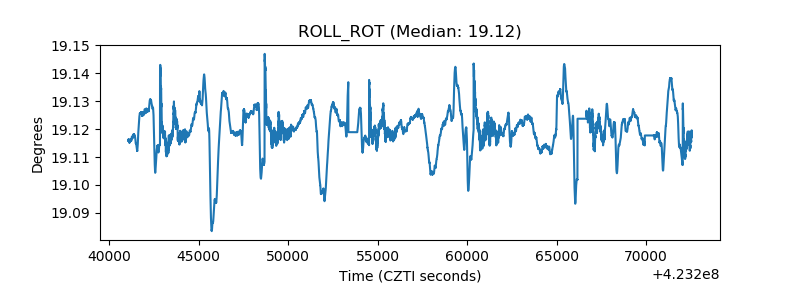 |
| _Roll_DEC | 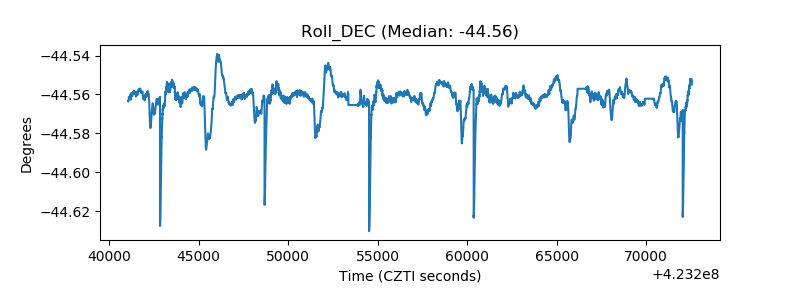 |
| _Roll_RA | 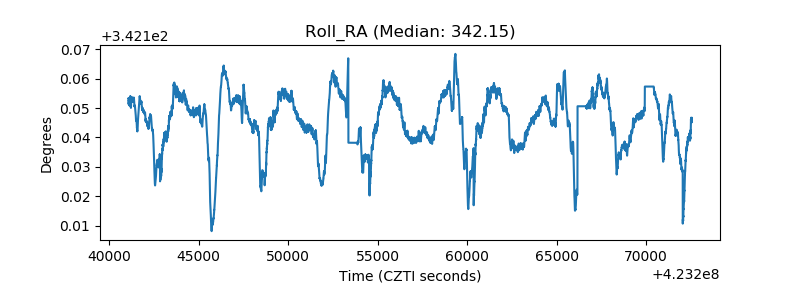 |
| Veto Counter | 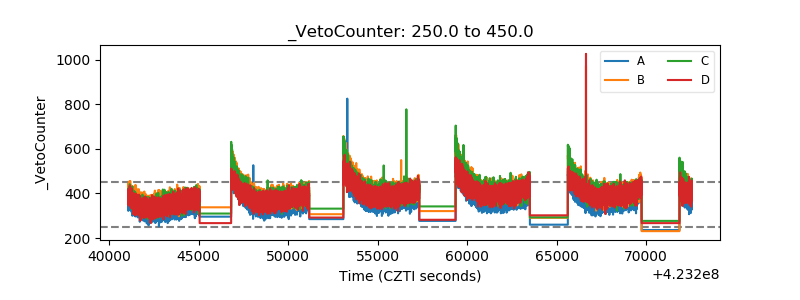 |