| Param | Original file | Final file |
|---|---|---|
| Filename | modeM0/AS1A12_035T02_9000005676_41491cztM0_level2.fits | modeM0/AS1A12_035T02_9000005676_41491cztM0_level2_quad_clean.evt |
| Size (bytes) | 317,206,080 | 84,962,880 |
| Size | 302.5 MB | 81.0 MB |
| Events in quadrant A | 2,685,197 | 578,525 |
| Events in quadrant B | 2,328,035 | 595,274 |
| Events in quadrant C | 3,230,816 | 533,016 |
| Events in quadrant D | 3,105,580 | 513,515 |
| Mode SS | |||
|---|---|---|---|
| Quadrant | BADHDUFLAG | Total packets | Discarded packets |
| A | 0 | 102 | 0 |
| B | 0 | 102 | 0 |
| C | 0 | 102 | 0 |
| D | 0 | 102 | 0 |
| Mode M0 | |||
|---|---|---|---|
| Quadrant | BADHDUFLAG | Total packets | Discarded packets |
| A | 0 | 11020 | 3 |
| B | 0 | 10461 | 2 |
| C | 0 | 12662 | 2 |
| D | 0 | 12743 | 2 |
| Mode M9 | |||
|---|---|---|---|
| Quadrant | BADHDUFLAG | Total packets | Discarded packets |
| A | 0 | 34 | 0 |
| B | 0 | 34 | 0 |
| C | 0 | 34 | 0 |
| D | 0 | 35 | 0 |
| Quadrant | Total seconds | Saturated seconds | Saturation percentage |
|---|---|---|---|
| A | 5030 | 11 | 0.218688% |
| B | 5030 | 21 | 0.417495% |
| C | 5030 | 325 | 6.461233% |
| D | 5030 | 178 | 3.538767% |
Noise dominated data is calculated using 1-second bins in cleaned event files. If a bin has >2000 counts, and if more than 50% of those come from <1% of pixels, then it is considered to be noise-dominated and hence unusable.
| Quadrant | # 1 sec bins | Bins with >0 counts | Bins with >2000 counts | High rate bins dominated by noise | Noise dominated (total time) | Noise dominated (detector-on time) | Marked lightcurve |
|---|---|---|---|---|---|---|---|
| A | 7093 | 5031 | 3 | 3 | 0.04% | 0.06% | 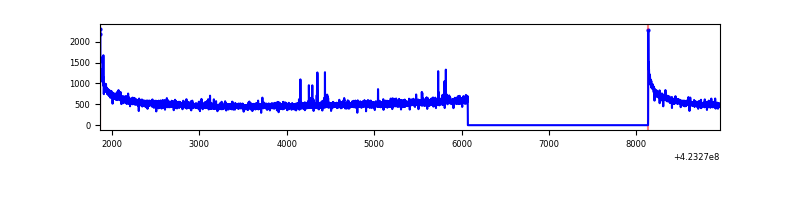 |
| B | 7093 | 5031 | 11 | 11 | 0.16% | 0.22% | 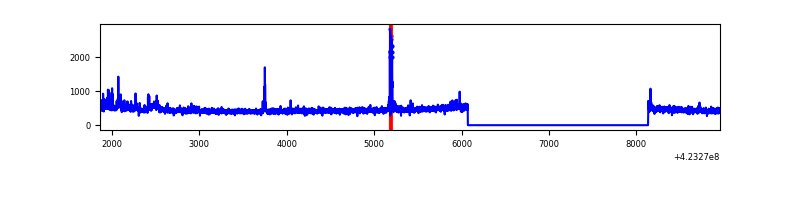 |
| C | 7093 | 5031 | 314 | 314 | 4.43% | 6.24% | 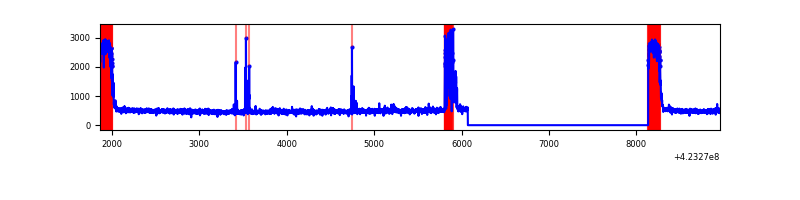 |
| D | 7093 | 5031 | 157 | 157 | 2.21% | 3.12% | 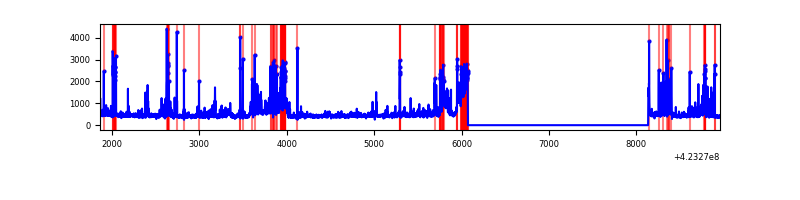 |
Top three noisy pixels from each quadrant. If the there are fewer than three noisy pixels in the level2.evt file, extra rows are filled as -1
| Pixel properties | Quadrant properties | ||||||
|---|---|---|---|---|---|---|---|
| Quadrant | DetID | PixID | Counts | Sigma | Mean | Median | Sigma |
| A | 10 | 83 | 500988 | 4414.06 | 557 | 545 | 113.4 |
| A | 2 | 79 | 15413 | 131.14 | 557 | 545 | 113.4 |
| A | 13 | 248 | 12084 | 101.78 | 557 | 545 | 113.4 |
| B | 0 | 190 | 90505 | 840.19 | 554 | 538 | 107.1 |
| B | 15 | 54 | 40029 | 368.8 | 554 | 538 | 107.1 |
| B | 12 | 111 | 13349 | 119.64 | 554 | 538 | 107.1 |
| C | 0 | 10 | 730281 | 5921.11 | 526 | 530 | 123.2 |
| C | 14 | 254 | 210448 | 1703.25 | 526 | 530 | 123.2 |
| C | 15 | 214 | 202450 | 1638.35 | 526 | 530 | 123.2 |
| D | 10 | 199 | 315727 | 2398.32 | 546 | 532 | 131.4 |
| D | 12 | 128 | 287149 | 2180.87 | 546 | 532 | 131.4 |
| D | 12 | 6 | 209678 | 1591.39 | 546 | 532 | 131.4 |
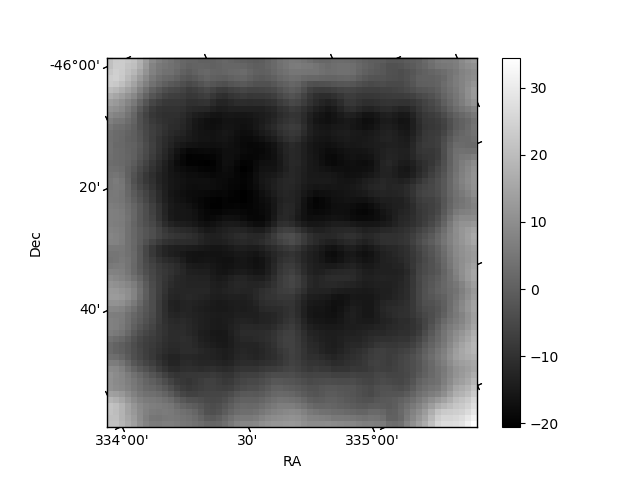
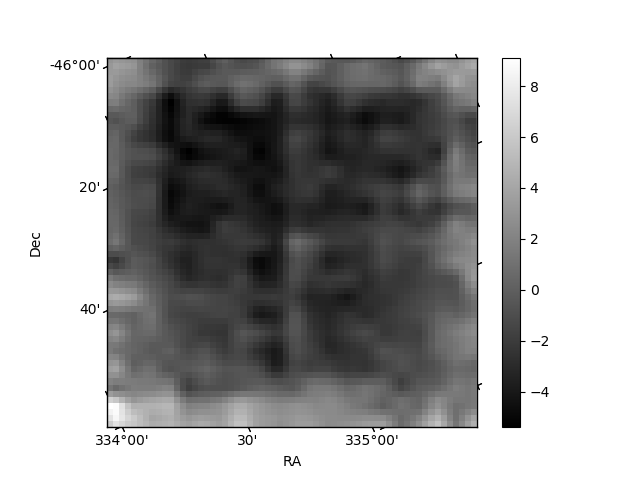
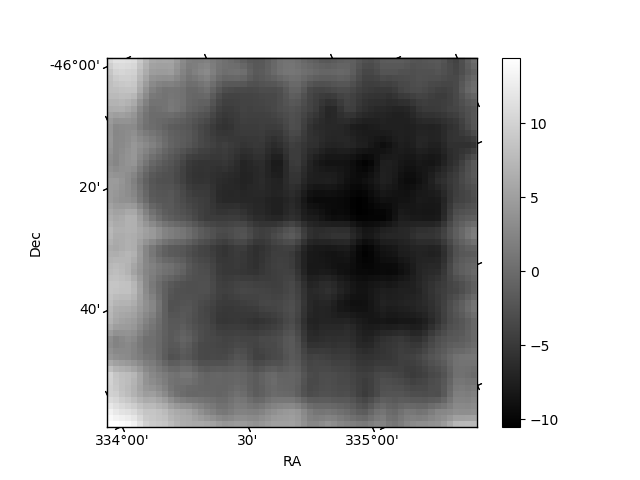
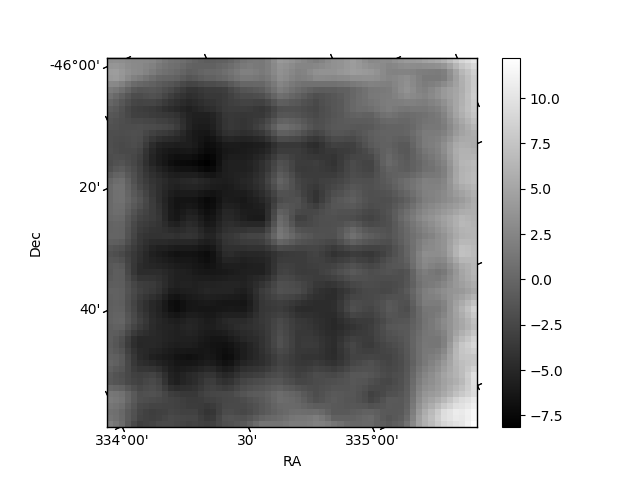
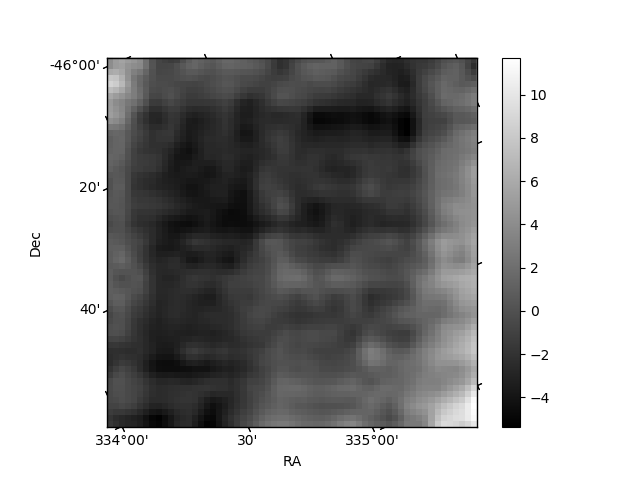
Histogram calculated using DETX and DETY for each event in the final _common_clean file
| Quadrant A | 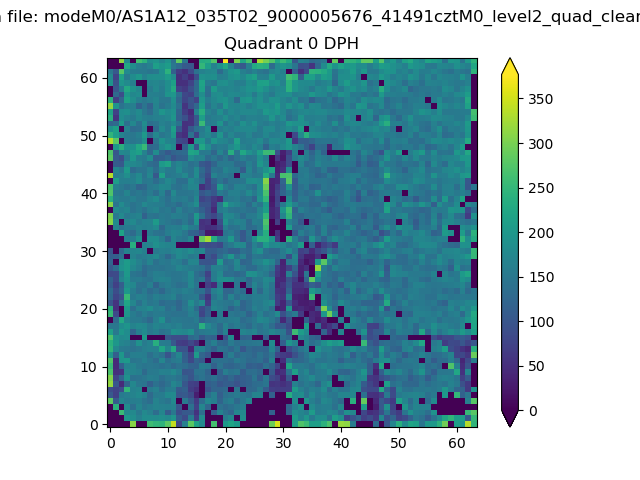 |
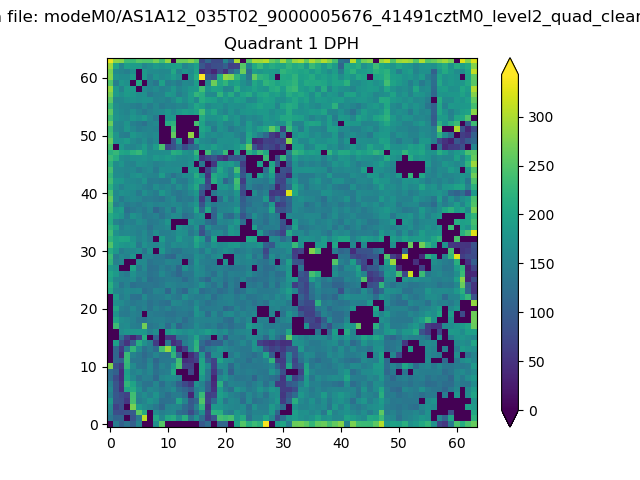 |
Quadrant B |
|---|---|---|---|
| Quadrant D | 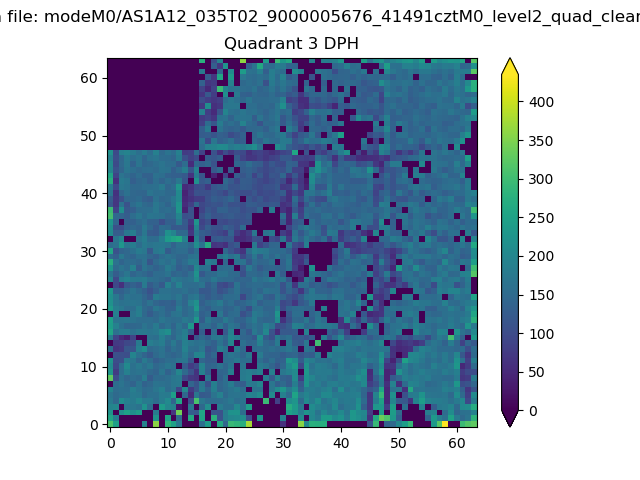 |
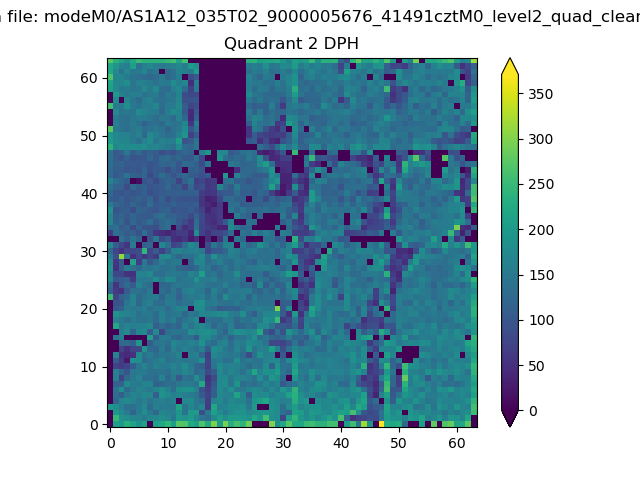 |
Quadrant C |
| Plot type | Count rate plots | Images |
|---|---|---|
| Comparison with Poisson distribution Blue bars denote a histogram of data divided into 1 sec bins. Red curve is a Poisson curve with rate = median count rate of data. |
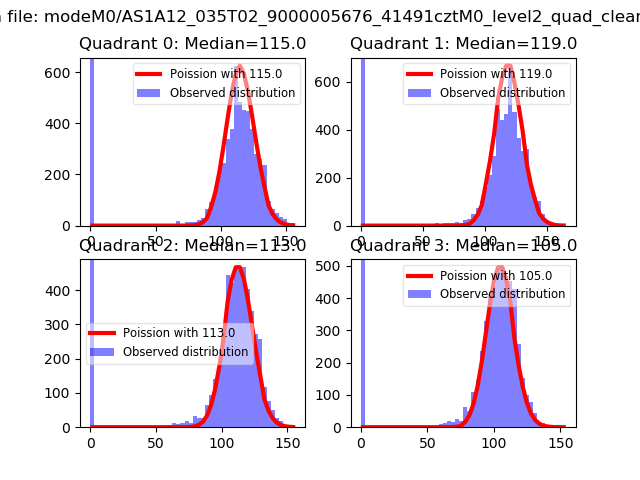 |
 |
| Quadrant-wise count rates Data is divided into 100 sec bins |
 |
|
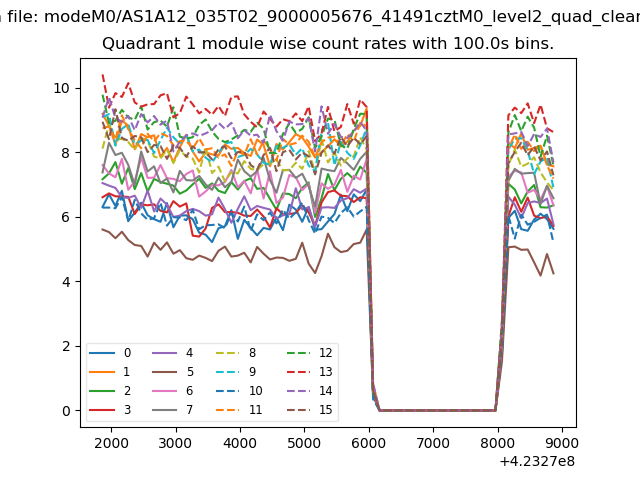
| Module-wise count rates for Quadrant A Data is divided into 100 sec bins |
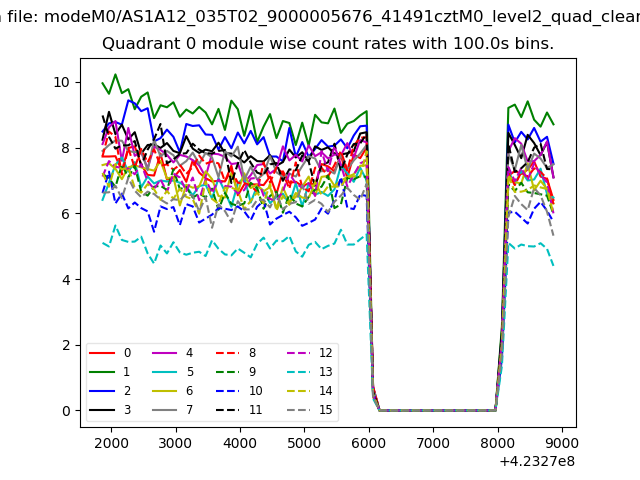 |
 |
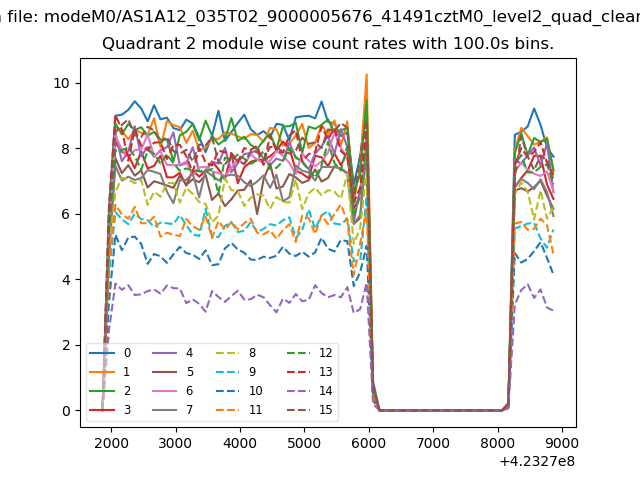
| Module-wise count rates for Quadrant B Data is divided into 100 sec bins |
 |
 |
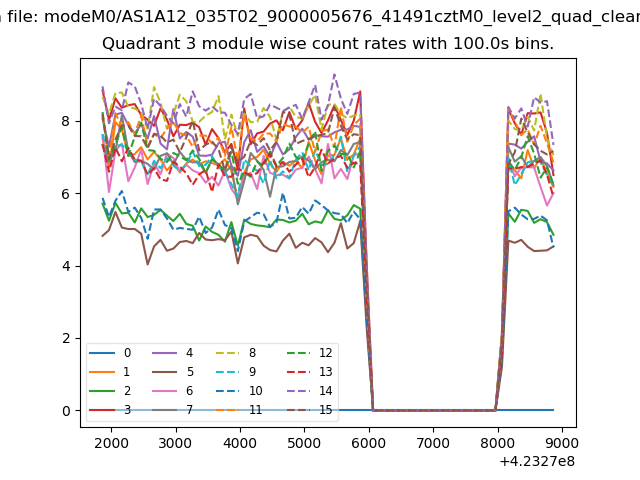
| Module-wise count rates for Quadrant C Data is divided into 100 sec bins |
 |
 |
| Module-wise count rates for Quadrant D Data is divided into 100 sec bins |
 |
 |
| Parameter | Plot |
|---|---|
| CZT HV Monitor | 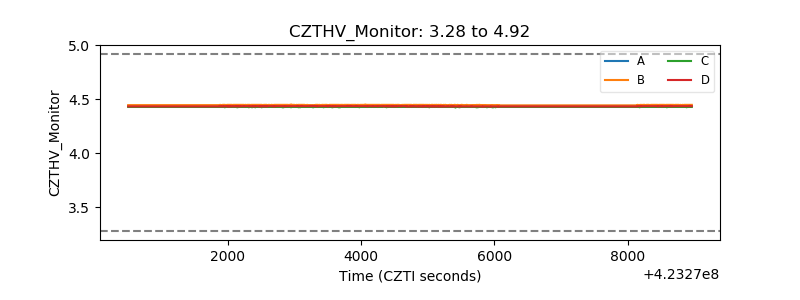 |
| D_VDD | 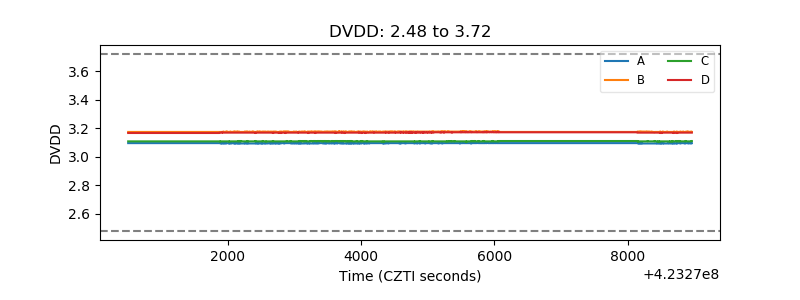 |
| Temperature 1 | 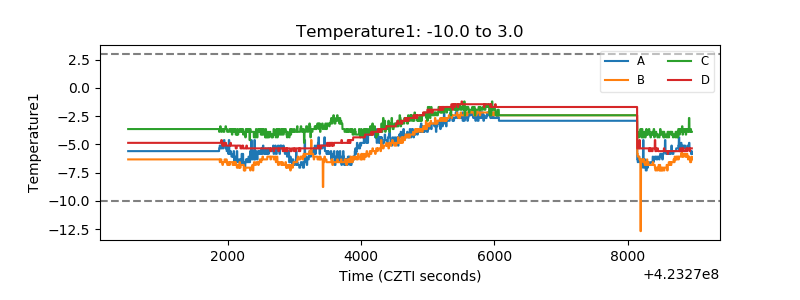 |
| Veto HV Monitor |  |
| Veto LLD | 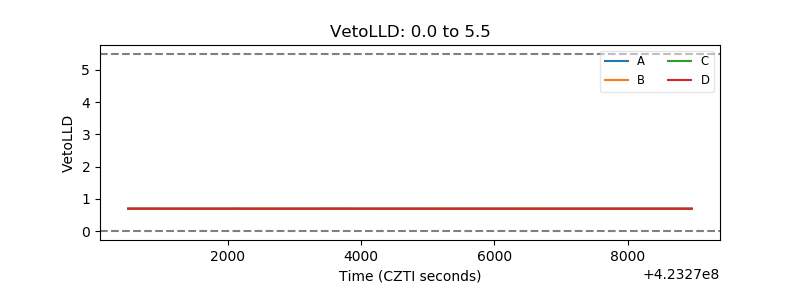 |
| Alpha Counter | 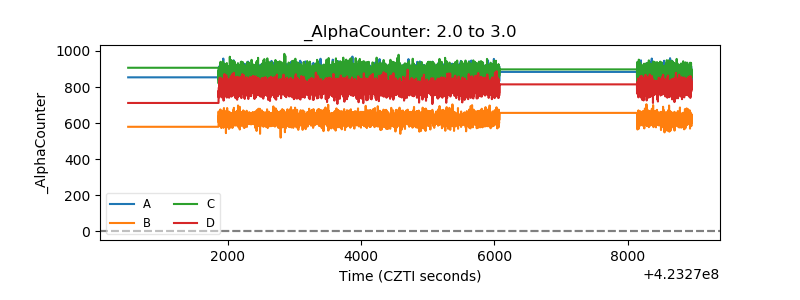 |
| _CPM_Rate | 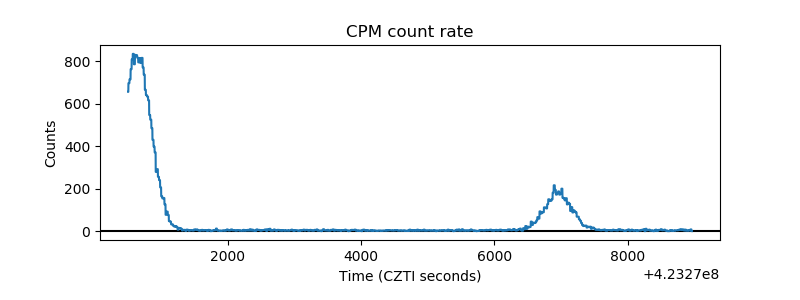 |
| CZT Counter | 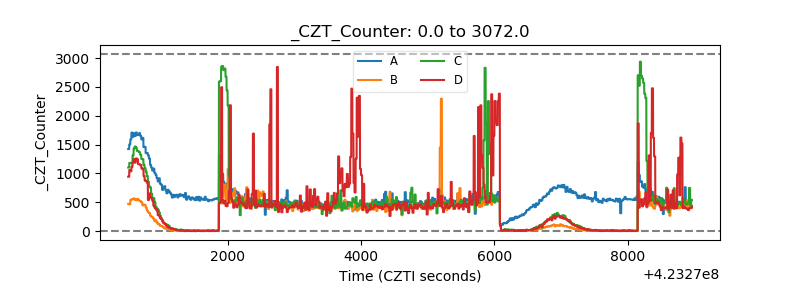 |
| +2.5 Volts monitor | 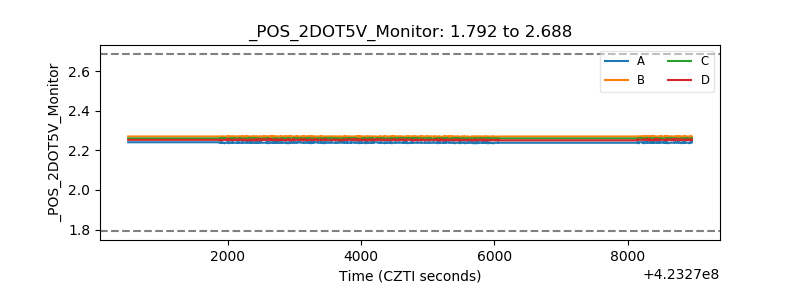 |
| +5 Volts monitor | 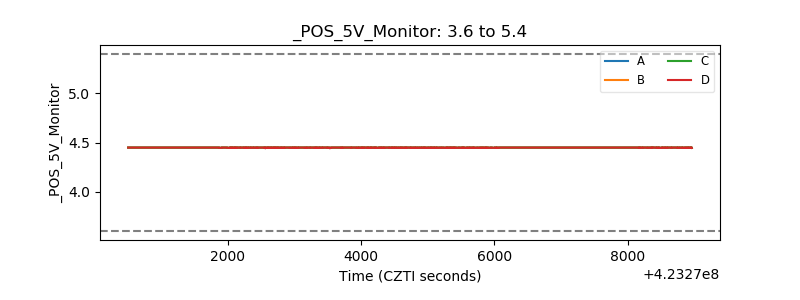 |
| _ROLL_ROT | 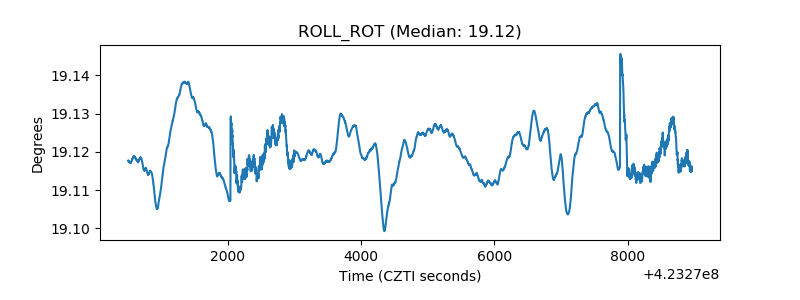 |
| _Roll_DEC | 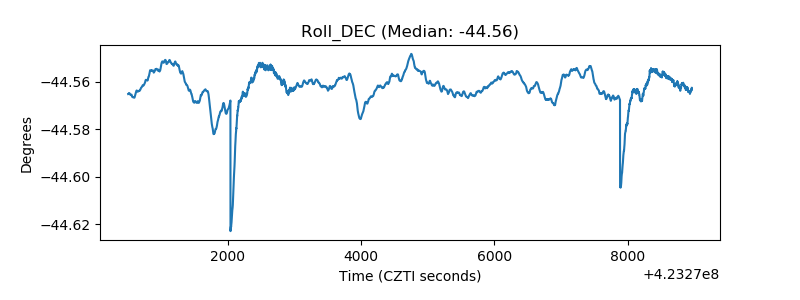 |
| _Roll_RA | 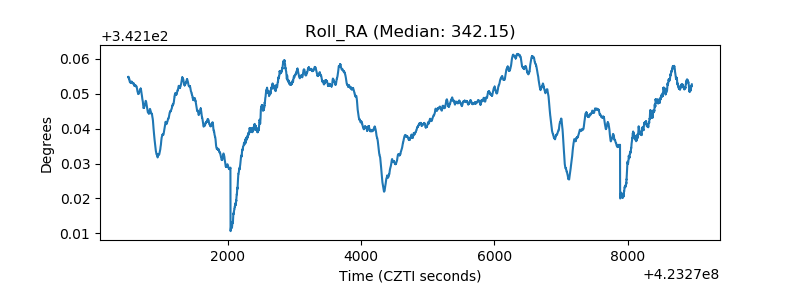 |
| Veto Counter | 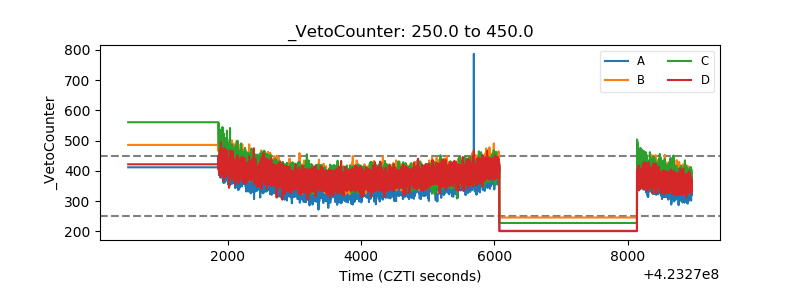 |