| Param | Original file | Final file |
|---|---|---|
| Filename | modeM0/AS1A12_035T02_9000005676_41492cztM0_level2.fits | modeM0/AS1A12_035T02_9000005676_41492cztM0_level2_quad_clean.evt |
| Size (bytes) | 299,016,000 | 85,809,600 |
| Size | 285.2 MB | 81.8 MB |
| Events in quadrant A | 2,715,850 | 577,016 |
| Events in quadrant B | 2,310,687 | 588,549 |
| Events in quadrant C | 3,050,817 | 545,458 |
| Events in quadrant D | 2,586,886 | 524,156 |
| Mode SS | |||
|---|---|---|---|
| Quadrant | BADHDUFLAG | Total packets | Discarded packets |
| A | 0 | 106 | 0 |
| B | 0 | 106 | 0 |
| C | 0 | 106 | 0 |
| D | 0 | 106 | 0 |
| Mode M0 | |||
|---|---|---|---|
| Quadrant | BADHDUFLAG | Total packets | Discarded packets |
| A | 0 | 11183 | 3 |
| B | 0 | 10533 | 2 |
| C | 0 | 12194 | 2 |
| D | 0 | 11373 | 2 |
| Mode M9 | |||
|---|---|---|---|
| Quadrant | BADHDUFLAG | Total packets | Discarded packets |
| A | 0 | 29 | 0 |
| B | 0 | 29 | 0 |
| C | 0 | 29 | 0 |
| D | 0 | 30 | 0 |
| Quadrant | Total seconds | Saturated seconds | Saturation percentage |
|---|---|---|---|
| A | 5182 | 9 | 0.173678% |
| B | 5182 | 6 | 0.115785% |
| C | 5182 | 207 | 3.994597% |
| D | 5182 | 36 | 0.694712% |
Noise dominated data is calculated using 1-second bins in cleaned event files. If a bin has >2000 counts, and if more than 50% of those come from <1% of pixels, then it is considered to be noise-dominated and hence unusable.
| Quadrant | # 1 sec bins | Bins with >0 counts | Bins with >2000 counts | High rate bins dominated by noise | Noise dominated (total time) | Noise dominated (detector-on time) | Marked lightcurve |
|---|---|---|---|---|---|---|---|
| A | 7036 | 5183 | 2 | 2 | 0.03% | 0.04% | 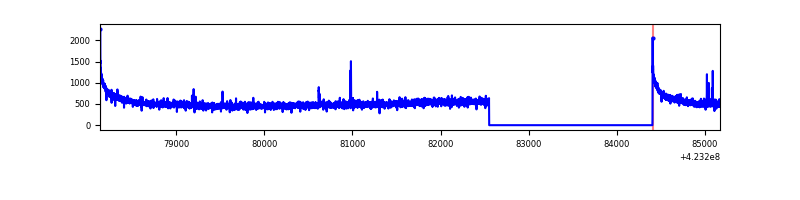 |
| B | 7036 | 5183 | 1 | 1 | 0.01% | 0.02% | 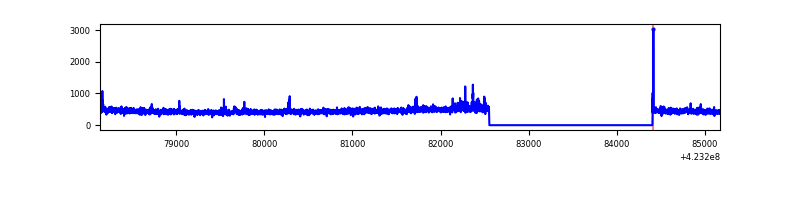 |
| C | 7036 | 5183 | 205 | 205 | 2.91% | 3.96% | 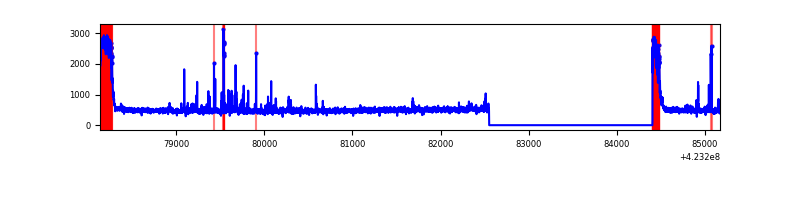 |
| D | 7036 | 5183 | 30 | 30 | 0.43% | 0.58% | 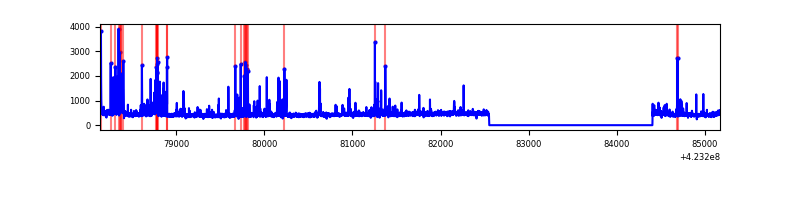 |
Top three noisy pixels from each quadrant. If the there are fewer than three noisy pixels in the level2.evt file, extra rows are filled as -1
| Pixel properties | Quadrant properties | ||||||
|---|---|---|---|---|---|---|---|
| Quadrant | DetID | PixID | Counts | Sigma | Mean | Median | Sigma |
| A | 10 | 83 | 504701 | 4373.17 | 565 | 554 | 115.3 |
| A | 2 | 79 | 18627 | 156.77 | 565 | 554 | 115.3 |
| A | 13 | 254 | 9926 | 81.3 | 565 | 554 | 115.3 |
| B | 0 | 190 | 65656 | 594.09 | 563 | 547 | 109.6 |
| B | 5 | 255 | 14519 | 127.49 | 563 | 547 | 109.6 |
| B | 12 | 111 | 13899 | 121.83 | 563 | 547 | 109.6 |
| C | 0 | 10 | 546300 | 4318.68 | 544 | 545 | 126.4 |
| C | 15 | 214 | 214803 | 1695.47 | 544 | 545 | 126.4 |
| C | 14 | 254 | 76203 | 598.7 | 544 | 545 | 126.4 |
| D | 12 | 6 | 158059 | 1148.34 | 558 | 543 | 137.2 |
| D | 2 | 249 | 79588 | 576.26 | 558 | 543 | 137.2 |
| D | 12 | 128 | 60550 | 437.47 | 558 | 543 | 137.2 |
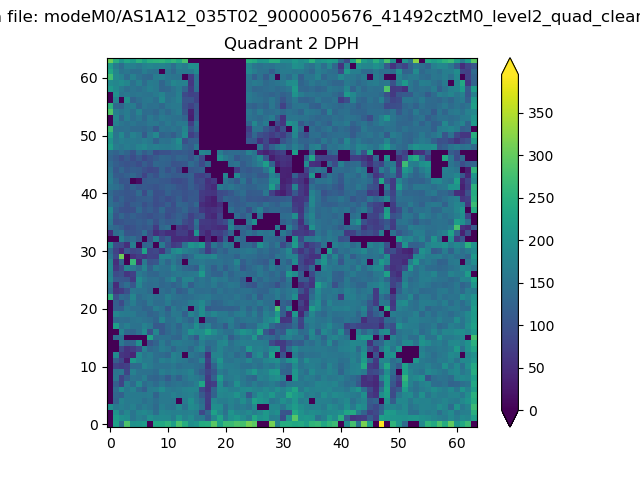
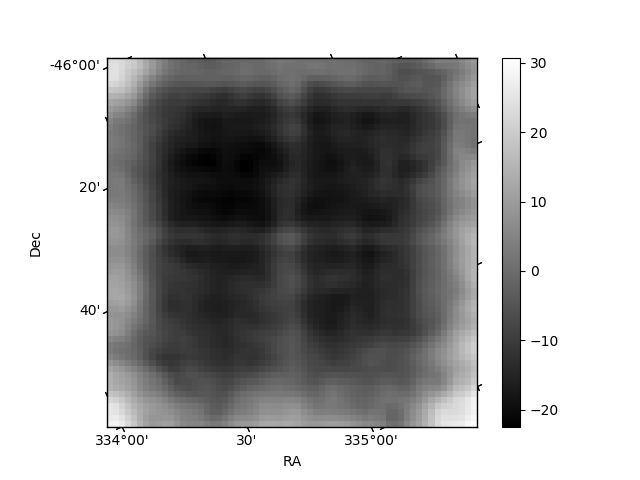
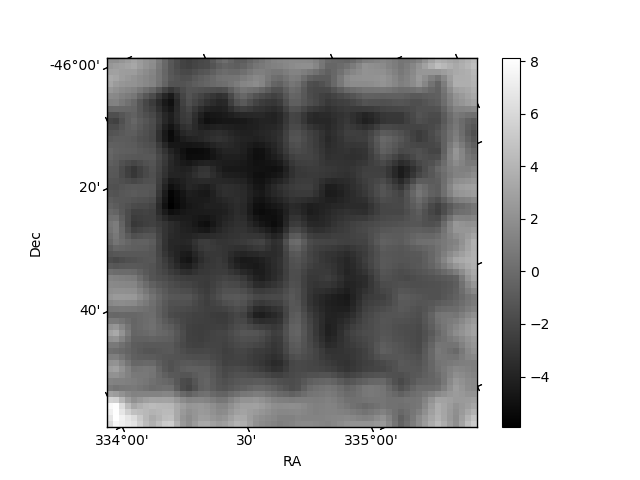
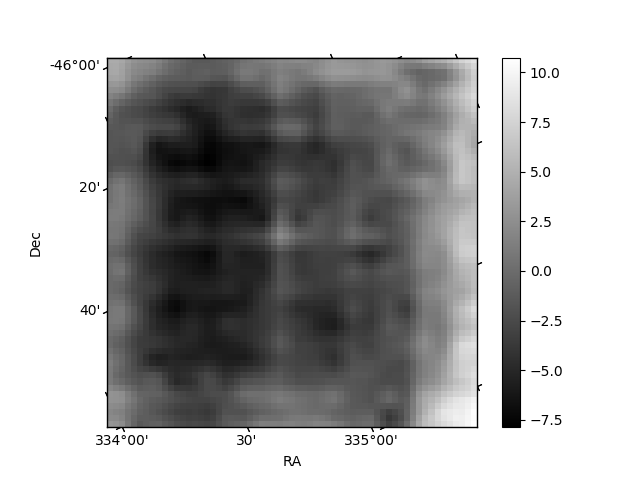
Histogram calculated using DETX and DETY for each event in the final _common_clean file
| Quadrant A | 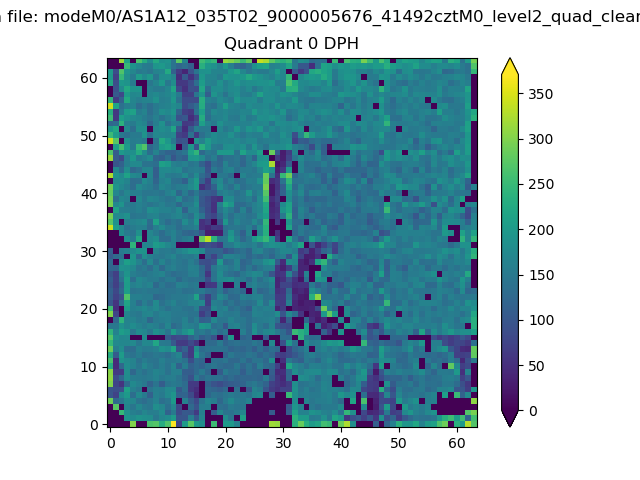 |
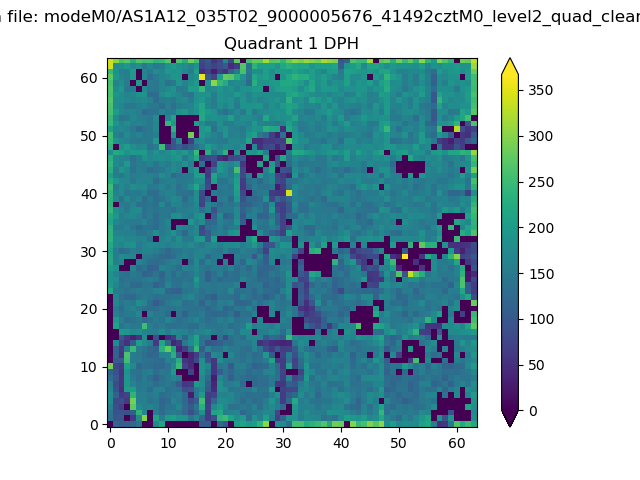 |
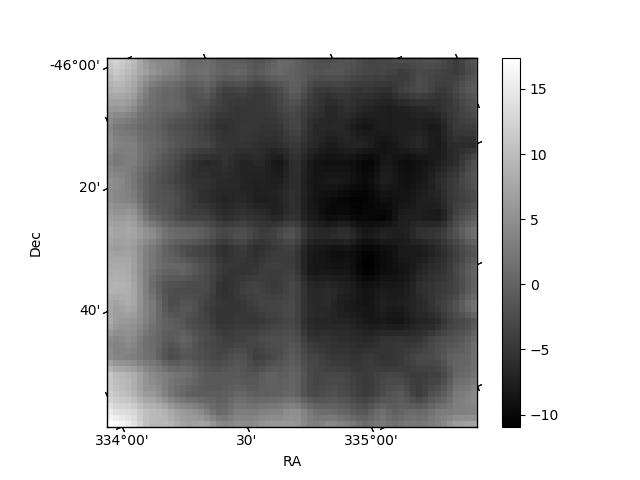
Quadrant B |
|---|---|---|---|
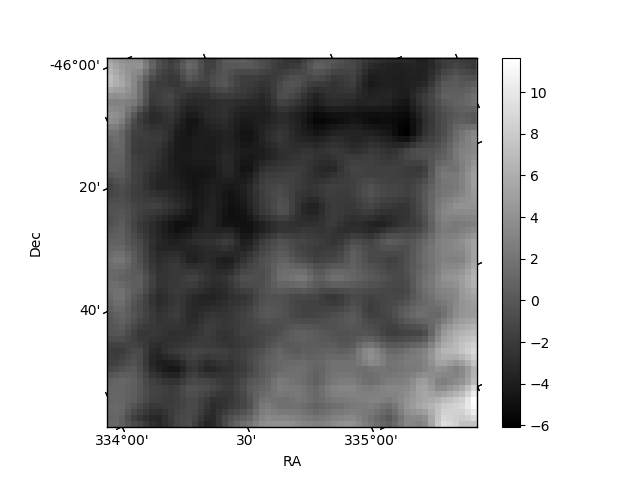
| Quadrant D | 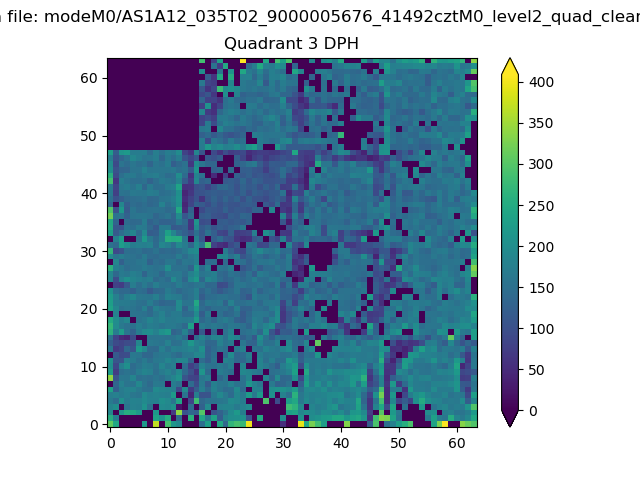 |
 |
Quadrant C |
| Plot type | Count rate plots | Images |
|---|---|---|
| Comparison with Poisson distribution Blue bars denote a histogram of data divided into 1 sec bins. Red curve is a Poisson curve with rate = median count rate of data. |
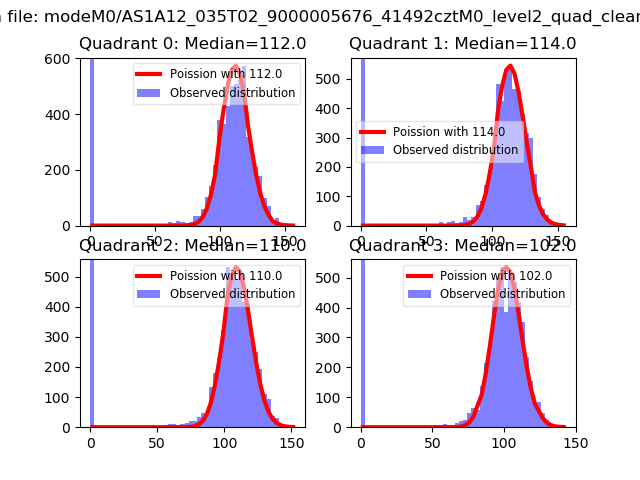 |
 |
| Quadrant-wise count rates Data is divided into 100 sec bins |
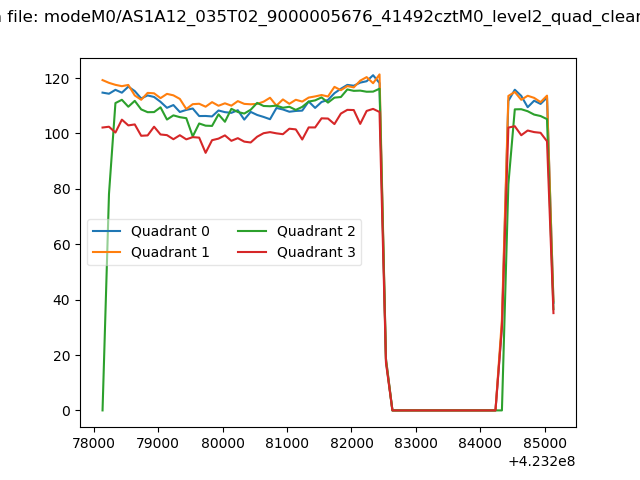 |
|
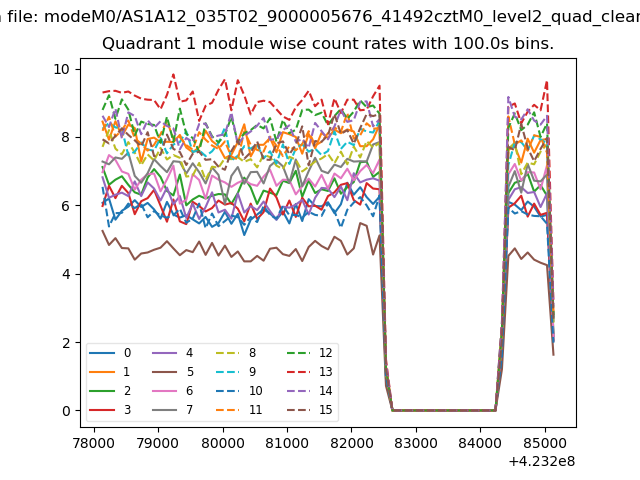
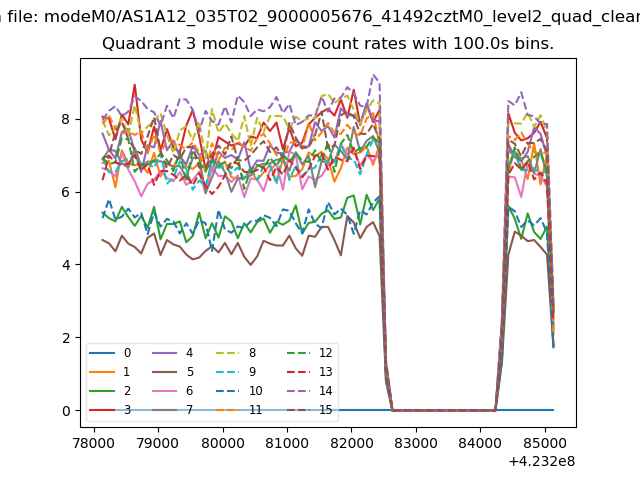
| Module-wise count rates for Quadrant A Data is divided into 100 sec bins |
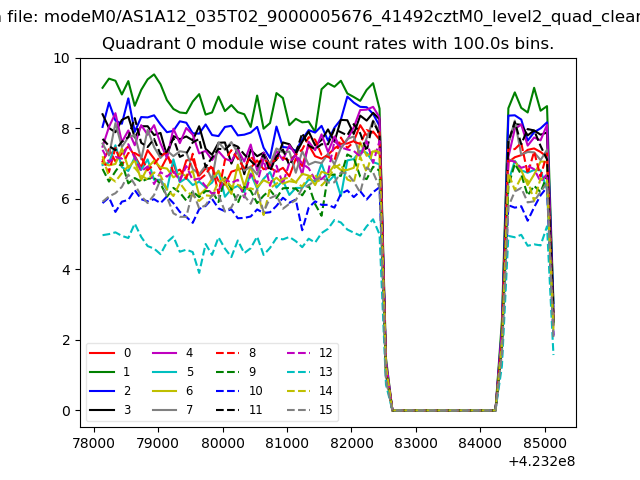 |
 |
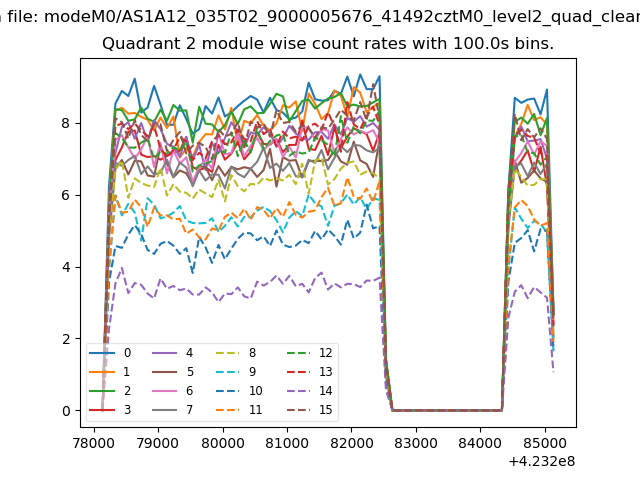
| Module-wise count rates for Quadrant B Data is divided into 100 sec bins |
 |
 |
| Module-wise count rates for Quadrant C Data is divided into 100 sec bins |
 |
 |
| Module-wise count rates for Quadrant D Data is divided into 100 sec bins |
 |
 |
| Parameter | Plot |
|---|---|
| CZT HV Monitor | 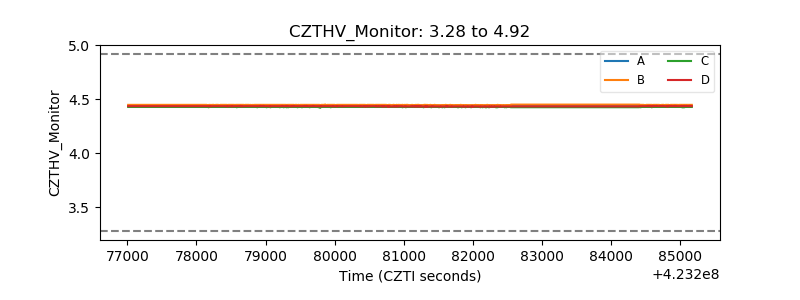 |
| D_VDD | 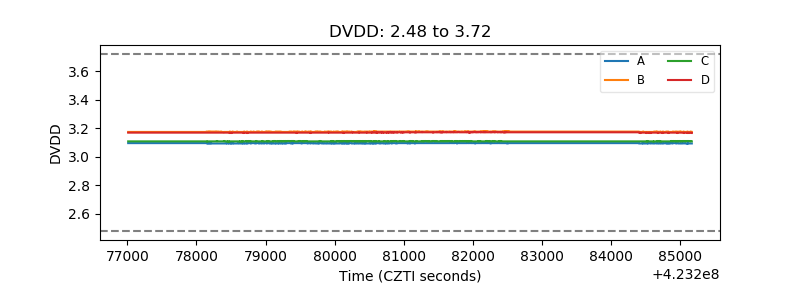 |
| Temperature 1 | 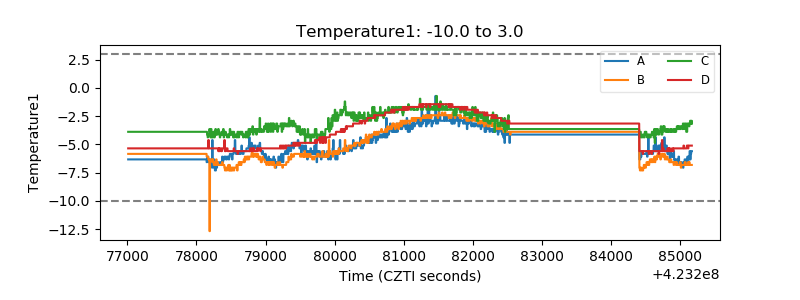 |
| Veto HV Monitor |  |
| Veto LLD | 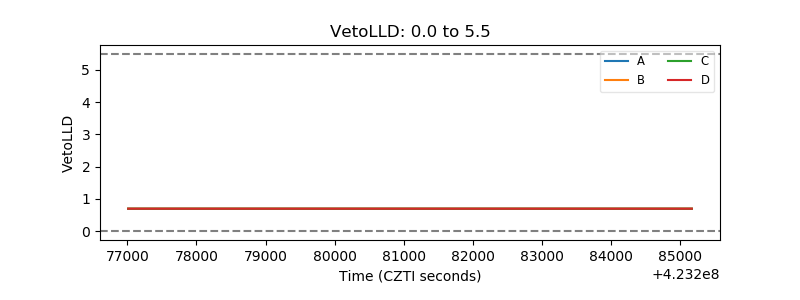 |
| Alpha Counter | 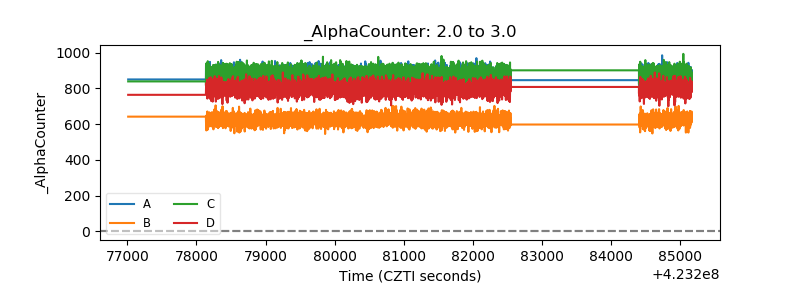 |
| _CPM_Rate | 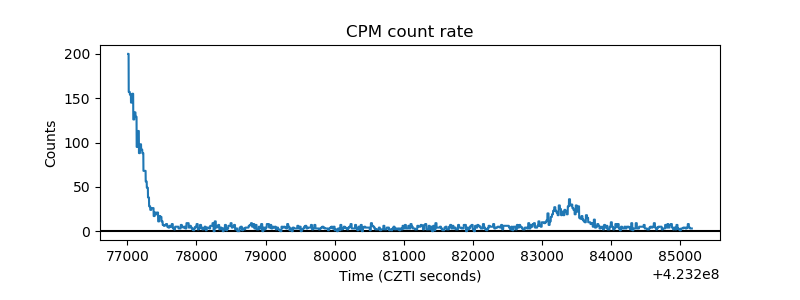 |
| CZT Counter | 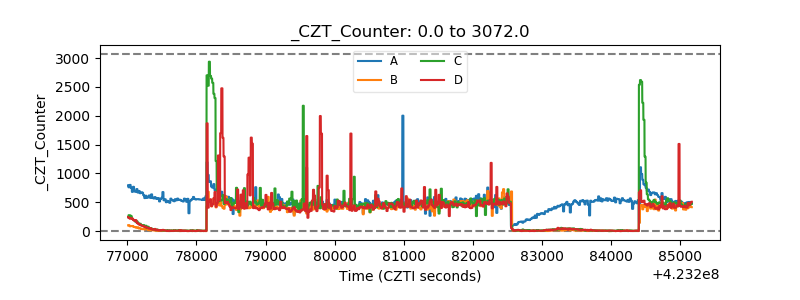 |
| +2.5 Volts monitor | 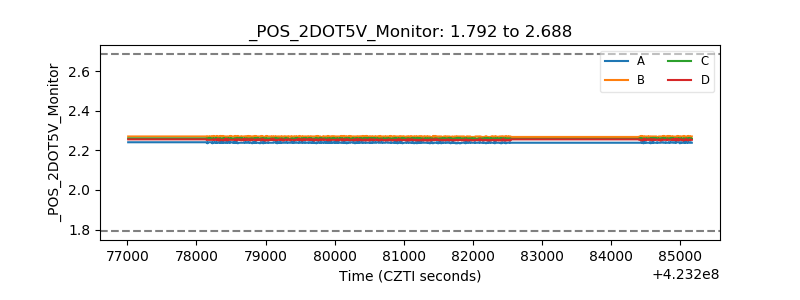 |
| +5 Volts monitor | 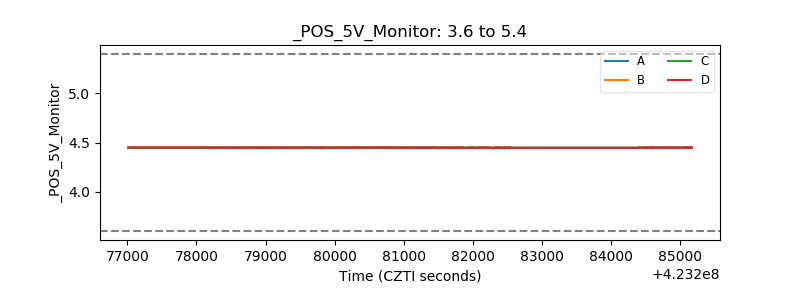 |
| _ROLL_ROT | 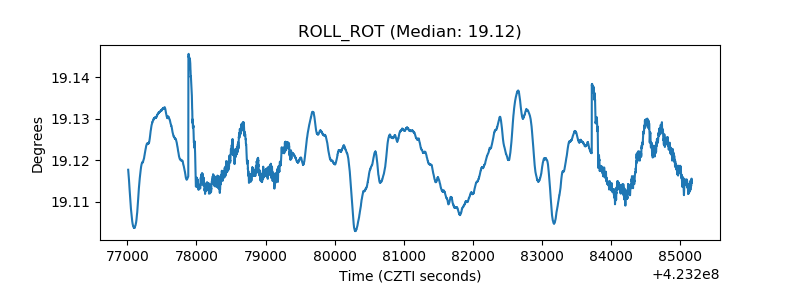 |
| _Roll_DEC | 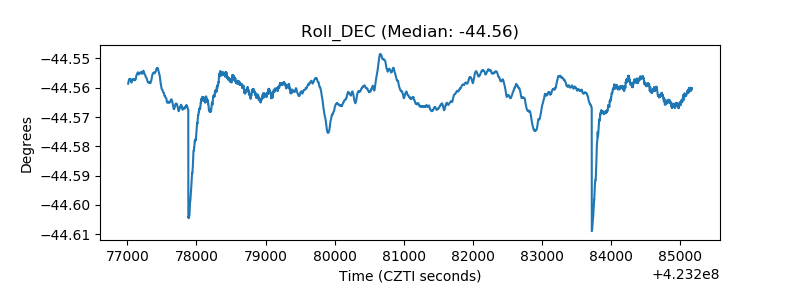 |
| _Roll_RA | 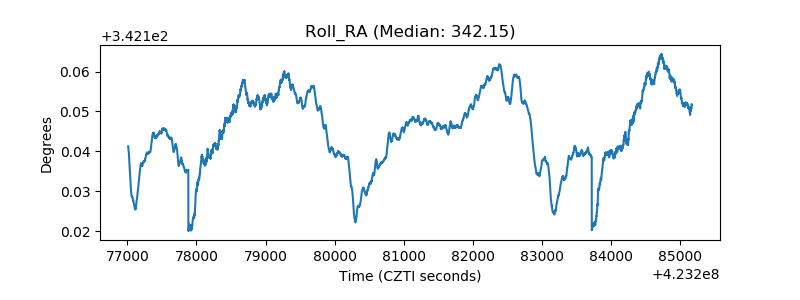 |
| Veto Counter | 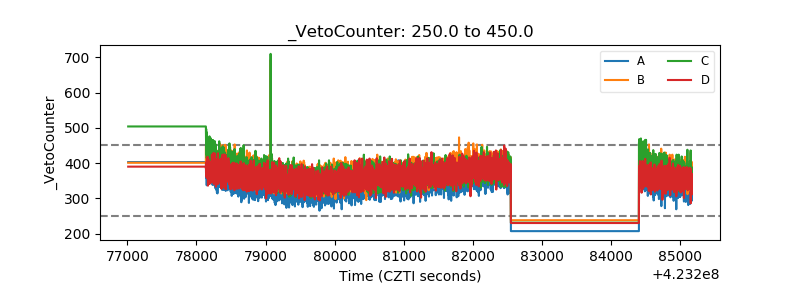 |