| Param | Original file | Final file |
|---|---|---|
| Filename | modeM0/AS1A12_035T02_9000005676_41493cztM0_level2.fits | modeM0/AS1A12_035T02_9000005676_41493cztM0_level2_quad_clean.evt |
| Size (bytes) | 334,520,640 | 95,800,320 |
| Size | 319.0 MB | 91.4 MB |
| Events in quadrant A | 3,080,171 | 642,489 |
| Events in quadrant B | 2,596,073 | 654,548 |
| Events in quadrant C | 3,268,807 | 614,256 |
| Events in quadrant D | 2,983,797 | 581,560 |
| Mode SS | |||
|---|---|---|---|
| Quadrant | BADHDUFLAG | Total packets | Discarded packets |
| A | 0 | 124 | 0 |
| B | 0 | 124 | 0 |
| C | 0 | 124 | 0 |
| D | 0 | 124 | 0 |
| Mode M0 | |||
|---|---|---|---|
| Quadrant | BADHDUFLAG | Total packets | Discarded packets |
| A | 0 | 12586 | 3 |
| B | 0 | 11836 | 2 |
| C | 0 | 13299 | 2 |
| D | 0 | 12794 | 2 |
| Mode M9 | |||
|---|---|---|---|
| Quadrant | BADHDUFLAG | Total packets | Discarded packets |
| A | 0 | 33 | 0 |
| B | 0 | 33 | 0 |
| C | 0 | 33 | 0 |
| D | 0 | 33 | 0 |
| Quadrant | Total seconds | Saturated seconds | Saturation percentage |
|---|---|---|---|
| A | 5825 | 11 | 0.188841% |
| B | 5825 | 11 | 0.188841% |
| C | 5825 | 176 | 3.021459% |
| D | 5825 | 52 | 0.892704% |
Noise dominated data is calculated using 1-second bins in cleaned event files. If a bin has >2000 counts, and if more than 50% of those come from <1% of pixels, then it is considered to be noise-dominated and hence unusable.
| Quadrant | # 1 sec bins | Bins with >0 counts | Bins with >2000 counts | High rate bins dominated by noise | Noise dominated (total time) | Noise dominated (detector-on time) | Marked lightcurve |
|---|---|---|---|---|---|---|---|
| A | 9203 | 5827 | 2 | 2 | 0.02% | 0.03% |  |
| B | 9203 | 5827 | 2 | 2 | 0.02% | 0.03% | 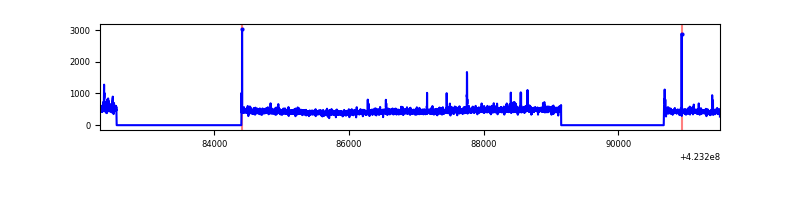 |
| C | 9203 | 5827 | 159 | 159 | 1.73% | 2.73% | 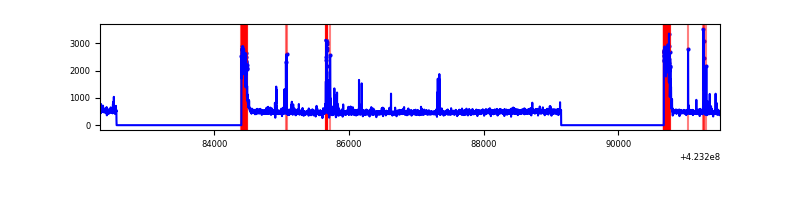 |
| D | 9203 | 5827 | 52 | 52 | 0.57% | 0.89% | 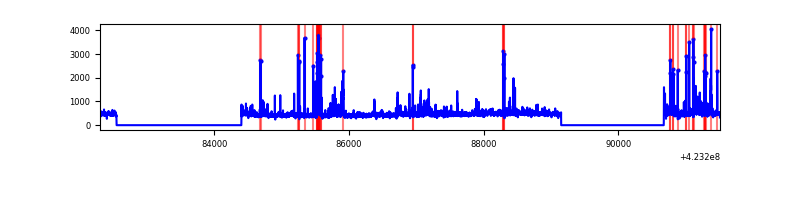 |
Top three noisy pixels from each quadrant. If the there are fewer than three noisy pixels in the level2.evt file, extra rows are filled as -1
| Pixel properties | Quadrant properties | ||||||
|---|---|---|---|---|---|---|---|
| Quadrant | DetID | PixID | Counts | Sigma | Mean | Median | Sigma |
| A | 10 | 83 | 552847 | 4194.75 | 642 | 630 | 131.6 |
| A | 2 | 79 | 22531 | 166.36 | 642 | 630 | 131.6 |
| A | 13 | 248 | 18382 | 134.85 | 642 | 630 | 131.6 |
| B | 0 | 190 | 54004 | 432.23 | 636 | 618 | 123.5 |
| B | 0 | 245 | 19317 | 151.39 | 636 | 618 | 123.5 |
| B | 12 | 111 | 15770 | 122.68 | 636 | 618 | 123.5 |
| C | 0 | 10 | 401756 | 2767.45 | 622 | 626 | 144.9 |
| C | 15 | 214 | 244441 | 1682.11 | 622 | 626 | 144.9 |
| C | 14 | 254 | 129652 | 890.17 | 622 | 626 | 144.9 |
| D | 12 | 6 | 183629 | 1200.43 | 628 | 612 | 152.5 |
| D | 1 | 52 | 101761 | 663.45 | 628 | 612 | 152.5 |
| D | 2 | 249 | 81662 | 531.61 | 628 | 612 | 152.5 |
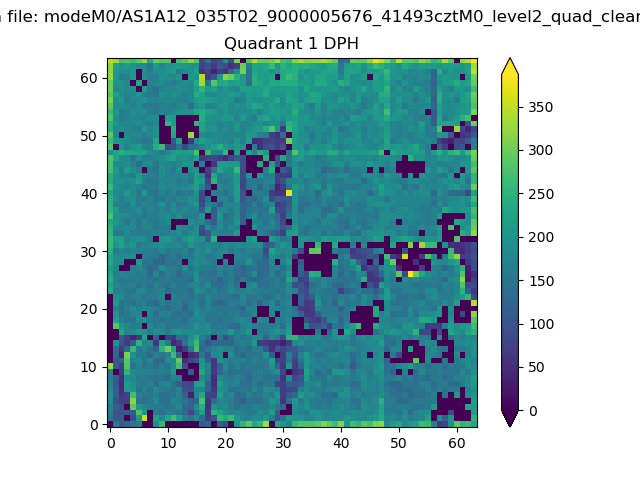
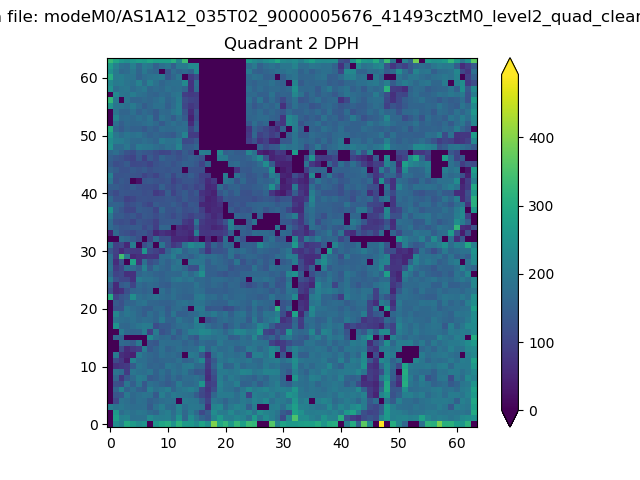
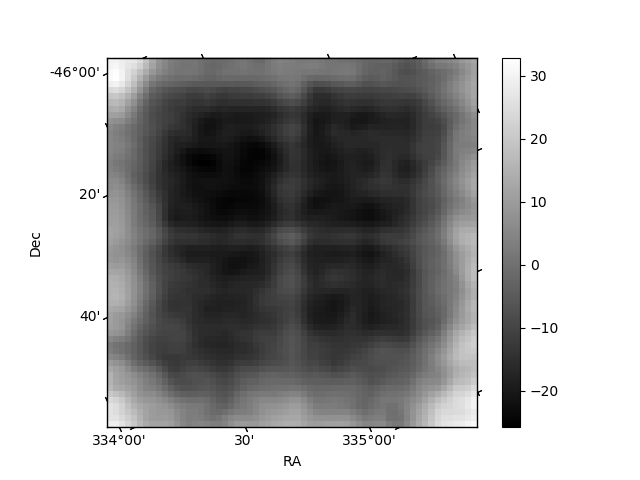
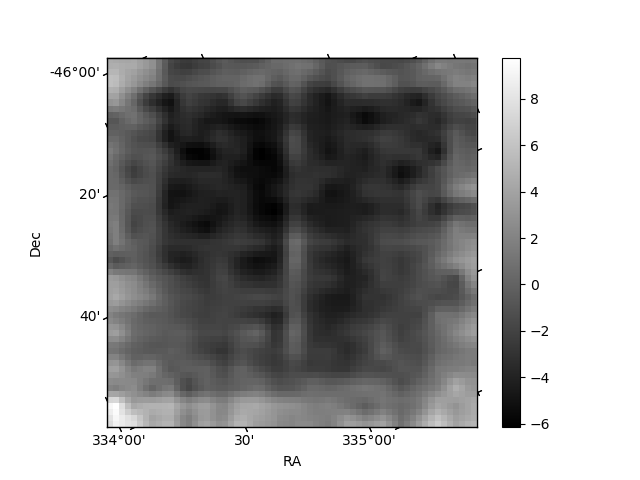
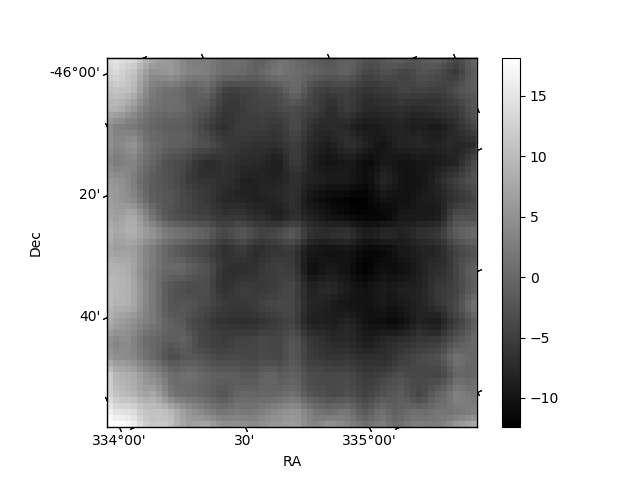
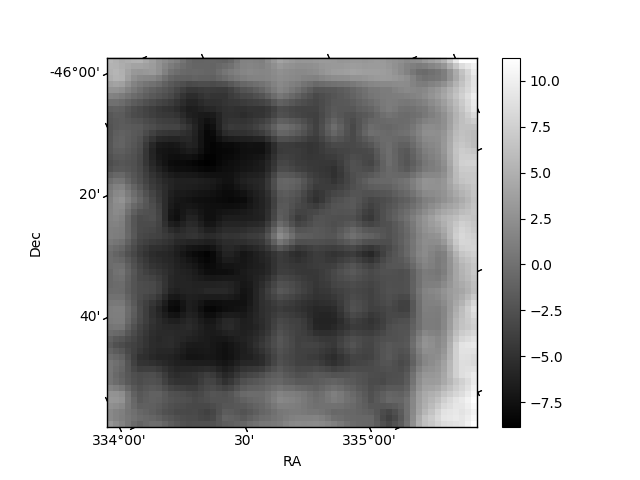
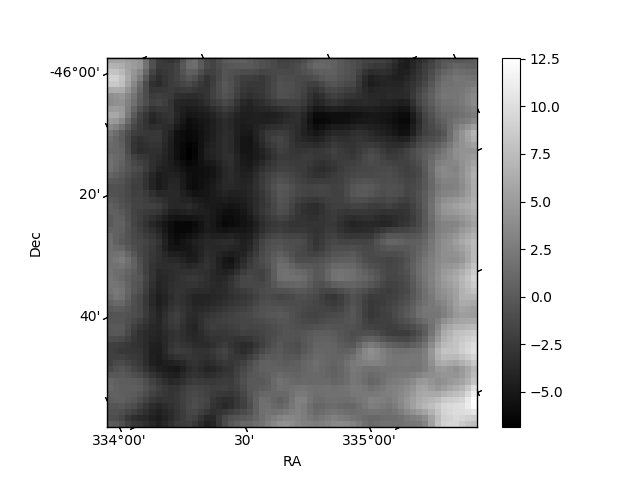
Histogram calculated using DETX and DETY for each event in the final _common_clean file
| Quadrant A | 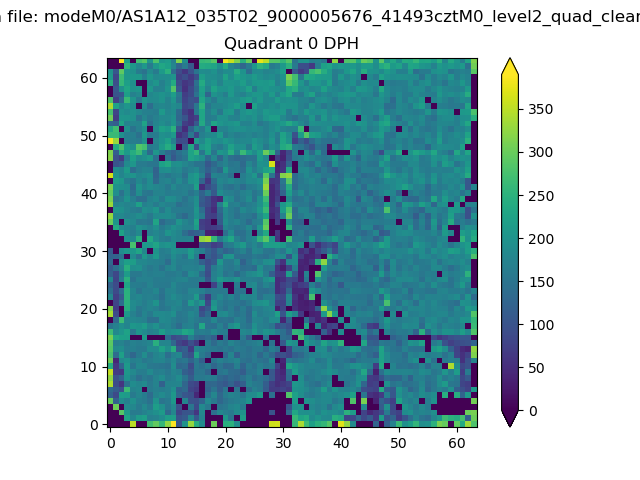 |
 |
Quadrant B |
|---|---|---|---|
| Quadrant D | 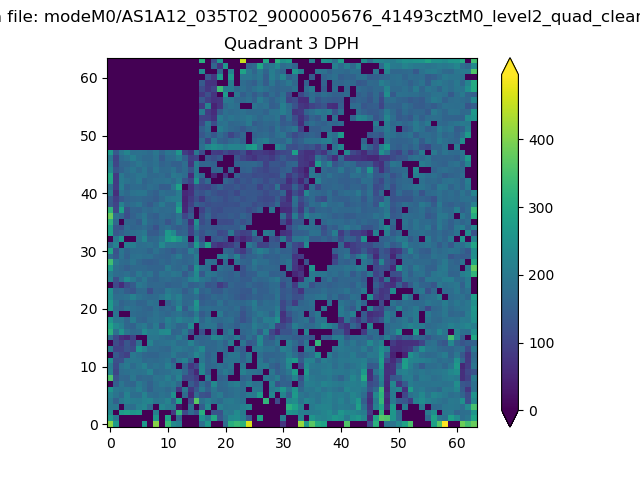 |
 |
Quadrant C |
| Plot type | Count rate plots | Images |
|---|---|---|
| Comparison with Poisson distribution Blue bars denote a histogram of data divided into 1 sec bins. Red curve is a Poisson curve with rate = median count rate of data. |
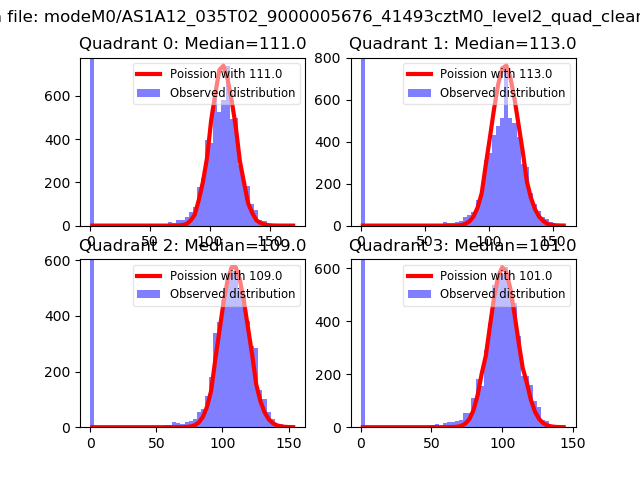 |
 |
| Quadrant-wise count rates Data is divided into 100 sec bins |
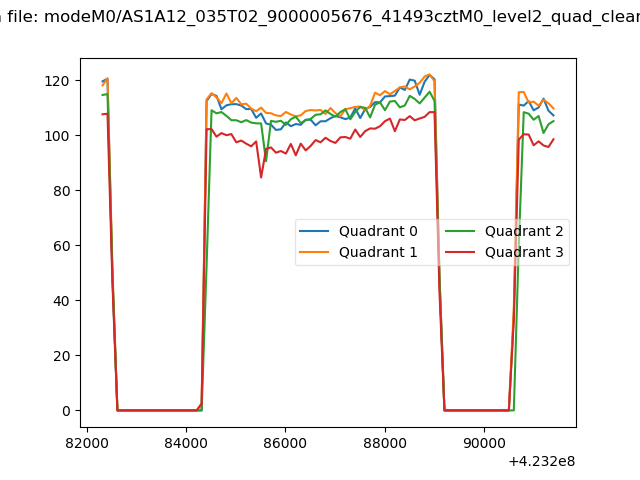 |
|
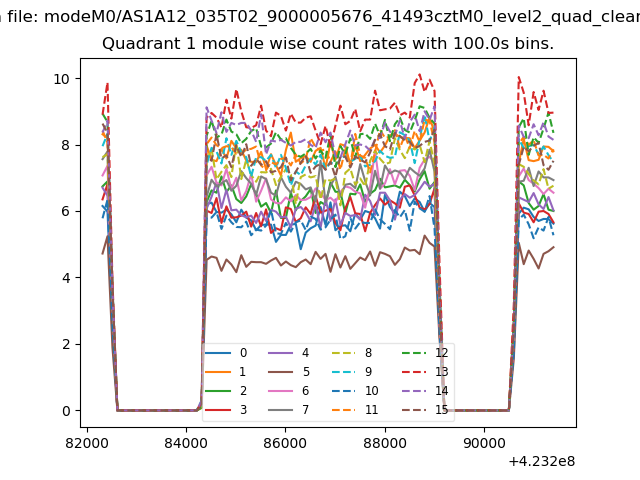
| Module-wise count rates for Quadrant A Data is divided into 100 sec bins |
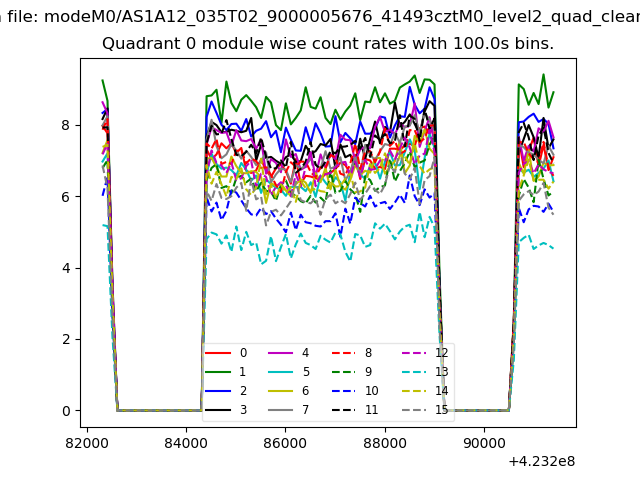 |
 |
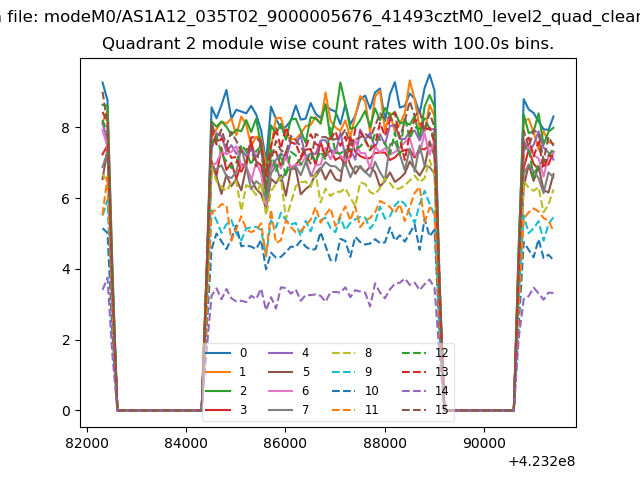
| Module-wise count rates for Quadrant B Data is divided into 100 sec bins |
 |
 |
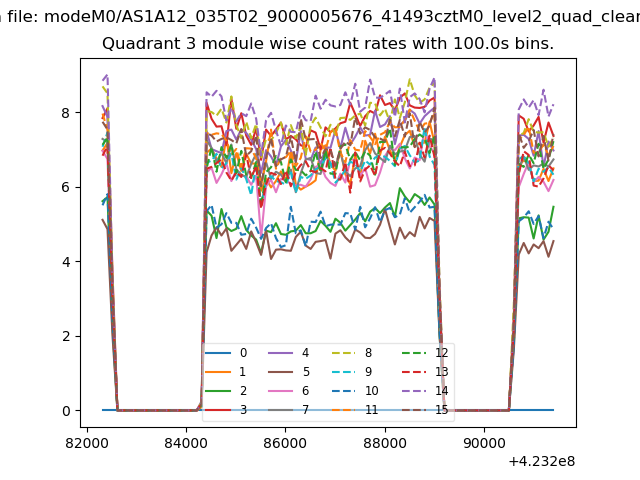
| Module-wise count rates for Quadrant C Data is divided into 100 sec bins |
 |
 |
| Module-wise count rates for Quadrant D Data is divided into 100 sec bins |
 |
 |
| Parameter | Plot |
|---|---|
| CZT HV Monitor | 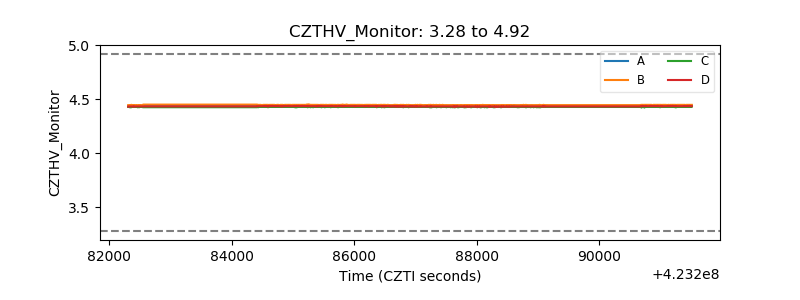 |
| D_VDD | 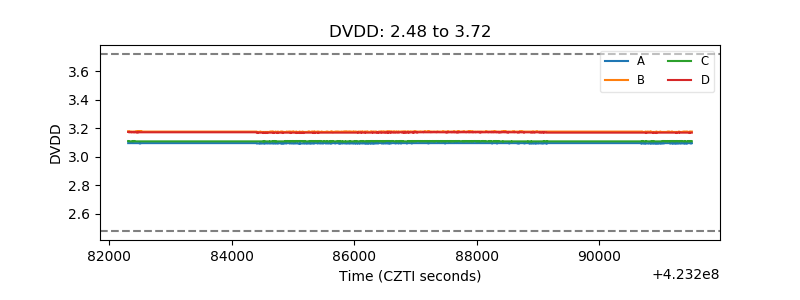 |
| Temperature 1 | 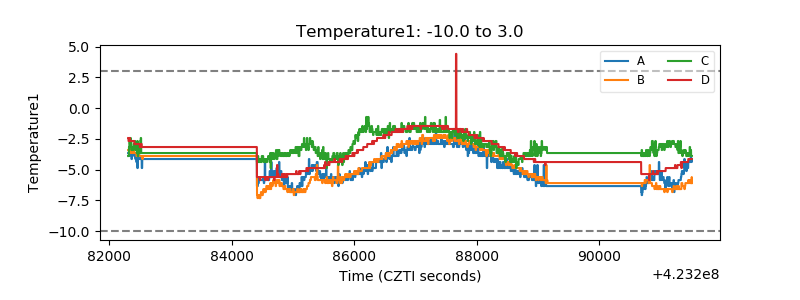 |
| Veto HV Monitor | 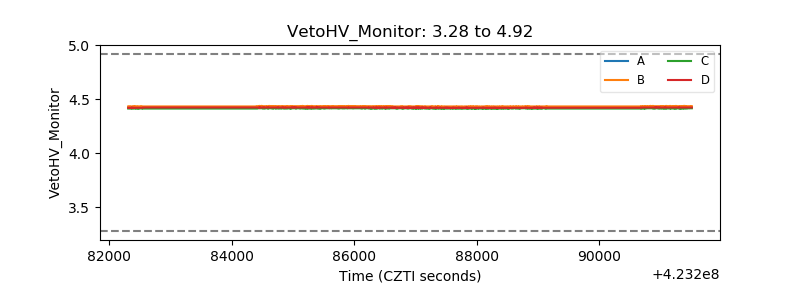 |
| Veto LLD | 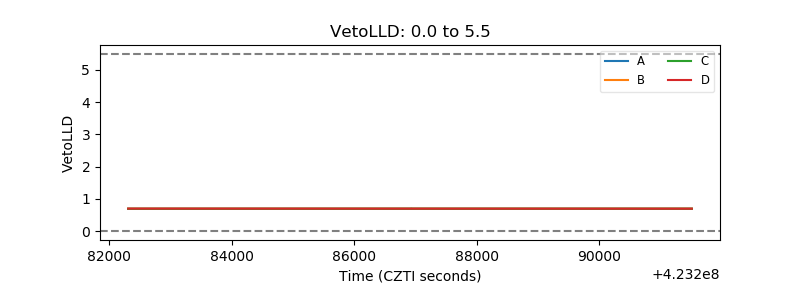 |
| Alpha Counter | 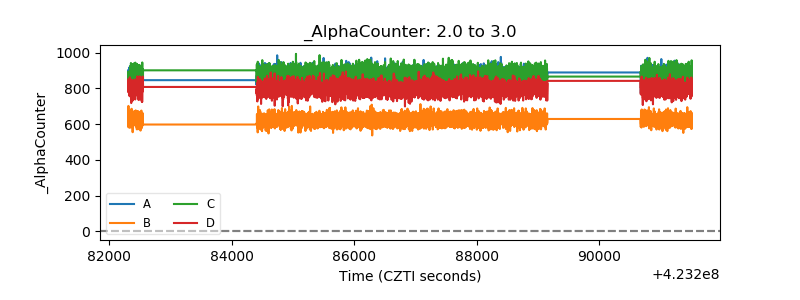 |
| _CPM_Rate | 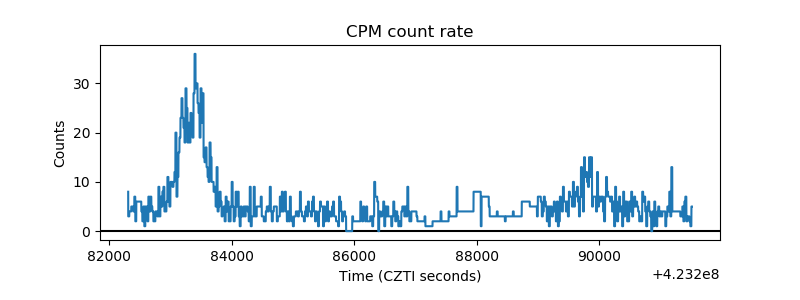 |
| CZT Counter | 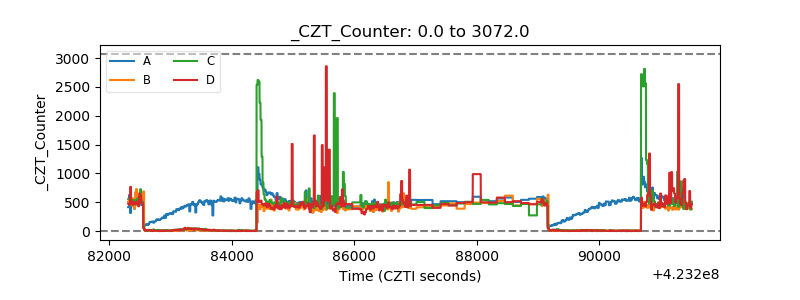 |
| +2.5 Volts monitor | 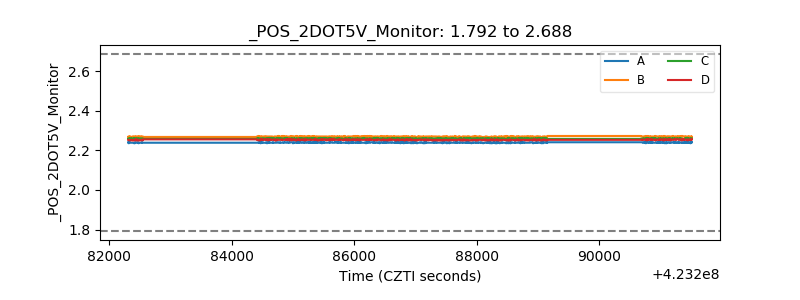 |
| +5 Volts monitor | 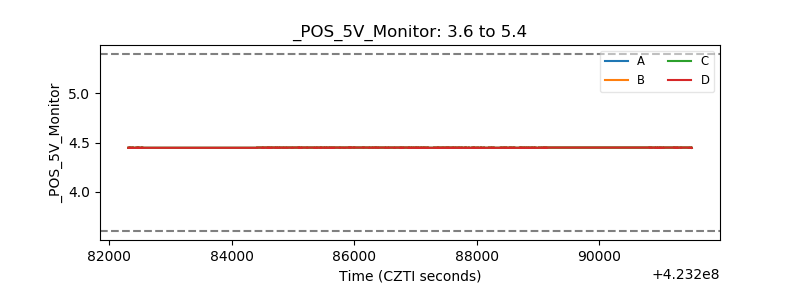 |
| _ROLL_ROT | 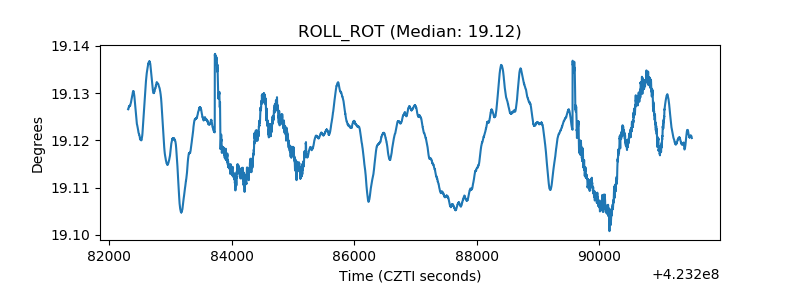 |
| _Roll_DEC | 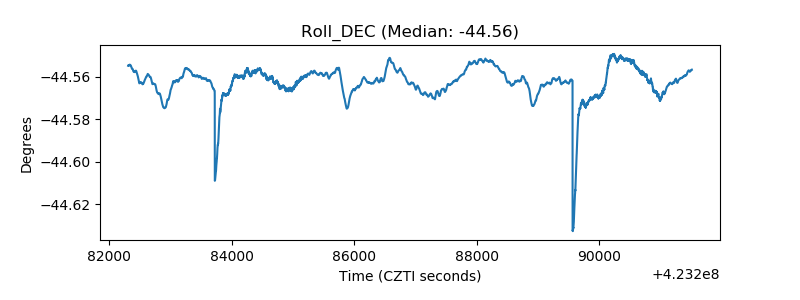 |
| _Roll_RA | 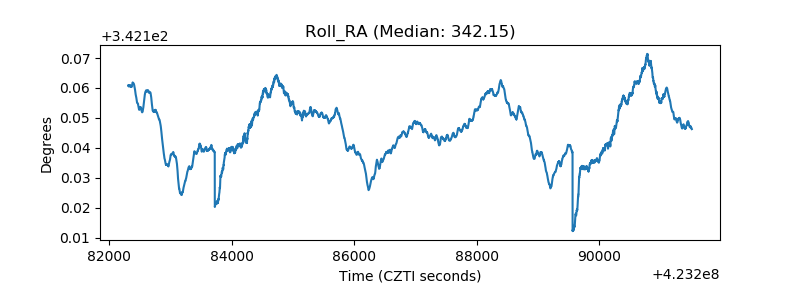 |
| Veto Counter | 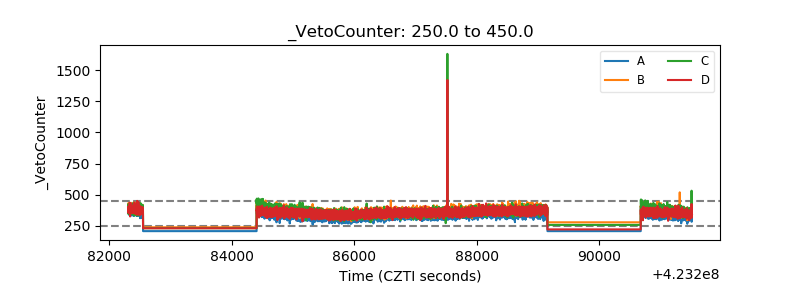 |