| Param | Original file | Final file |
|---|---|---|
| Filename | modeM0/AS1A12_035T02_9000005676_41497cztM0_level2.fits | modeM0/AS1A12_035T02_9000005676_41497cztM0_level2_quad_clean.evt |
| Size (bytes) | 1,107,809,280 | 238,135,680 |
| Size | 1.0 GB | 227.1 MB |
| Events in quadrant A | 8,234,750 | 1,656,565 |
| Events in quadrant B | 7,030,666 | 1,698,389 |
| Events in quadrant C | 8,293,910 | 1,602,876 |
| Events in quadrant D | 16,253,463 | 1,188,145 |
| Mode SS | |||
|---|---|---|---|
| Quadrant | BADHDUFLAG | Total packets | Discarded packets |
| A | 0 | 316 | 0 |
| B | 0 | 316 | 0 |
| C | 0 | 316 | 0 |
| D | 0 | 316 | 0 |
| Mode M0 | |||
|---|---|---|---|
| Quadrant | BADHDUFLAG | Total packets | Discarded packets |
| A | 0 | 33244 | 5 |
| B | 0 | 31524 | 4 |
| C | 0 | 34266 | 4 |
| D | 0 | 58841 | 4 |
| Mode M9 | |||
|---|---|---|---|
| Quadrant | BADHDUFLAG | Total packets | Discarded packets |
| A | 0 | 55 | 0 |
| B | 0 | 55 | 0 |
| C | 0 | 55 | 0 |
| D | 0 | 55 | 0 |
| Quadrant | Total seconds | Saturated seconds | Saturation percentage |
|---|---|---|---|
| A | 15419 | 62 | 0.402101% |
| B | 15419 | 29 | 0.188080% |
| C | 15419 | 389 | 2.522861% |
| D | 15419 | 3302 | 21.415137% |
Noise dominated data is calculated using 1-second bins in cleaned event files. If a bin has >2000 counts, and if more than 50% of those come from <1% of pixels, then it is considered to be noise-dominated and hence unusable.
| Quadrant | # 1 sec bins | Bins with >0 counts | Bins with >2000 counts | High rate bins dominated by noise | Noise dominated (total time) | Noise dominated (detector-on time) | Marked lightcurve |
|---|---|---|---|---|---|---|---|
| A | 20882 | 15423 | 43 | 43 | 0.21% | 0.28% | 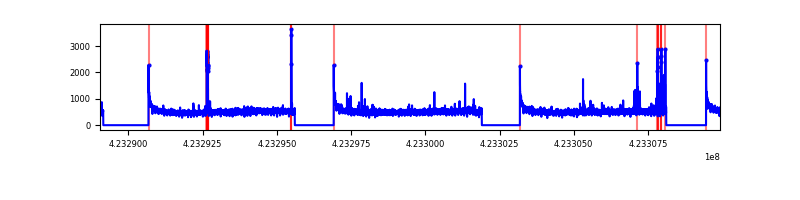 |
| B | 20882 | 15423 | 10 | 10 | 0.05% | 0.06% | 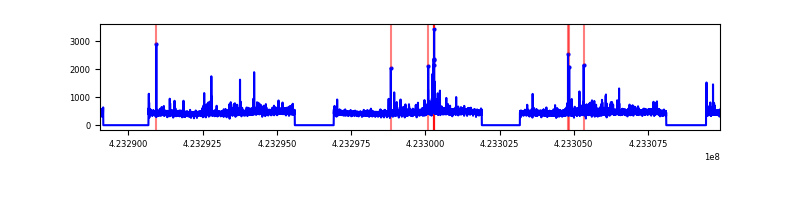 |
| C | 20882 | 15423 | 369 | 369 | 1.77% | 2.39% | 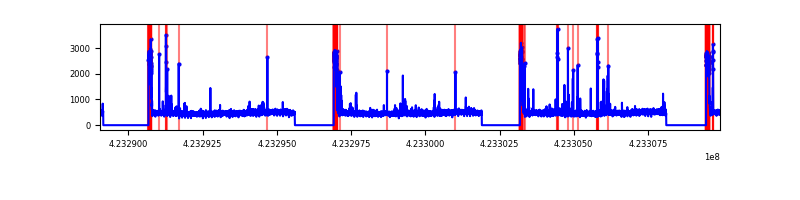 |
| D | 20882 | 15423 | 3048 | 3048 | 14.60% | 19.76% | 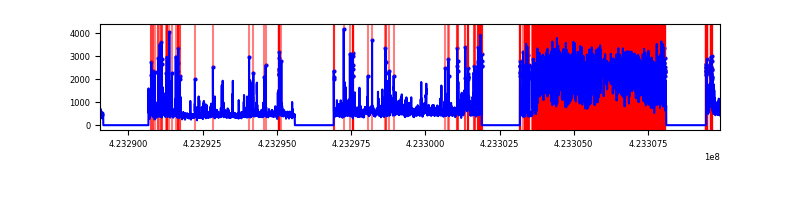 |
Top three noisy pixels from each quadrant. If the there are fewer than three noisy pixels in the level2.evt file, extra rows are filled as -1
| Pixel properties | Quadrant properties | ||||||
|---|---|---|---|---|---|---|---|
| Quadrant | DetID | PixID | Counts | Sigma | Mean | Median | Sigma |
| A | 10 | 83 | 1351418 | 3896.48 | 1705 | 1668 | 346.4 |
| A | 13 | 248 | 200574 | 574.21 | 1705 | 1668 | 346.4 |
| A | 2 | 79 | 80021 | 226.19 | 1705 | 1668 | 346.4 |
| B | 0 | 190 | 231501 | 702.03 | 1688 | 1640 | 327.4 |
| B | 15 | 35 | 63619 | 189.29 | 1688 | 1640 | 327.4 |
| B | 0 | 245 | 52967 | 156.76 | 1688 | 1640 | 327.4 |
| C | 0 | 10 | 961060 | 2533.19 | 1640 | 1652 | 378.7 |
| C | 15 | 214 | 638301 | 1680.99 | 1640 | 1652 | 378.7 |
| C | 14 | 254 | 135441 | 353.25 | 1640 | 1652 | 378.7 |
| D | 12 | 16 | 7681790 | 20675.28 | 1527 | 1488 | 371.5 |
| D | 12 | 79 | 1450359 | 3900.34 | 1527 | 1488 | 371.5 |
| D | 12 | 128 | 268592 | 719.04 | 1527 | 1488 | 371.5 |
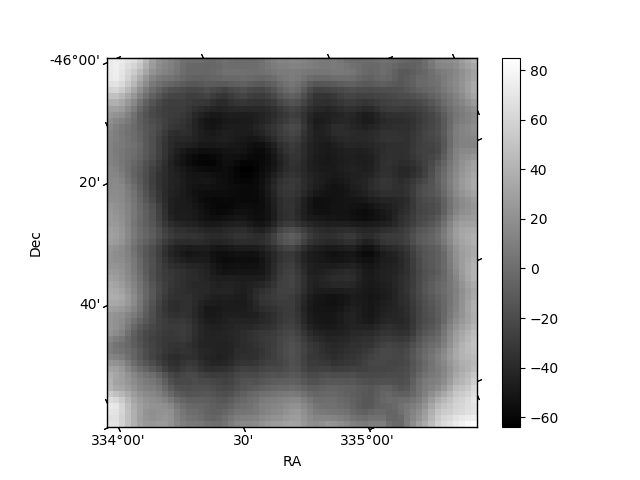
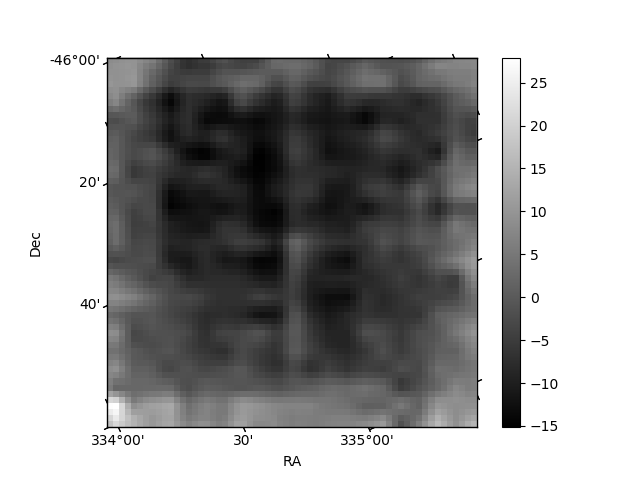
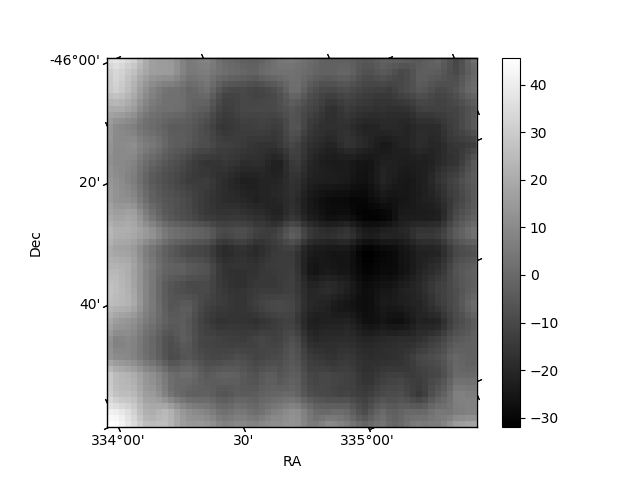
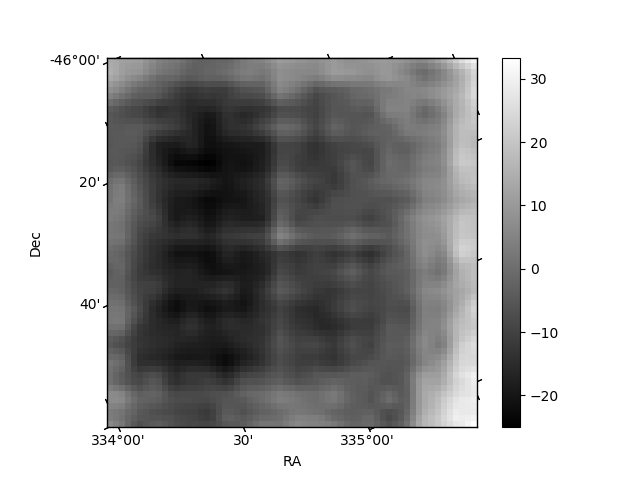
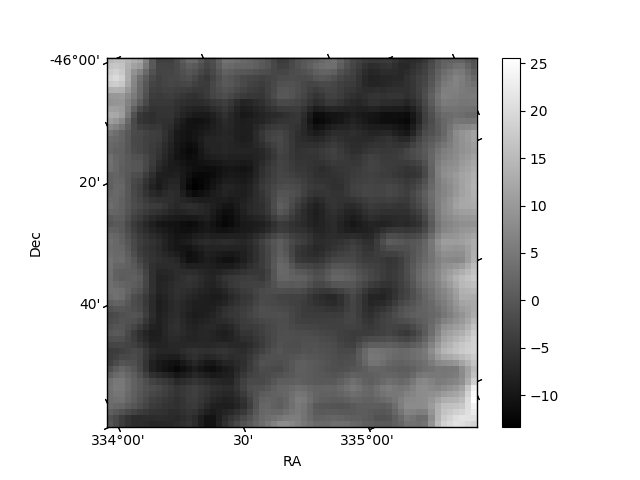
Histogram calculated using DETX and DETY for each event in the final _common_clean file
| Quadrant A | 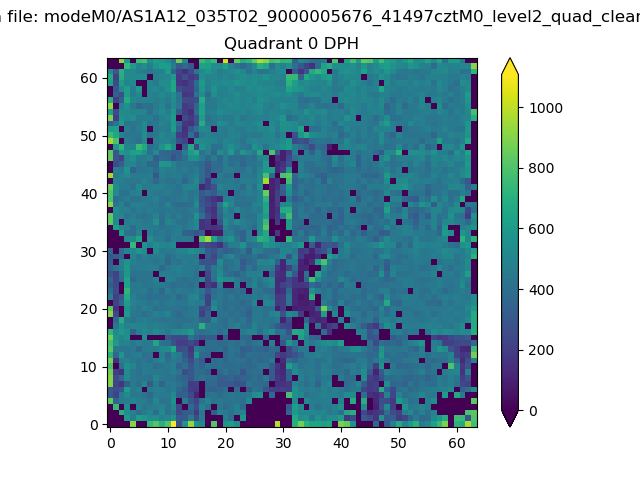 |
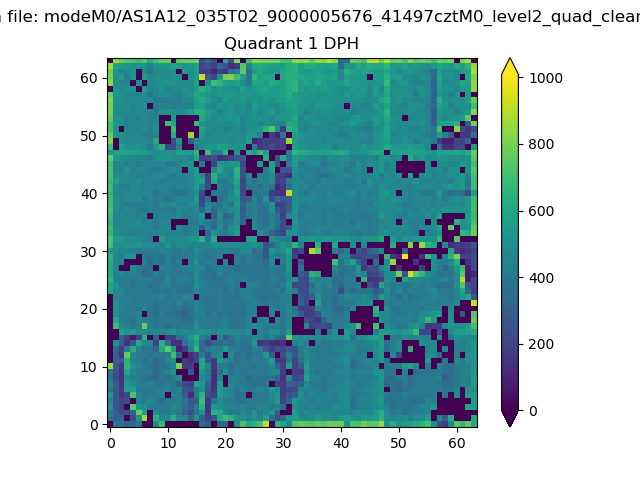 |
Quadrant B |
|---|---|---|---|
| Quadrant D | 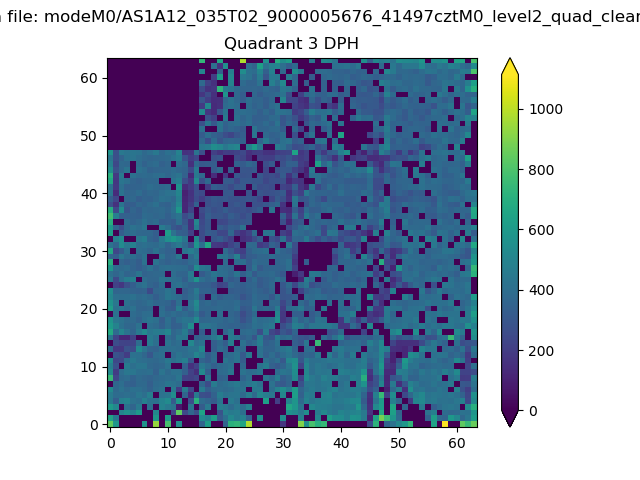 |
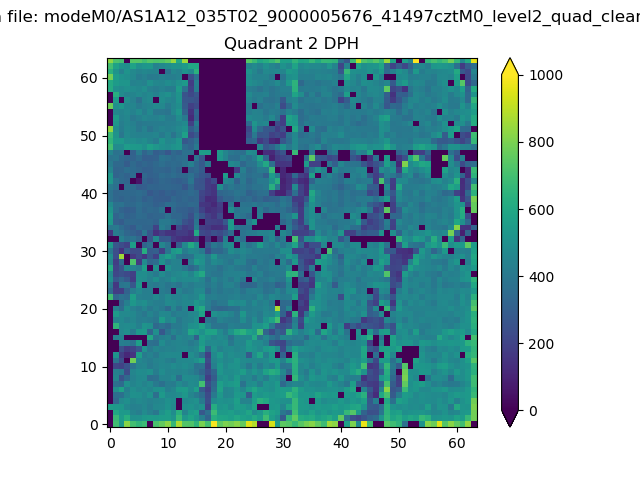 |
Quadrant C |
| Plot type | Count rate plots | Images |
|---|---|---|
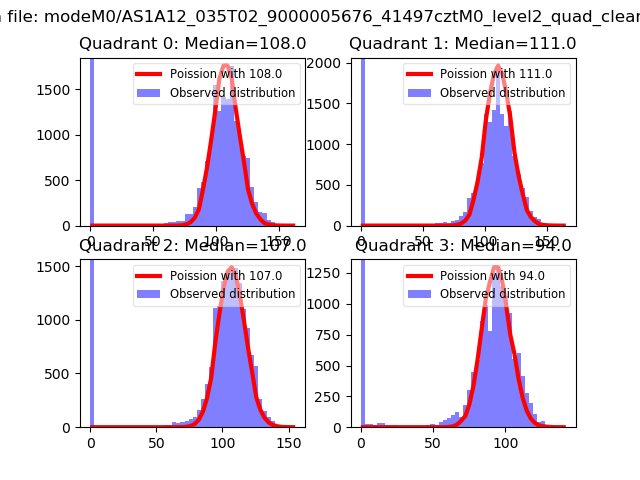
| Comparison with Poisson distribution Blue bars denote a histogram of data divided into 1 sec bins. Red curve is a Poisson curve with rate = median count rate of data. |
 |
 |
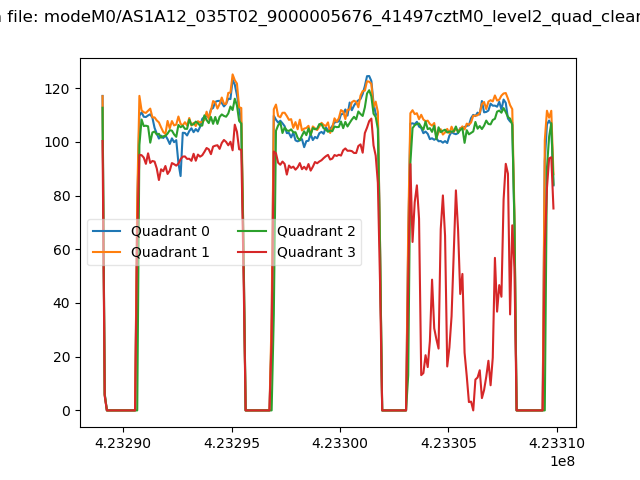
| Quadrant-wise count rates Data is divided into 100 sec bins |
 |
|
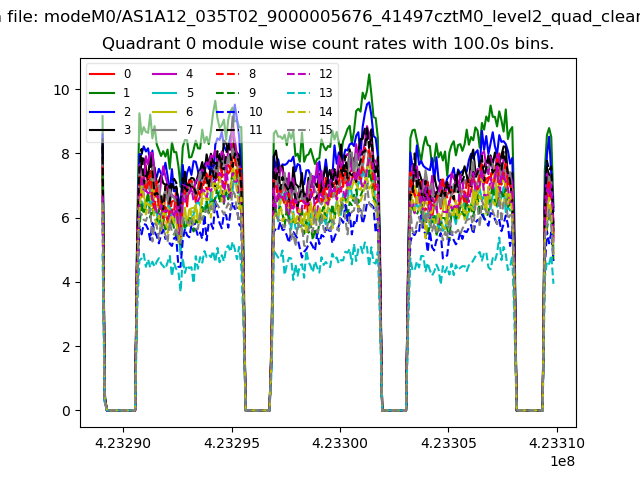
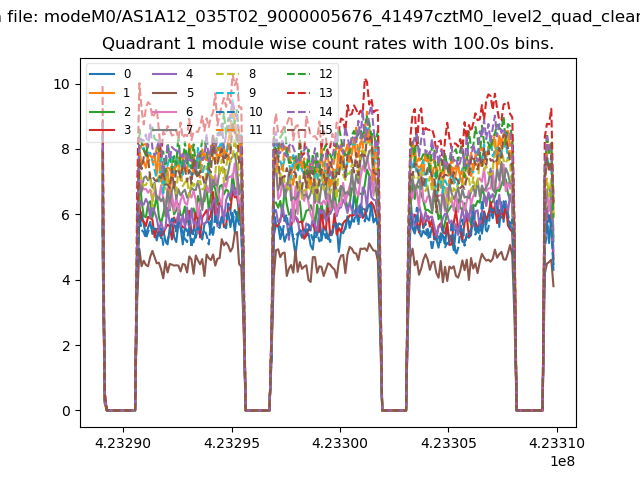
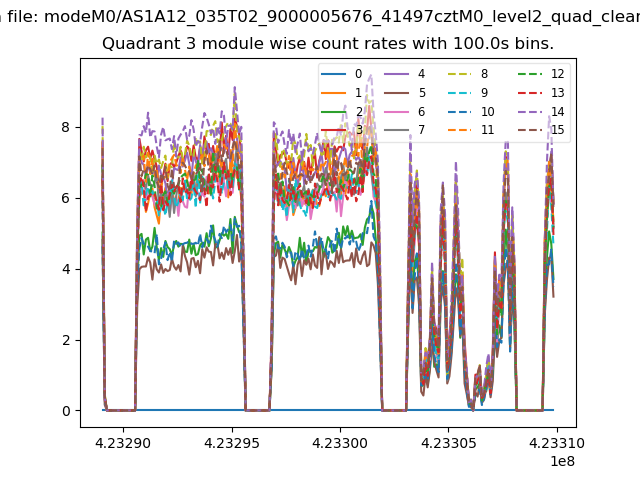
| Module-wise count rates for Quadrant A Data is divided into 100 sec bins |
 |
 |
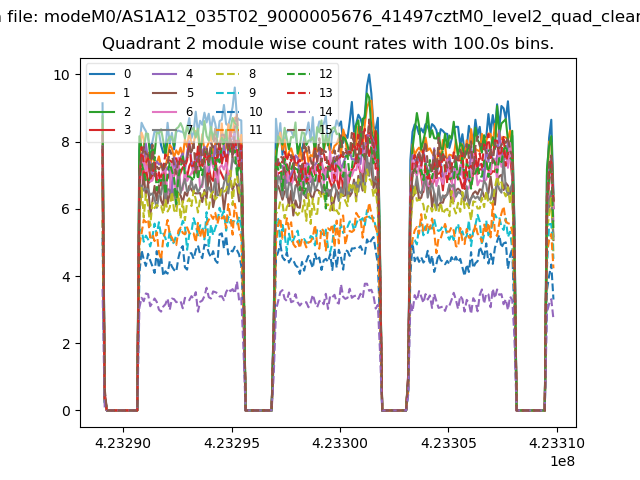
| Module-wise count rates for Quadrant B Data is divided into 100 sec bins |
 |
 |
| Module-wise count rates for Quadrant C Data is divided into 100 sec bins |
 |
 |
| Module-wise count rates for Quadrant D Data is divided into 100 sec bins |
 |
 |
| Parameter | Plot |
|---|---|
| CZT HV Monitor | 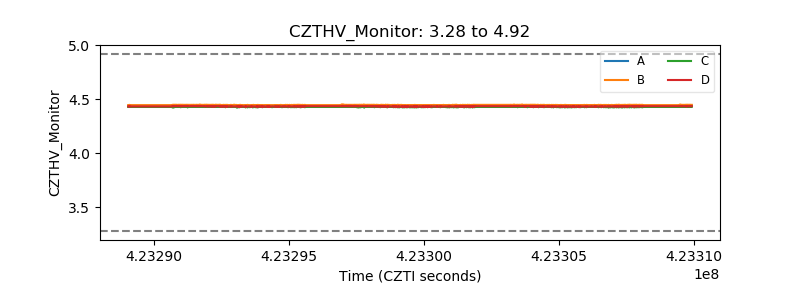 |
| D_VDD | 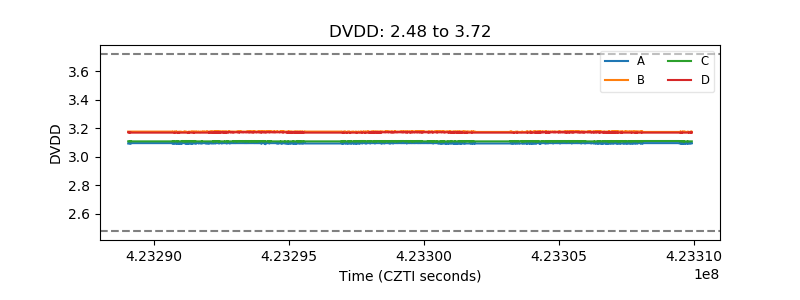 |
| Temperature 1 | 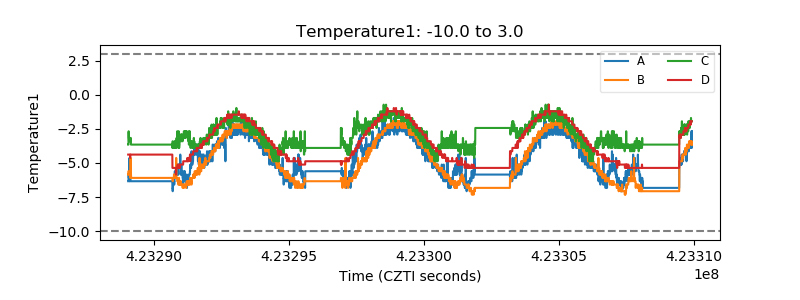 |
| Veto HV Monitor |  |
| Veto LLD | 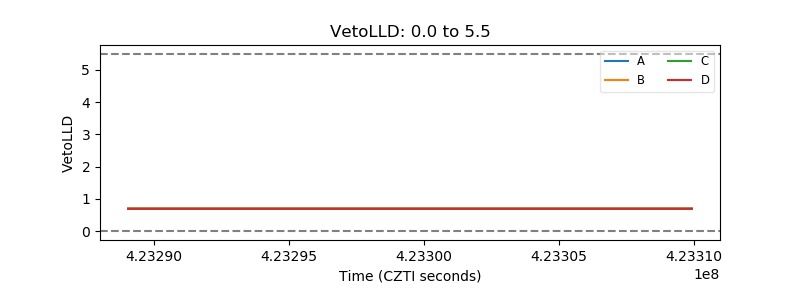 |
| Alpha Counter | 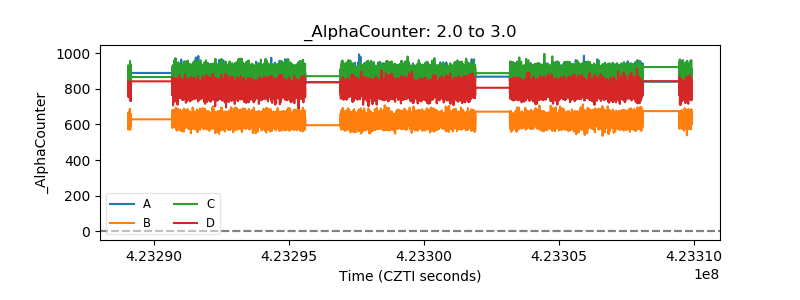 |
| _CPM_Rate | 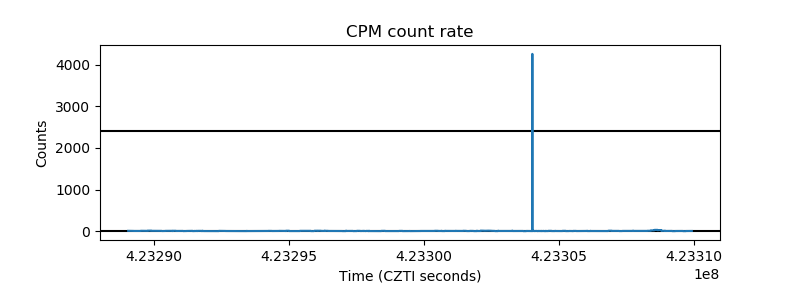 |
| CZT Counter | 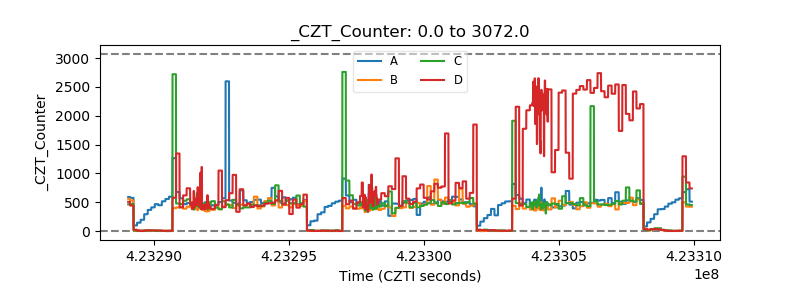 |
| +2.5 Volts monitor | 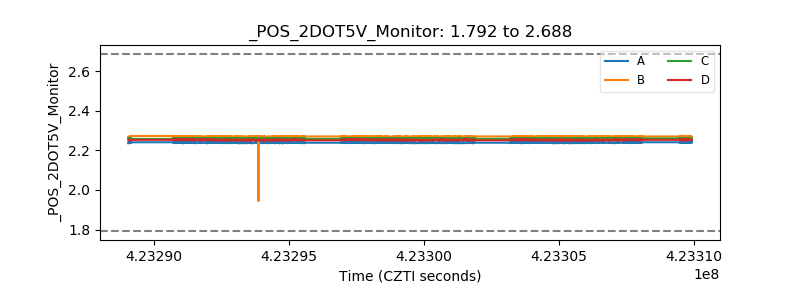 |
| +5 Volts monitor | 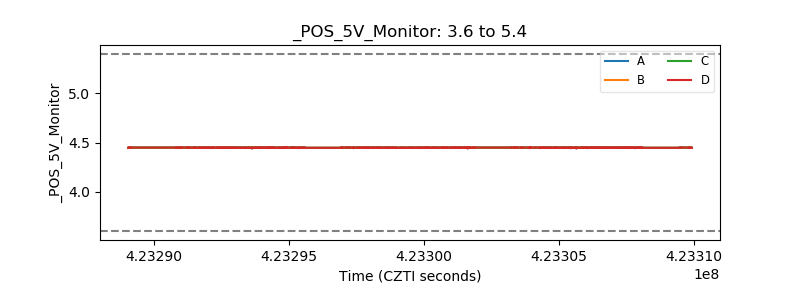 |
| _ROLL_ROT | 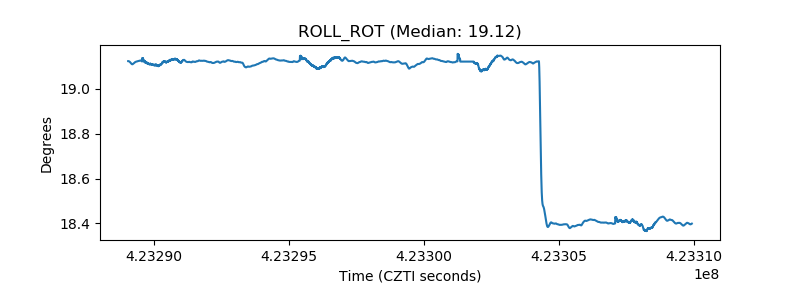 |
| _Roll_DEC | 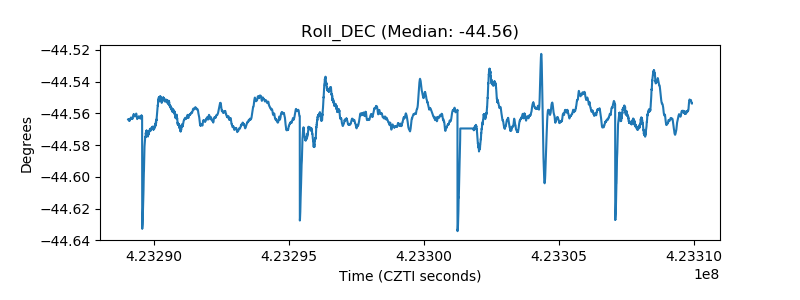 |
| _Roll_RA | 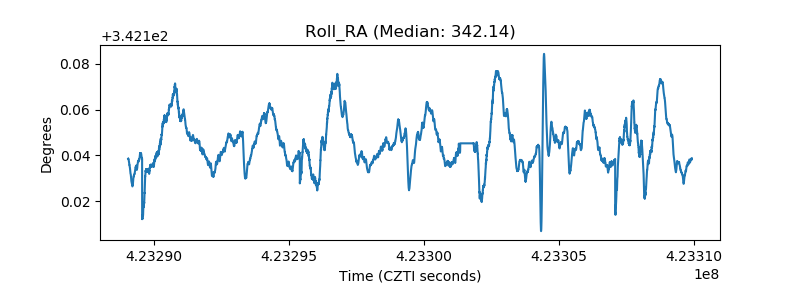 |
| Veto Counter | 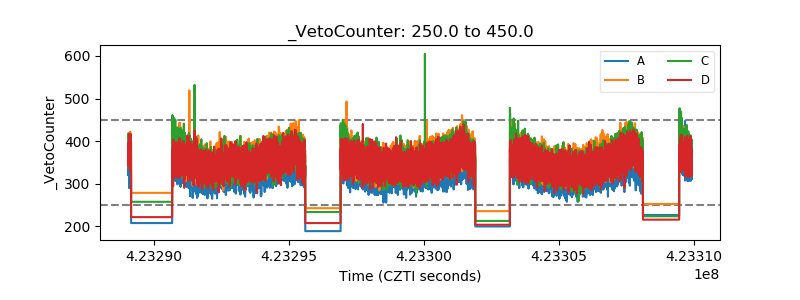 |