| Param | Original file | Final file |
|---|---|---|
| Filename | modeM0/AS1A12_035T02_9000005676_41498cztM0_level2.fits | modeM0/AS1A12_035T02_9000005676_41498cztM0_level2_quad_clean.evt |
| Size (bytes) | 778,060,800 | 161,049,600 |
| Size | 742.0 MB | 153.6 MB |
| Events in quadrant A | 5,647,976 | 1,124,896 |
| Events in quadrant B | 4,863,190 | 1,137,567 |
| Events in quadrant C | 5,818,331 | 1,070,482 |
| Events in quadrant D | 11,666,538 | 823,433 |
| Mode SS | |||
|---|---|---|---|
| Quadrant | BADHDUFLAG | Total packets | Discarded packets |
| A | 0 | 212 | 0 |
| B | 0 | 212 | 0 |
| C | 0 | 212 | 0 |
| D | 0 | 212 | 0 |
| Mode M0 | |||
|---|---|---|---|
| Quadrant | BADHDUFLAG | Total packets | Discarded packets |
| A | 0 | 22819 | 3 |
| B | 0 | 21514 | 2 |
| C | 0 | 23692 | 2 |
| D | 0 | 41727 | 2 |
| Mode M9 | |||
|---|---|---|---|
| Quadrant | BADHDUFLAG | Total packets | Discarded packets |
| A | 0 | 30 | 0 |
| B | 0 | 30 | 0 |
| C | 0 | 30 | 0 |
| D | 0 | 30 | 0 |
| Quadrant | Total seconds | Saturated seconds | Saturation percentage |
|---|---|---|---|
| A | 10388 | 67 | 0.644975% |
| B | 10388 | 49 | 0.471698% |
| C | 10388 | 304 | 2.926454% |
| D | 10388 | 2263 | 21.784752% |
Noise dominated data is calculated using 1-second bins in cleaned event files. If a bin has >2000 counts, and if more than 50% of those come from <1% of pixels, then it is considered to be noise-dominated and hence unusable.
| Quadrant | # 1 sec bins | Bins with >0 counts | Bins with >2000 counts | High rate bins dominated by noise | Noise dominated (total time) | Noise dominated (detector-on time) | Marked lightcurve |
|---|---|---|---|---|---|---|---|
| A | 13435 | 10390 | 33 | 33 | 0.25% | 0.32% | 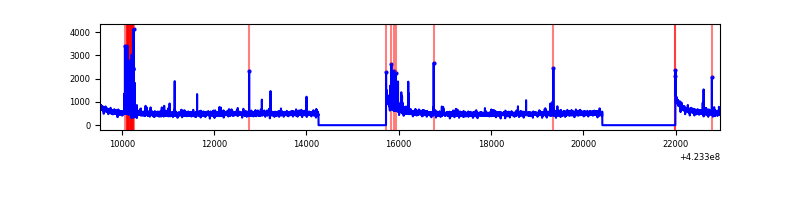 |
| B | 13435 | 10390 | 29 | 29 | 0.22% | 0.28% | 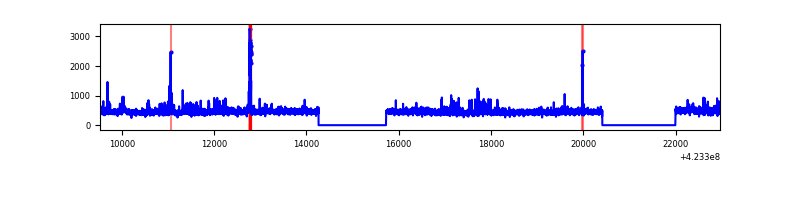 |
| C | 13435 | 10390 | 287 | 287 | 2.14% | 2.76% | 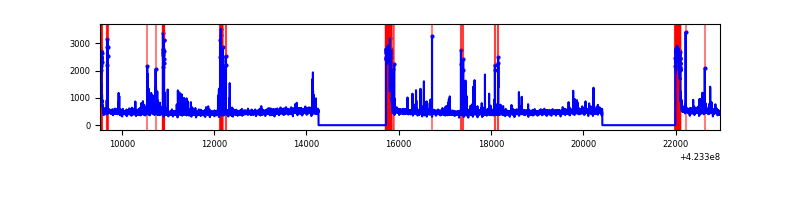 |
| D | 13435 | 10390 | 1984 | 1984 | 14.77% | 19.10% | 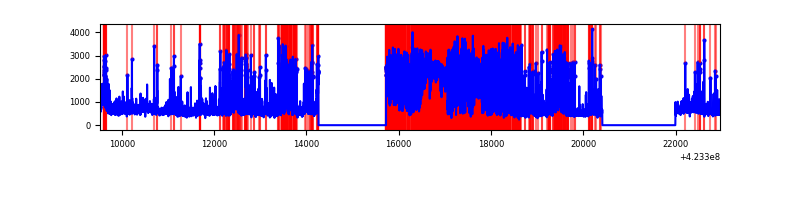 |
Top three noisy pixels from each quadrant. If the there are fewer than three noisy pixels in the level2.evt file, extra rows are filled as -1
| Pixel properties | Quadrant properties | ||||||
|---|---|---|---|---|---|---|---|
| Quadrant | DetID | PixID | Counts | Sigma | Mean | Median | Sigma |
| A | 10 | 83 | 925338 | 3952.92 | 1143 | 1118 | 233.8 |
| A | 13 | 248 | 219293 | 933.14 | 1143 | 1118 | 233.8 |
| A | 2 | 79 | 55732 | 233.59 | 1143 | 1118 | 233.8 |
| B | 0 | 190 | 212772 | 972.57 | 1132 | 1099 | 217.6 |
| B | 0 | 245 | 138505 | 631.33 | 1132 | 1099 | 217.6 |
| B | 12 | 111 | 28097 | 124.05 | 1132 | 1099 | 217.6 |
| C | 0 | 10 | 700044 | 2749.12 | 1095 | 1103 | 254.2 |
| C | 15 | 214 | 429616 | 1685.46 | 1095 | 1103 | 254.2 |
| C | 14 | 254 | 204009 | 798.08 | 1095 | 1103 | 254.2 |
| D | 12 | 16 | 5860140 | 24033.88 | 991 | 959 | 243.8 |
| D | 12 | 79 | 773713 | 3169.77 | 991 | 959 | 243.8 |
| D | 1 | 47 | 342857 | 1402.44 | 991 | 959 | 243.8 |
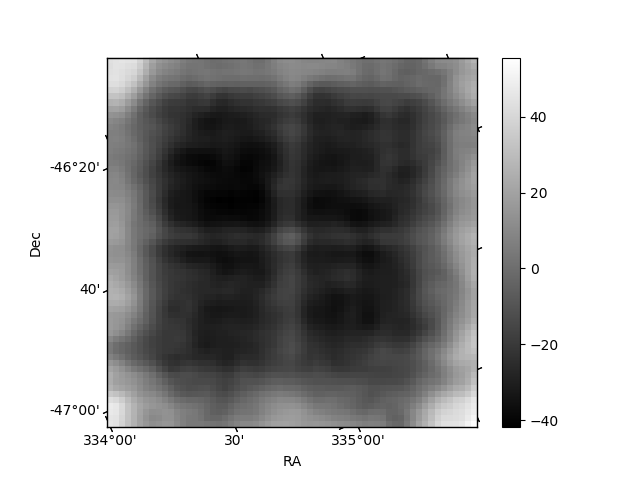
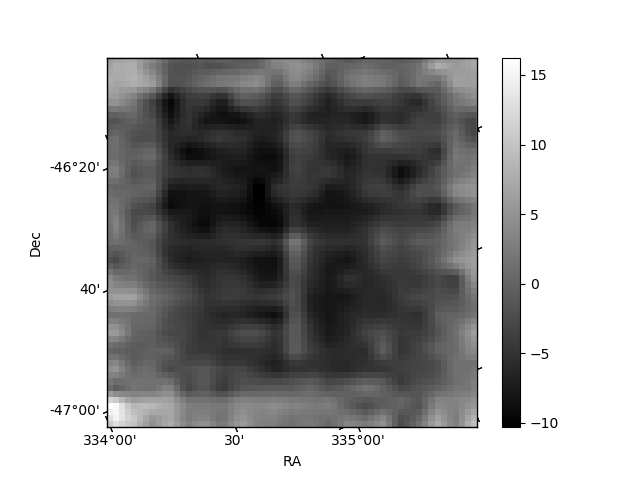
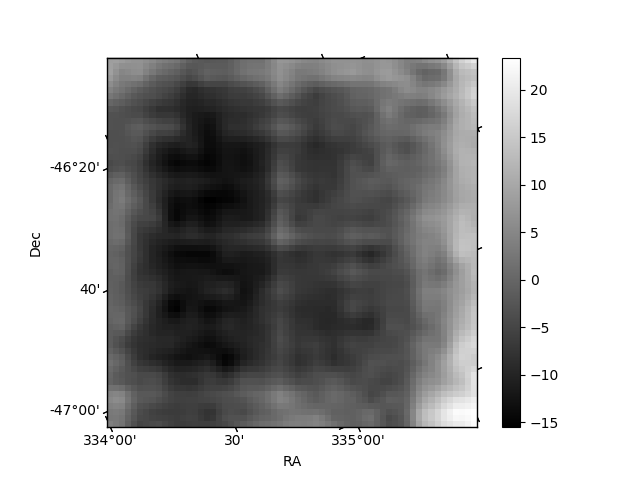
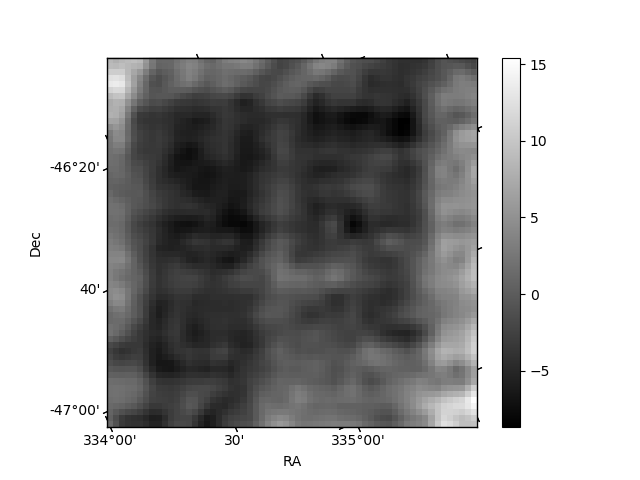
Histogram calculated using DETX and DETY for each event in the final _common_clean file
| Quadrant A | 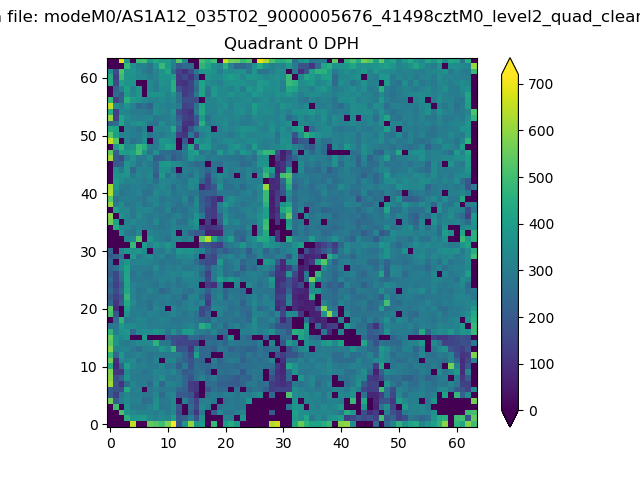 |
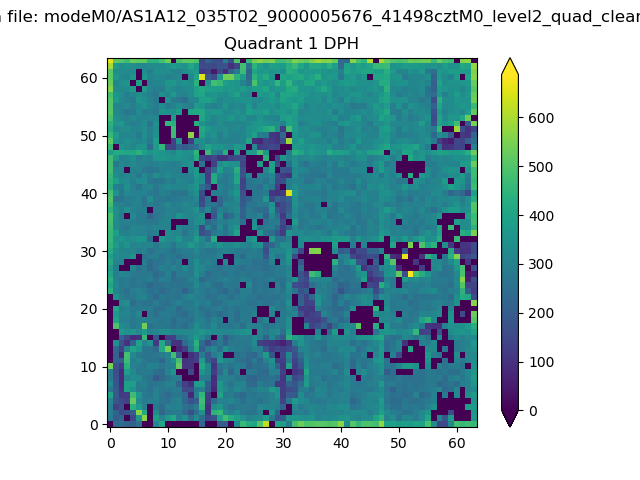 |
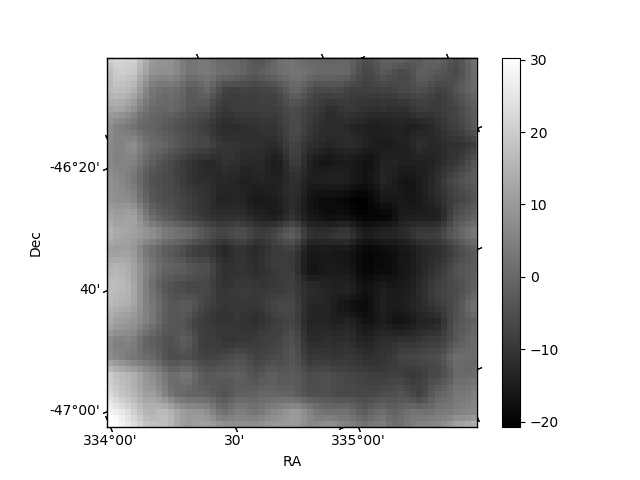
Quadrant B |
|---|---|---|---|
| Quadrant D | 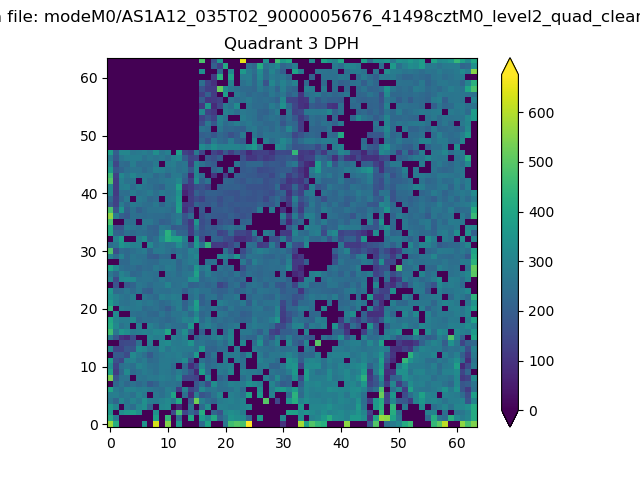 |
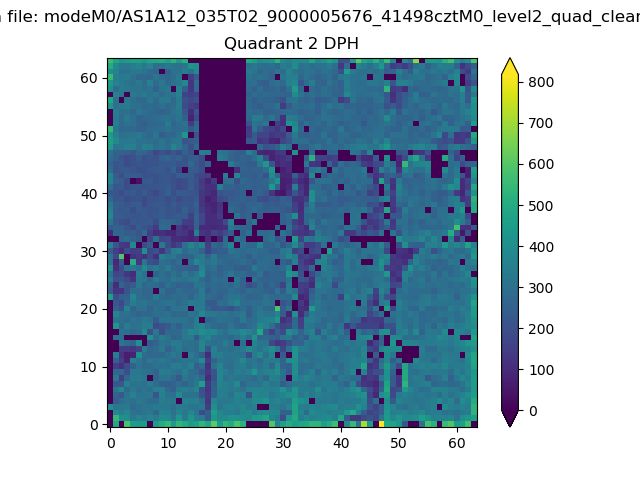 |
Quadrant C |
| Plot type | Count rate plots | Images |
|---|---|---|
| Comparison with Poisson distribution Blue bars denote a histogram of data divided into 1 sec bins. Red curve is a Poisson curve with rate = median count rate of data. |
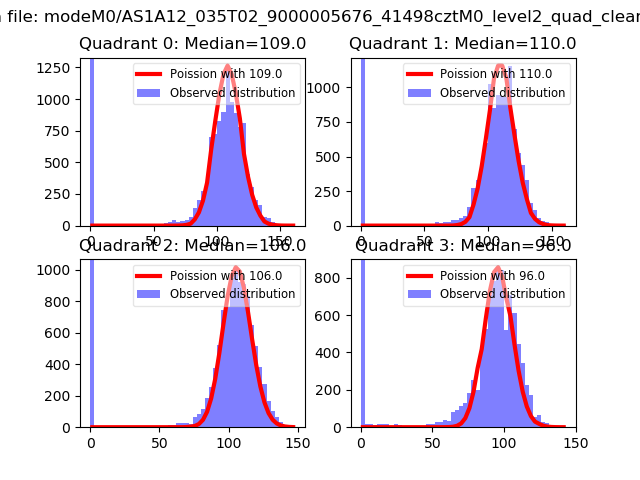 |
 |
| Quadrant-wise count rates Data is divided into 100 sec bins |
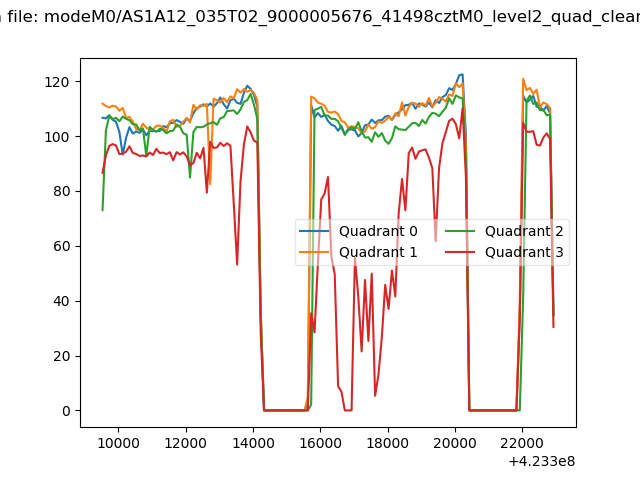 |
|
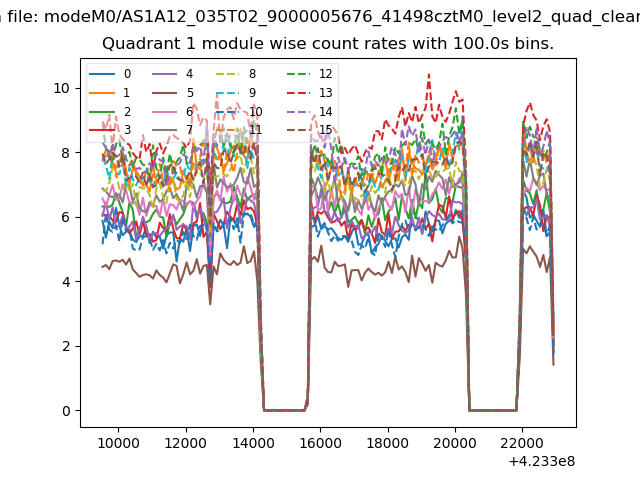
| Module-wise count rates for Quadrant A Data is divided into 100 sec bins |
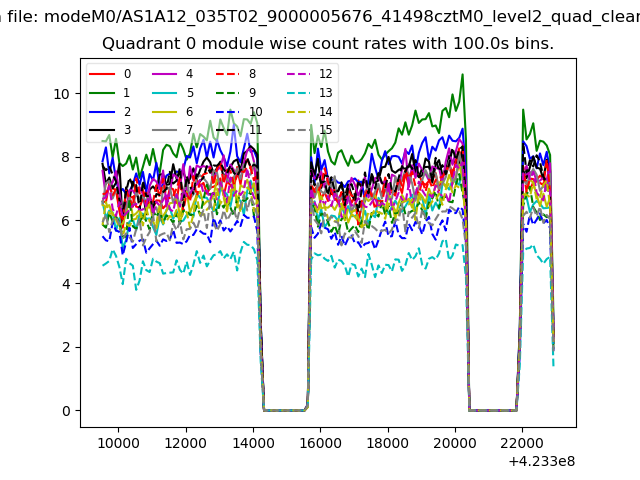 |
 |
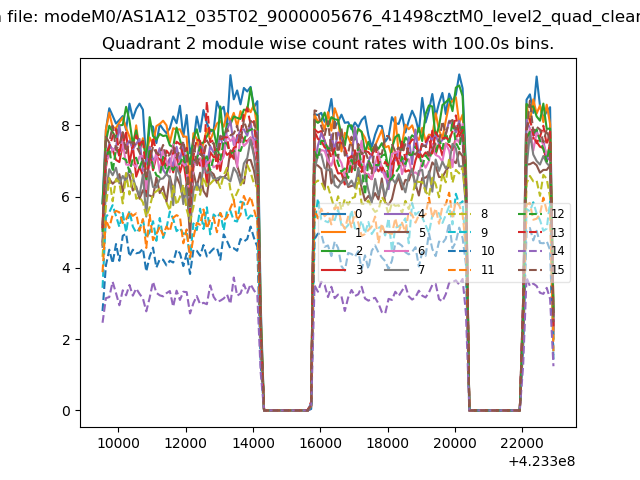
| Module-wise count rates for Quadrant B Data is divided into 100 sec bins |
 |
 |
| Module-wise count rates for Quadrant C Data is divided into 100 sec bins |
 |
 |
| Module-wise count rates for Quadrant D Data is divided into 100 sec bins |
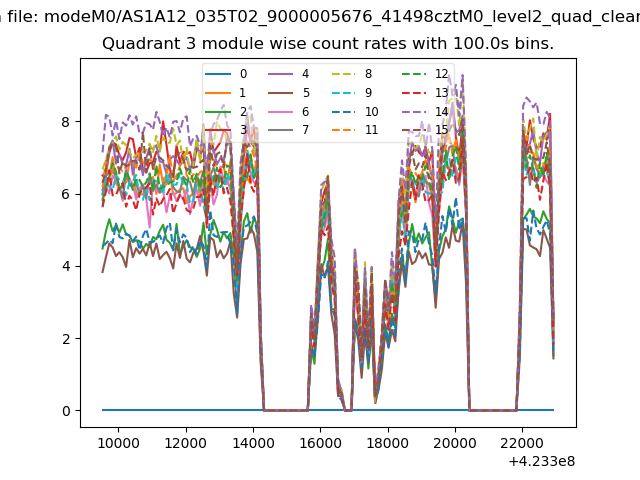 |
 |
| Parameter | Plot |
|---|---|
| CZT HV Monitor | 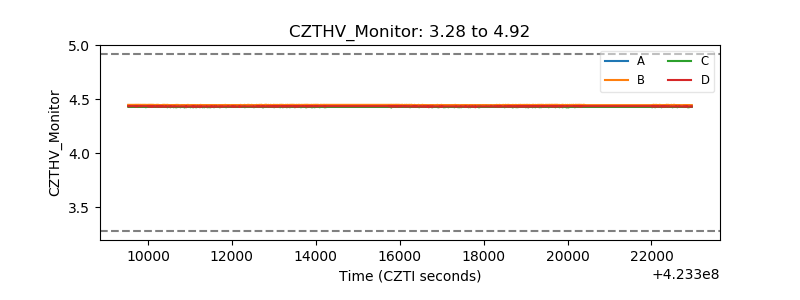 |
| D_VDD | 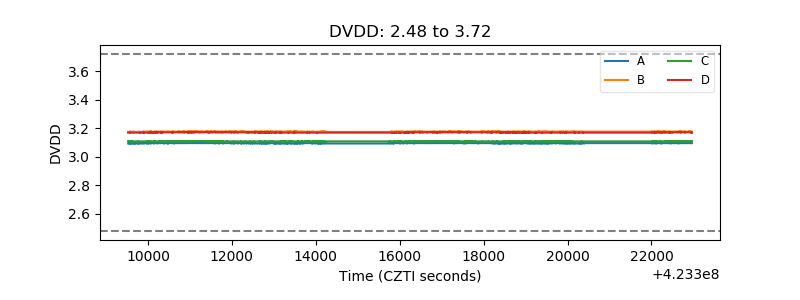 |
| Temperature 1 | 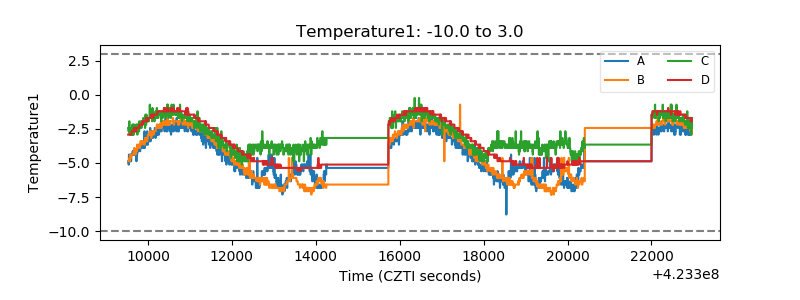 |
| Veto HV Monitor | 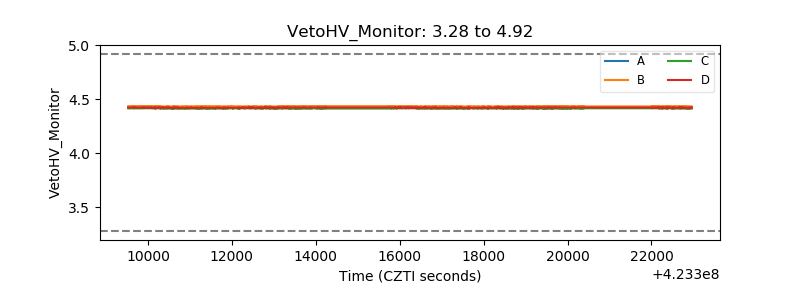 |
| Veto LLD | 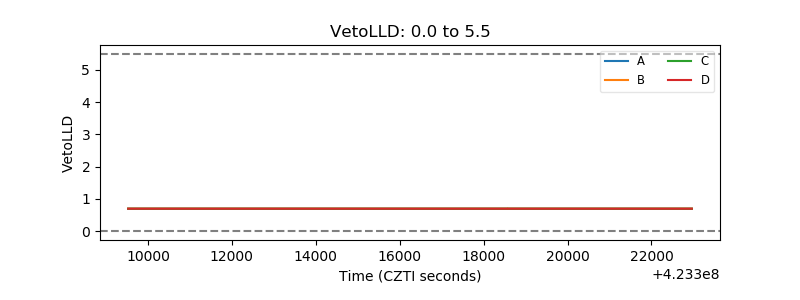 |
| Alpha Counter | 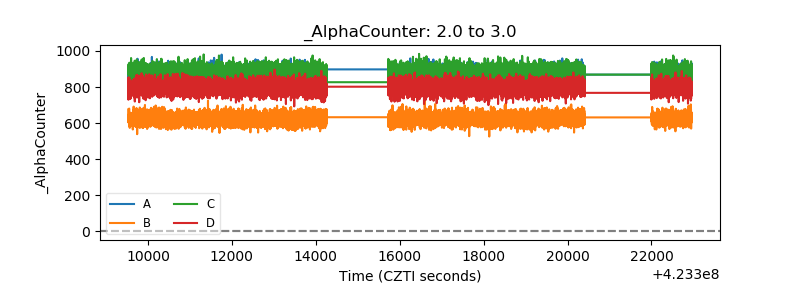 |
| _CPM_Rate | 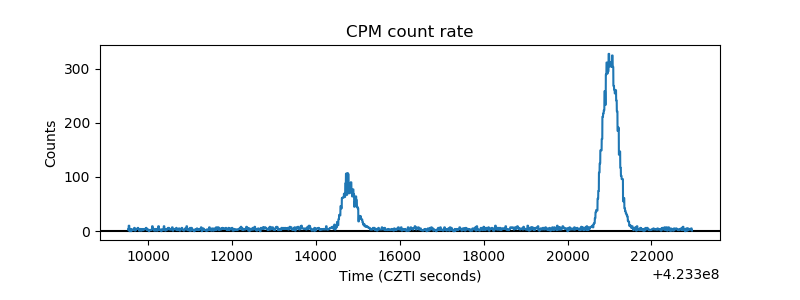 |
| CZT Counter | 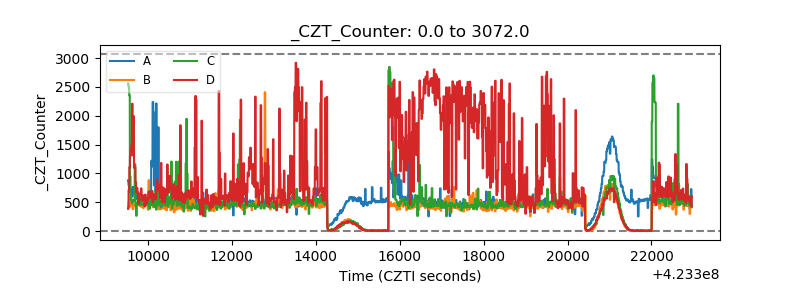 |
| +2.5 Volts monitor | 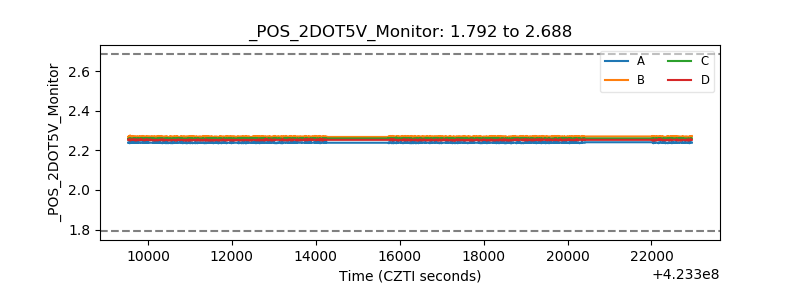 |
| +5 Volts monitor | 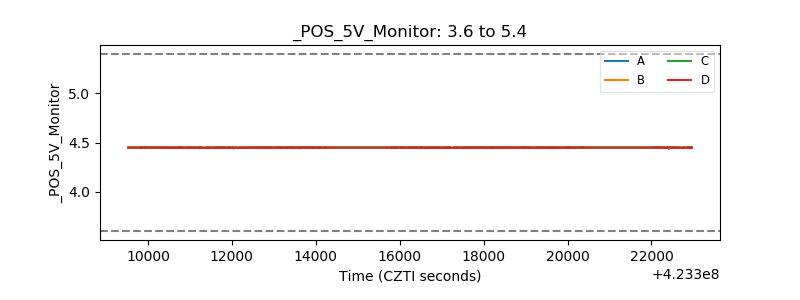 |
| _ROLL_ROT | 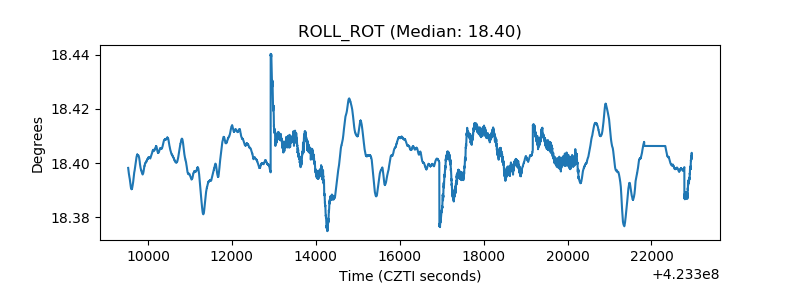 |
| _Roll_DEC | 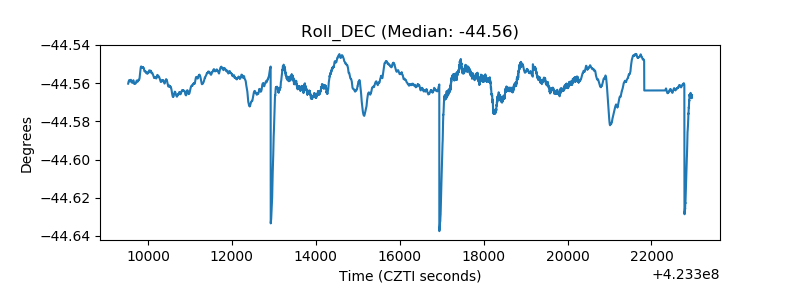 |
| _Roll_RA | 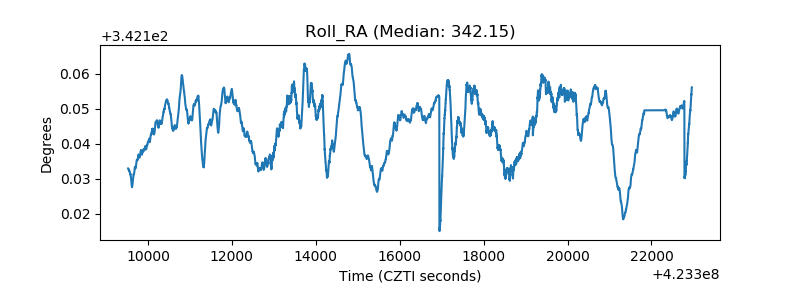 |
| Veto Counter | 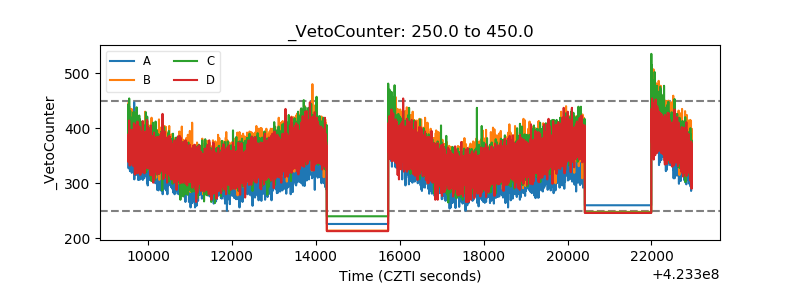 |