| Param | Original file | Final file |
|---|---|---|
| Filename | modeM0/AS1A12_035T02_9000005676_41499cztM0_level2.fits | modeM0/AS1A12_035T02_9000005676_41499cztM0_level2_quad_clean.evt |
| Size (bytes) | 378,941,760 | 89,910,720 |
| Size | 361.4 MB | 85.7 MB |
| Events in quadrant A | 2,973,741 | 631,876 |
| Events in quadrant B | 2,640,285 | 624,522 |
| Events in quadrant C | 3,306,095 | 569,441 |
| Events in quadrant D | 4,688,260 | 519,848 |
| Mode SS | |||
|---|---|---|---|
| Quadrant | BADHDUFLAG | Total packets | Discarded packets |
| A | 0 | 110 | 0 |
| B | 0 | 110 | 0 |
| C | 0 | 110 | 0 |
| D | 0 | 110 | 0 |
| Mode M0 | |||
|---|---|---|---|
| Quadrant | BADHDUFLAG | Total packets | Discarded packets |
| A | 0 | 12122 | 3 |
| B | 0 | 11447 | 2 |
| C | 0 | 13130 | 2 |
| D | 0 | 17507 | 2 |
| Mode M9 | |||
|---|---|---|---|
| Quadrant | BADHDUFLAG | Total packets | Discarded packets |
| A | 0 | 18 | 0 |
| B | 0 | 18 | 0 |
| C | 0 | 18 | 0 |
| D | 0 | 19 | 0 |
| Quadrant | Total seconds | Saturated seconds | Saturation percentage |
|---|---|---|---|
| A | 5381 | 20 | 0.371678% |
| B | 5381 | 17 | 0.315926% |
| C | 5381 | 234 | 4.348634% |
| D | 5381 | 605 | 11.243263% |
Noise dominated data is calculated using 1-second bins in cleaned event files. If a bin has >2000 counts, and if more than 50% of those come from <1% of pixels, then it is considered to be noise-dominated and hence unusable.
| Quadrant | # 1 sec bins | Bins with >0 counts | Bins with >2000 counts | High rate bins dominated by noise | Noise dominated (total time) | Noise dominated (detector-on time) | Marked lightcurve |
|---|---|---|---|---|---|---|---|
| A | 7084 | 5382 | 7 | 7 | 0.10% | 0.13% | 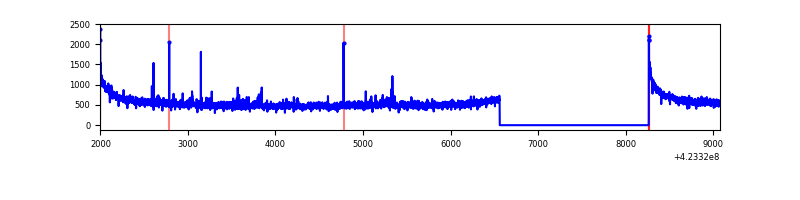 |
| B | 7084 | 5382 | 5 | 5 | 0.07% | 0.09% | 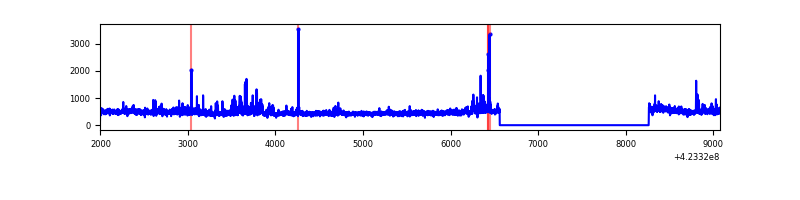 |
| C | 7084 | 5382 | 226 | 226 | 3.19% | 4.20% | 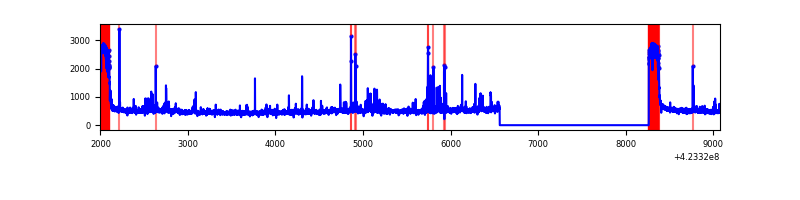 |
| D | 7084 | 5382 | 543 | 543 | 7.67% | 10.09% | 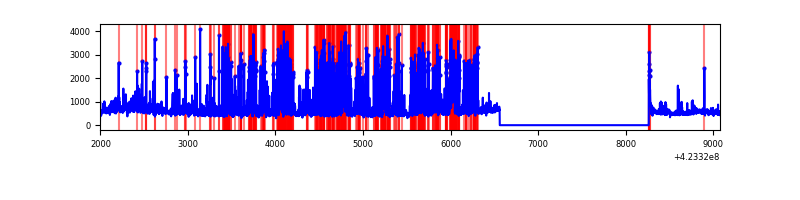 |
Top three noisy pixels from each quadrant. If the there are fewer than three noisy pixels in the level2.evt file, extra rows are filled as -1
| Pixel properties | Quadrant properties | ||||||
|---|---|---|---|---|---|---|---|
| Quadrant | DetID | PixID | Counts | Sigma | Mean | Median | Sigma |
| A | 10 | 83 | 540388 | 4268.89 | 607 | 594 | 126.4 |
| A | 2 | 79 | 73666 | 577.88 | 607 | 594 | 126.4 |
| A | 13 | 254 | 10942 | 81.84 | 607 | 594 | 126.4 |
| B | 0 | 190 | 181099 | 1564.29 | 597 | 581 | 115.4 |
| B | 0 | 245 | 41881 | 357.89 | 597 | 581 | 115.4 |
| B | 4 | 81 | 24474 | 207.05 | 597 | 581 | 115.4 |
| C | 0 | 10 | 595616 | 4493.27 | 565 | 568 | 132.4 |
| C | 15 | 214 | 222520 | 1675.98 | 565 | 568 | 132.4 |
| C | 9 | 54 | 134429 | 1010.8 | 565 | 568 | 132.4 |
| D | 12 | 16 | 1595944 | 11428.45 | 559 | 542 | 139.6 |
| D | 12 | 79 | 377150 | 2697.78 | 559 | 542 | 139.6 |
| D | 12 | 6 | 164054 | 1171.3 | 559 | 542 | 139.6 |
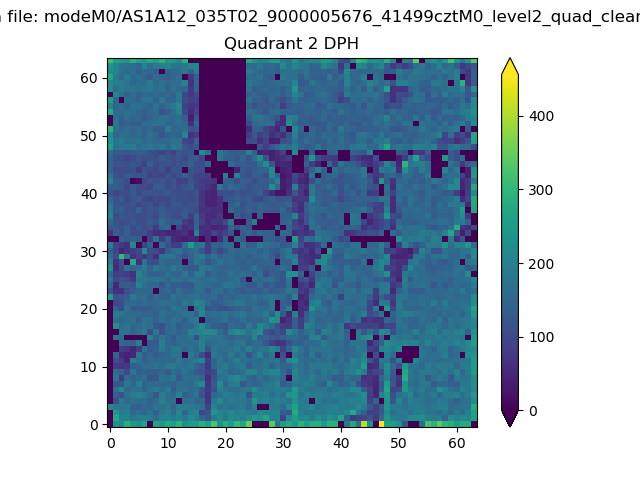
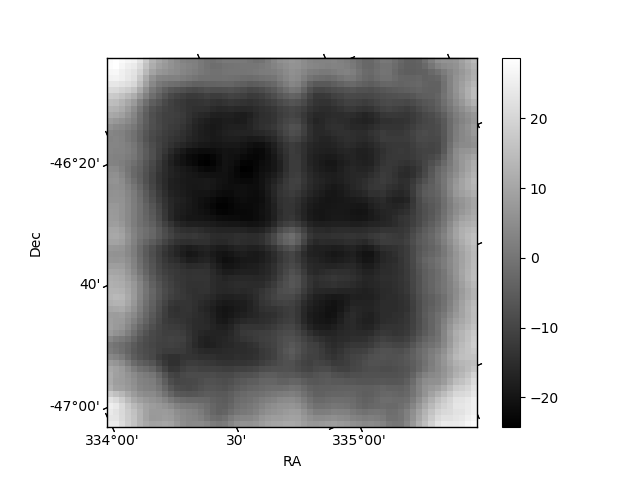
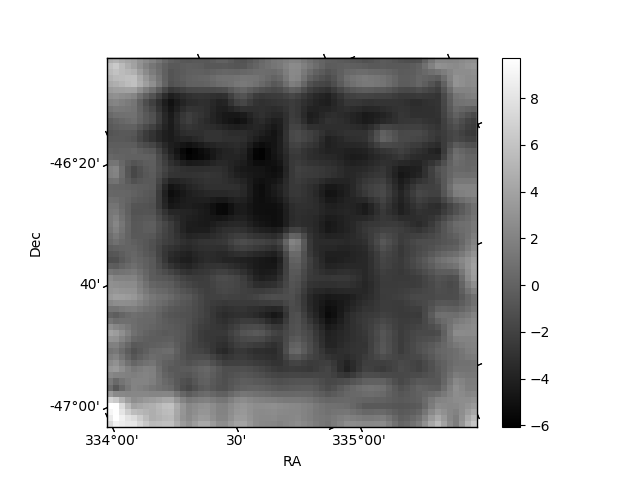
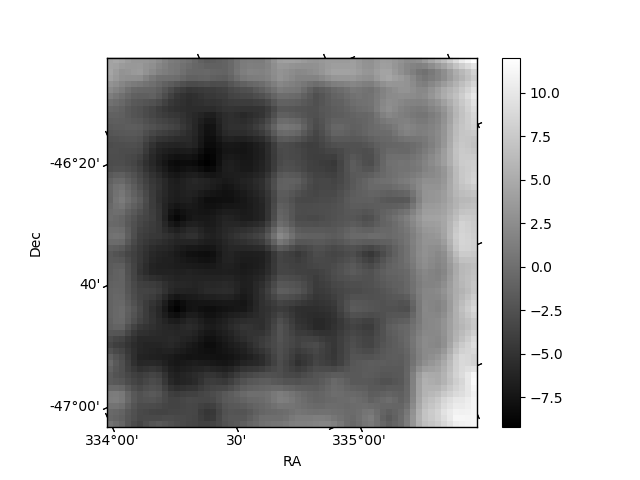
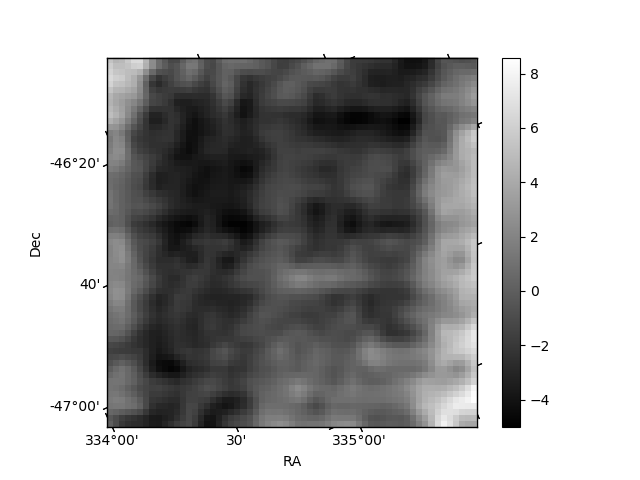
Histogram calculated using DETX and DETY for each event in the final _common_clean file
| Quadrant A | 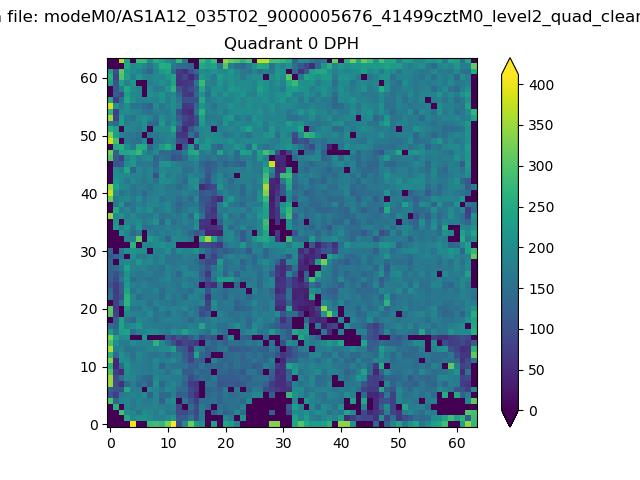 |
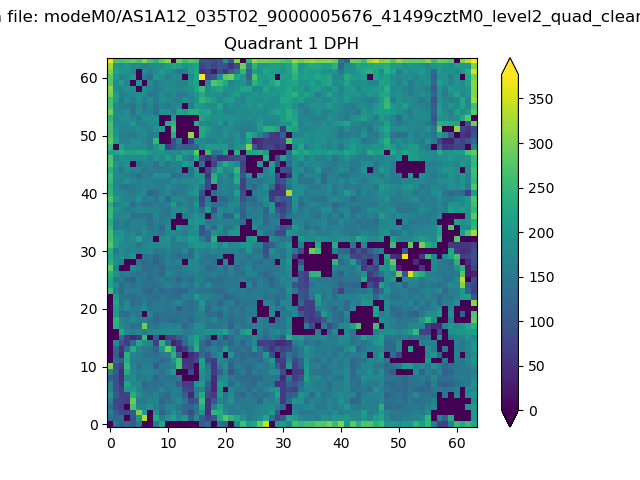 |
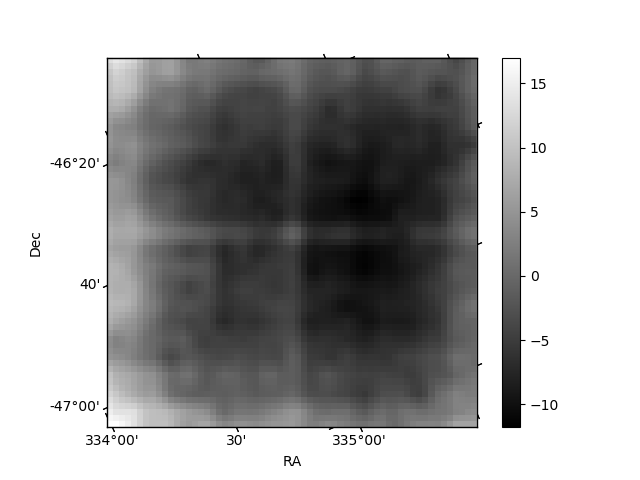
Quadrant B |
|---|---|---|---|
| Quadrant D | 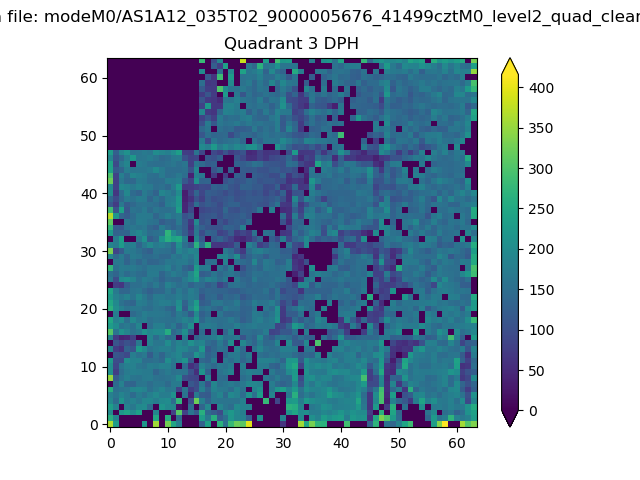 |
 |
Quadrant C |
| Plot type | Count rate plots | Images |
|---|---|---|
| Comparison with Poisson distribution Blue bars denote a histogram of data divided into 1 sec bins. Red curve is a Poisson curve with rate = median count rate of data. |
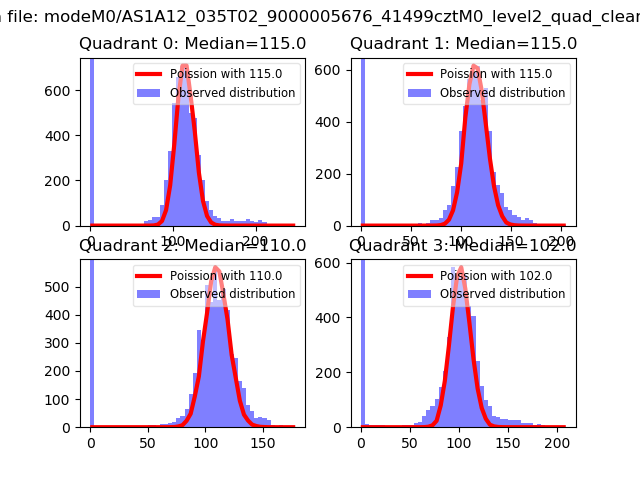 |
 |
| Quadrant-wise count rates Data is divided into 100 sec bins |
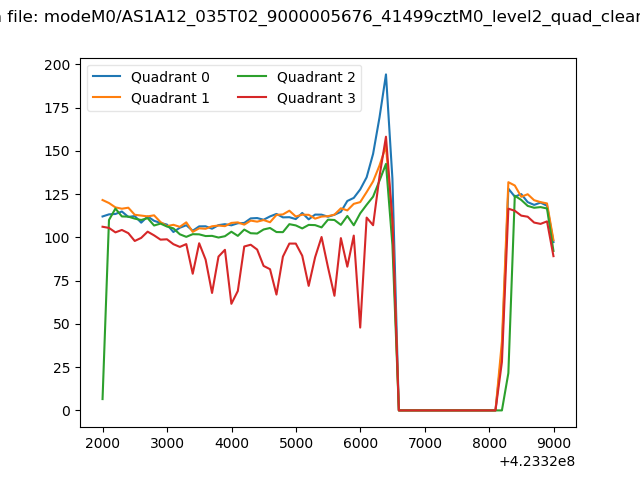 |
|
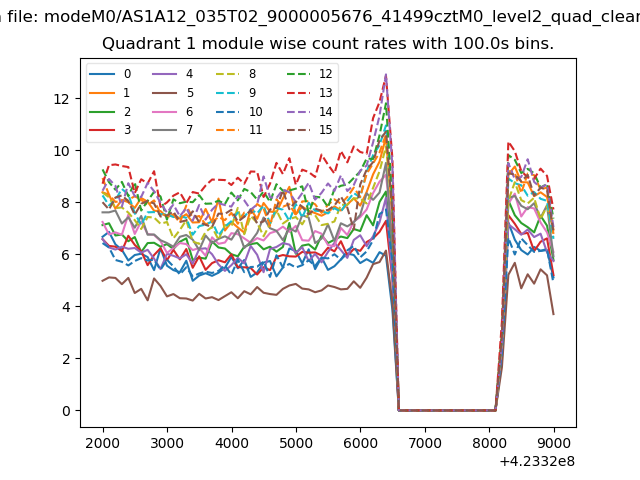
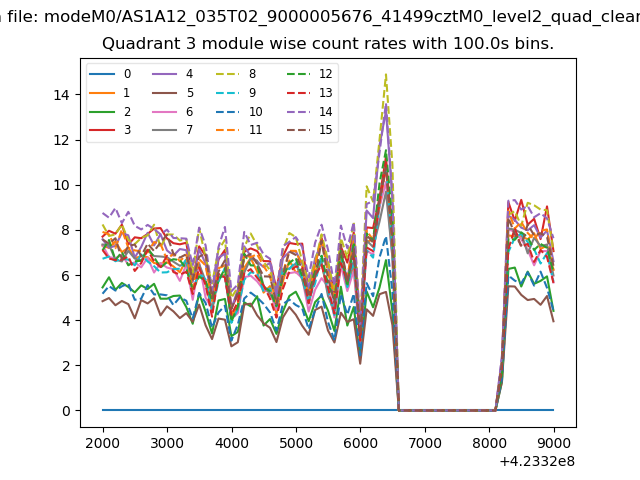
| Module-wise count rates for Quadrant A Data is divided into 100 sec bins |
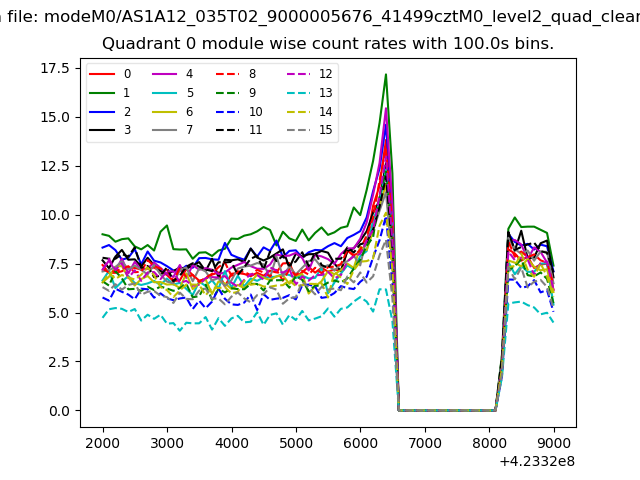 |
 |
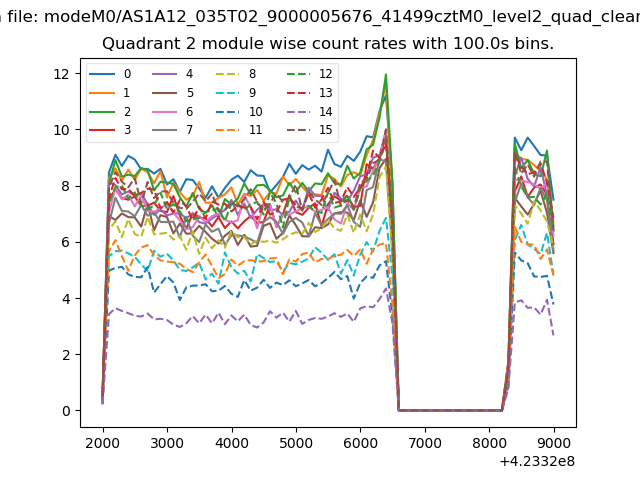
| Module-wise count rates for Quadrant B Data is divided into 100 sec bins |
 |
 |
| Module-wise count rates for Quadrant C Data is divided into 100 sec bins |
 |
 |
| Module-wise count rates for Quadrant D Data is divided into 100 sec bins |
 |
 |
| Parameter | Plot |
|---|---|
| CZT HV Monitor | 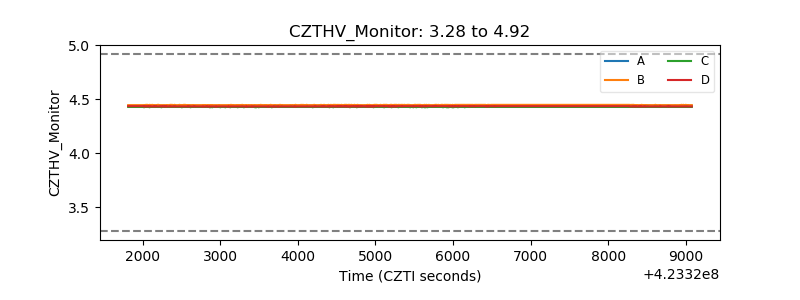 |
| D_VDD | 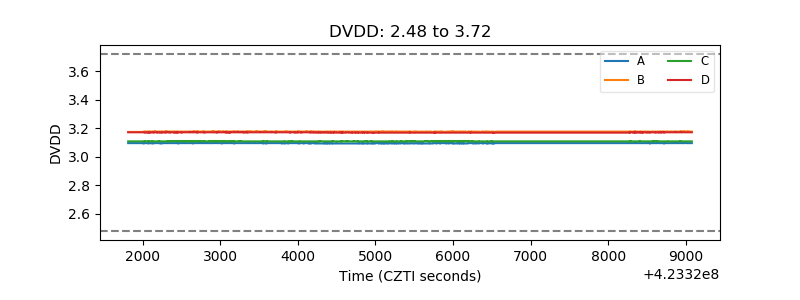 |
| Temperature 1 | 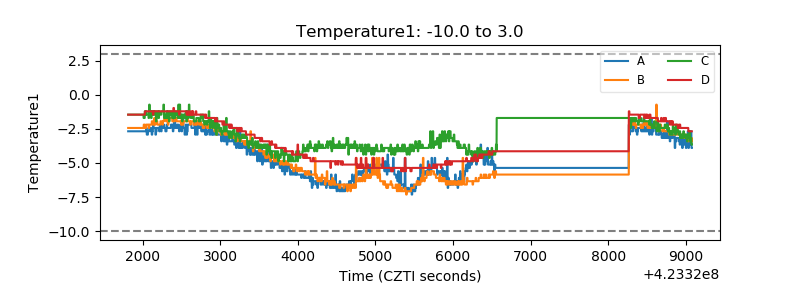 |
| Veto HV Monitor |  |
| Veto LLD | 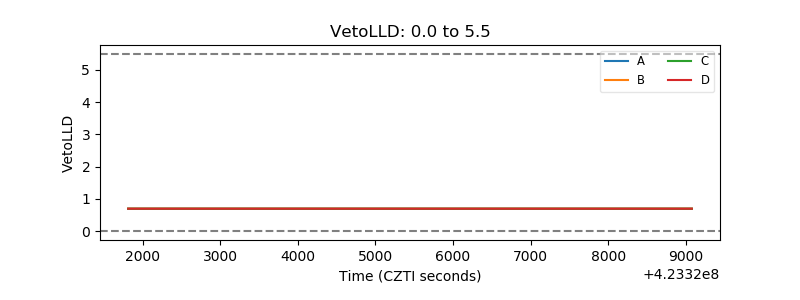 |
| Alpha Counter | 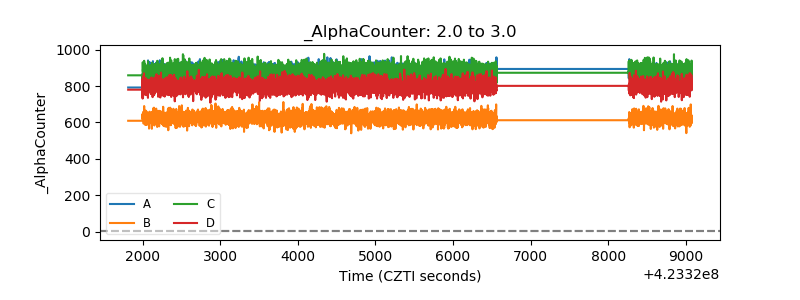 |
| _CPM_Rate | 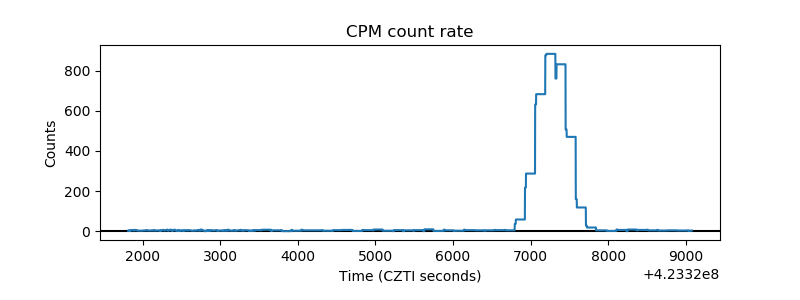 |
| CZT Counter | 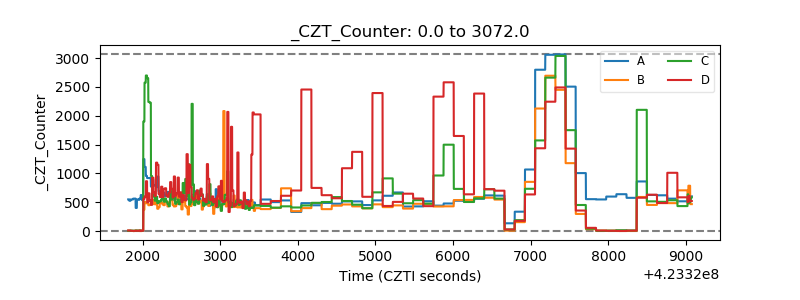 |
| +2.5 Volts monitor | 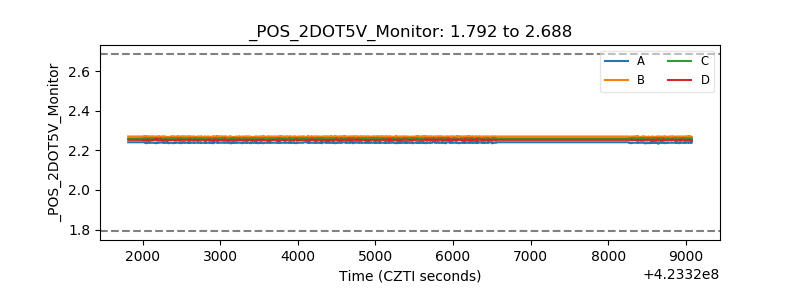 |
| +5 Volts monitor | 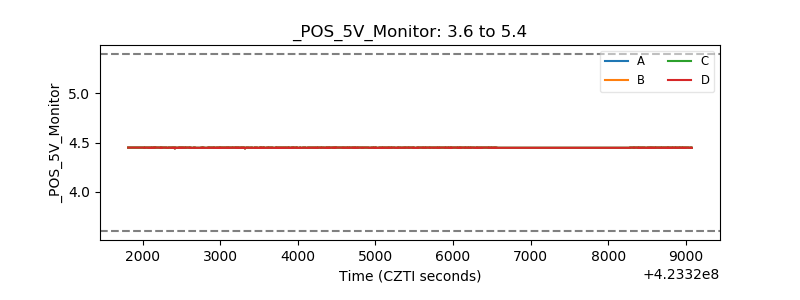 |
| _ROLL_ROT | 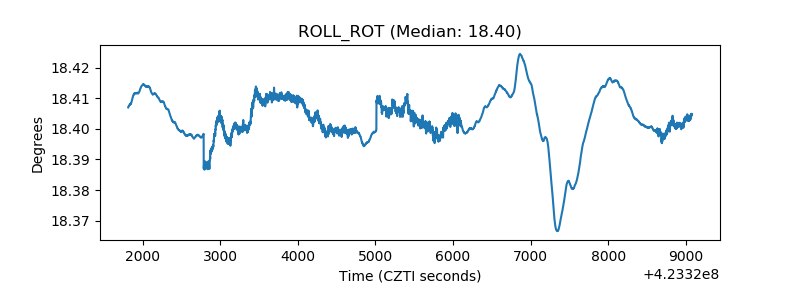 |
| _Roll_DEC | 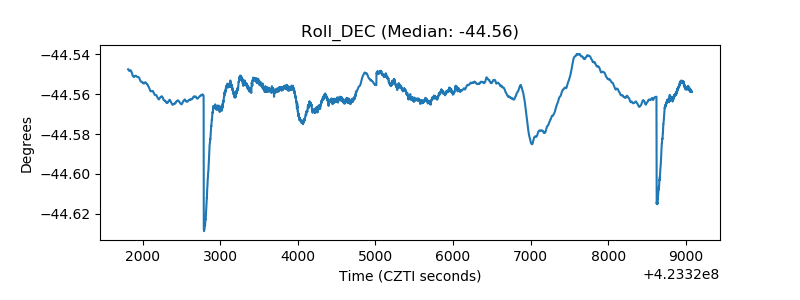 |
| _Roll_RA | 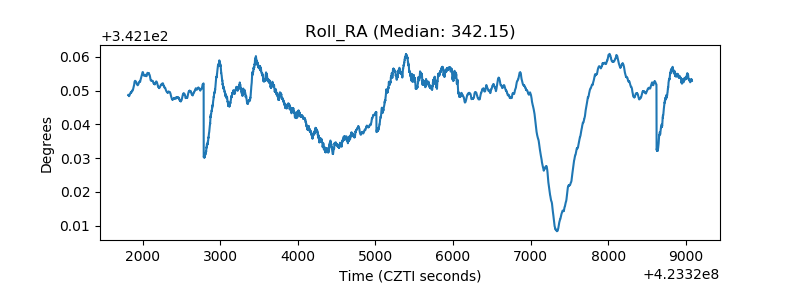 |
| Veto Counter | 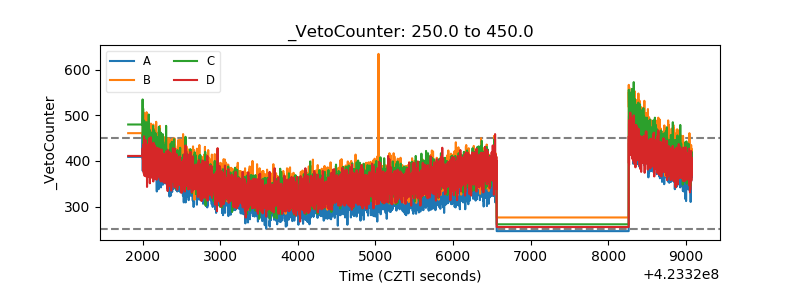 |