| Param | Original file | Final file |
|---|---|---|
| Filename | modeM0/AS1A12_035T02_9000005676_41501cztM0_level2.fits | modeM0/AS1A12_035T02_9000005676_41501cztM0_level2_quad_clean.evt |
| Size (bytes) | 347,431,680 | 90,322,560 |
| Size | 331.3 MB | 86.1 MB |
| Events in quadrant A | 2,899,443 | 624,379 |
| Events in quadrant B | 2,572,970 | 631,851 |
| Events in quadrant C | 3,803,502 | 557,205 |
| Events in quadrant D | 3,177,597 | 554,943 |
| Mode SS | |||
|---|---|---|---|
| Quadrant | BADHDUFLAG | Total packets | Discarded packets |
| A | 0 | 108 | 0 |
| B | 0 | 108 | 0 |
| C | 0 | 108 | 0 |
| D | 0 | 108 | 0 |
| Mode M0 | |||
|---|---|---|---|
| Quadrant | BADHDUFLAG | Total packets | Discarded packets |
| A | 0 | 11796 | 3 |
| B | 0 | 11187 | 2 |
| C | 0 | 14593 | 2 |
| D | 0 | 12750 | 2 |
| Mode M9 | |||
|---|---|---|---|
| Quadrant | BADHDUFLAG | Total packets | Discarded packets |
| A | 0 | 21 | 0 |
| B | 0 | 21 | 0 |
| C | 0 | 21 | 0 |
| D | 0 | 22 | 0 |
| Quadrant | Total seconds | Saturated seconds | Saturation percentage |
|---|---|---|---|
| A | 5231 | 15 | 0.286752% |
| B | 5231 | 16 | 0.305869% |
| C | 5231 | 350 | 6.690881% |
| D | 5231 | 84 | 1.605812% |
Noise dominated data is calculated using 1-second bins in cleaned event files. If a bin has >2000 counts, and if more than 50% of those come from <1% of pixels, then it is considered to be noise-dominated and hence unusable.
| Quadrant | # 1 sec bins | Bins with >0 counts | Bins with >2000 counts | High rate bins dominated by noise | Noise dominated (total time) | Noise dominated (detector-on time) | Marked lightcurve |
|---|---|---|---|---|---|---|---|
| A | 7053 | 5232 | 6 | 6 | 0.09% | 0.11% | 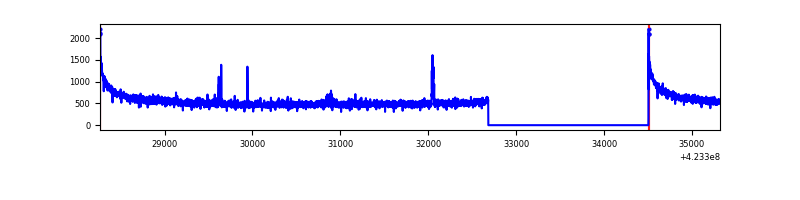 |
| B | 7053 | 5232 | 4 | 4 | 0.06% | 0.08% | 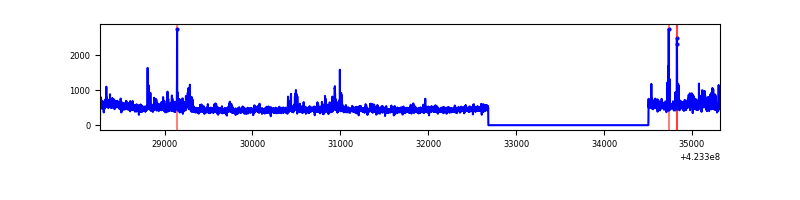 |
| C | 7053 | 5232 | 328 | 328 | 4.65% | 6.27% | 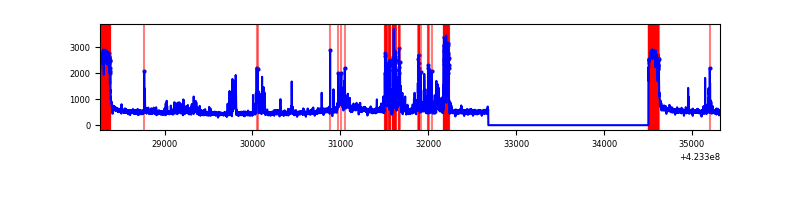 |
| D | 7053 | 5232 | 73 | 73 | 1.04% | 1.40% | 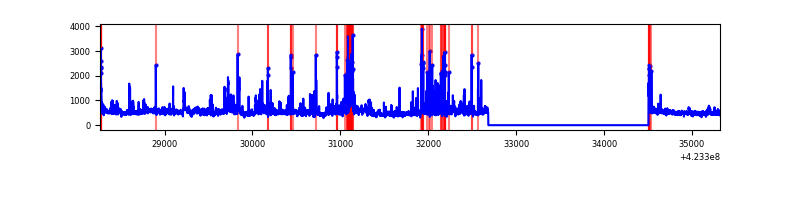 |
Top three noisy pixels from each quadrant. If the there are fewer than three noisy pixels in the level2.evt file, extra rows are filled as -1
| Pixel properties | Quadrant properties | ||||||
|---|---|---|---|---|---|---|---|
| Quadrant | DetID | PixID | Counts | Sigma | Mean | Median | Sigma |
| A | 10 | 83 | 530268 | 4330.3 | 597 | 585 | 122.3 |
| A | 2 | 79 | 33037 | 265.3 | 597 | 585 | 122.3 |
| A | 9 | 254 | 15950 | 125.61 | 597 | 585 | 122.3 |
| B | 0 | 190 | 165236 | 1460.36 | 592 | 576 | 112.8 |
| B | 0 | 245 | 51411 | 450.85 | 592 | 576 | 112.8 |
| B | 4 | 141 | 15830 | 135.29 | 592 | 576 | 112.8 |
| C | 0 | 10 | 623745 | 4886.68 | 552 | 555 | 127.5 |
| C | 3 | 233 | 440751 | 3451.75 | 552 | 555 | 127.5 |
| C | 15 | 214 | 215719 | 1687.19 | 552 | 555 | 127.5 |
| D | 12 | 79 | 422149 | 3001.46 | 574 | 558 | 140.5 |
| D | 12 | 6 | 175208 | 1243.4 | 574 | 558 | 140.5 |
| D | 12 | 128 | 88738 | 627.79 | 574 | 558 | 140.5 |
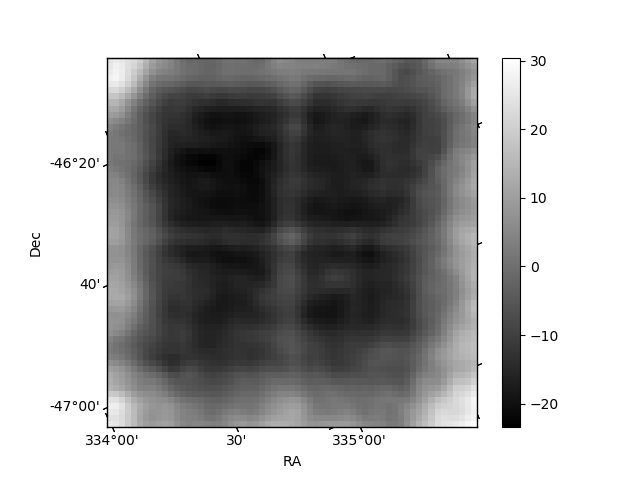
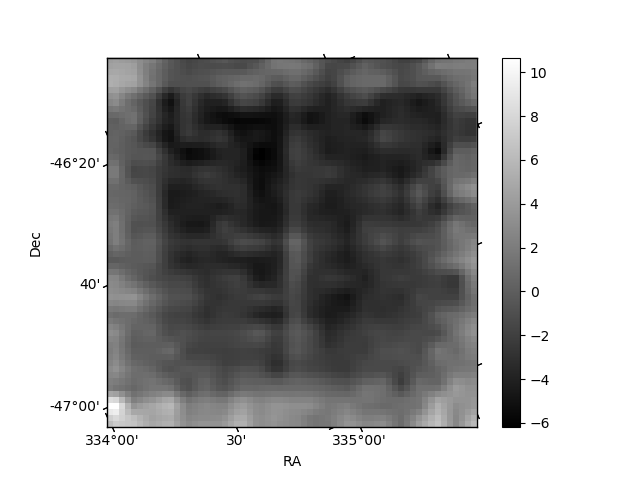
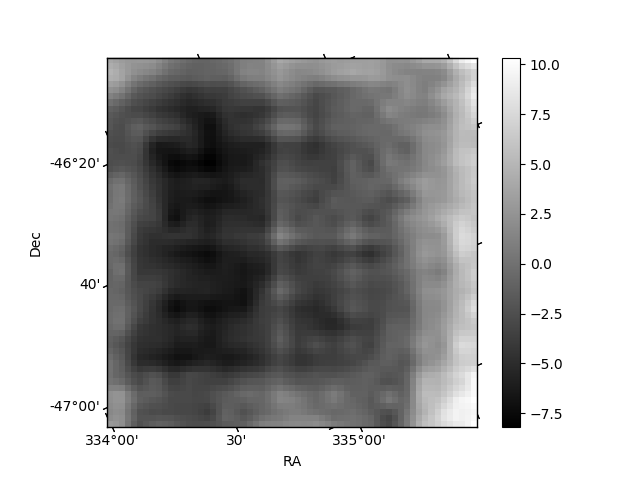
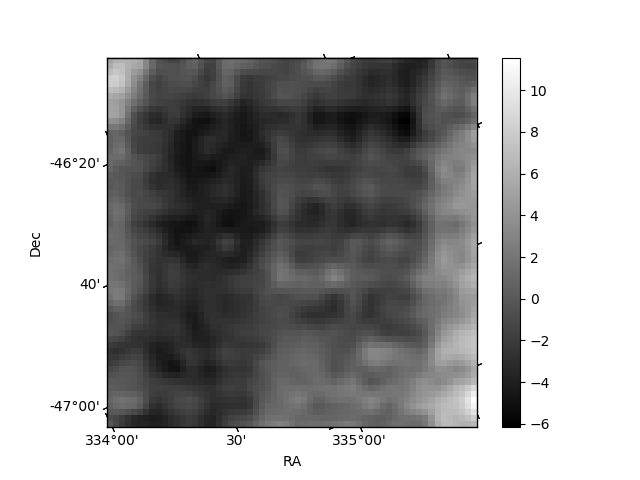
Histogram calculated using DETX and DETY for each event in the final _common_clean file
| Quadrant A | 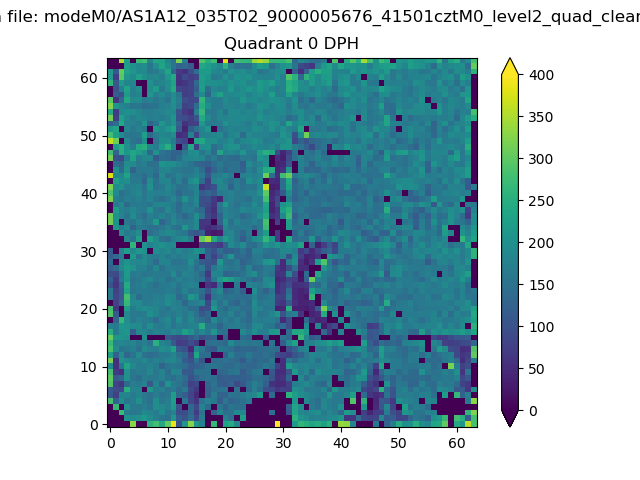 |
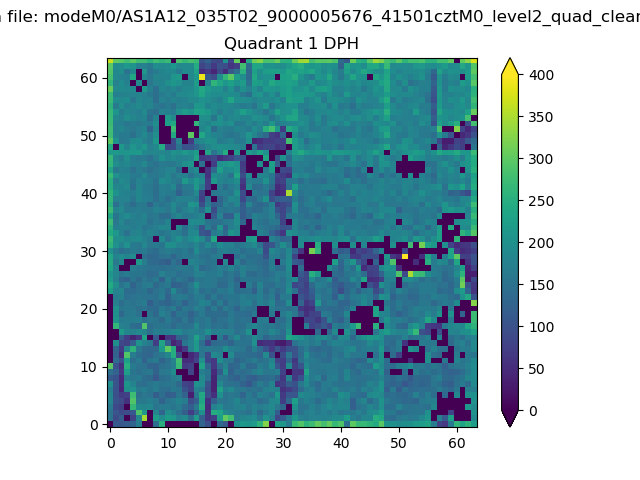 |
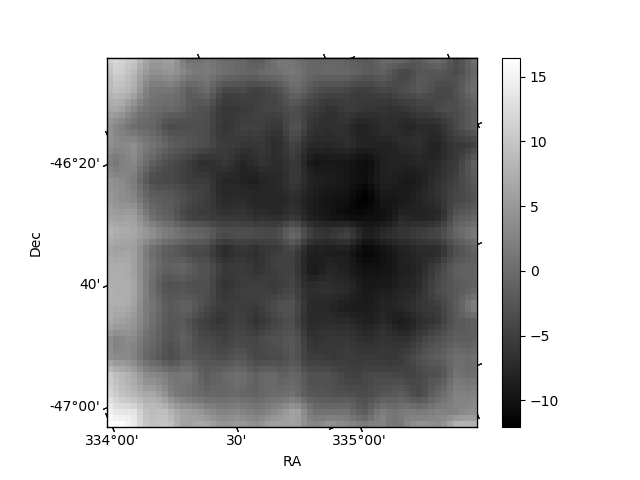
Quadrant B |
|---|---|---|---|
| Quadrant D | 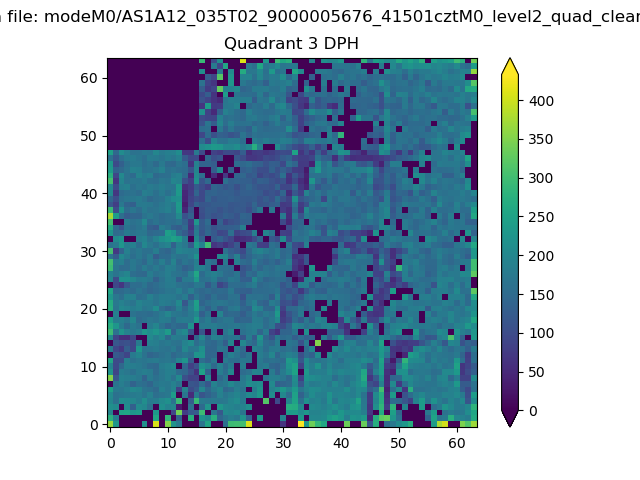 |
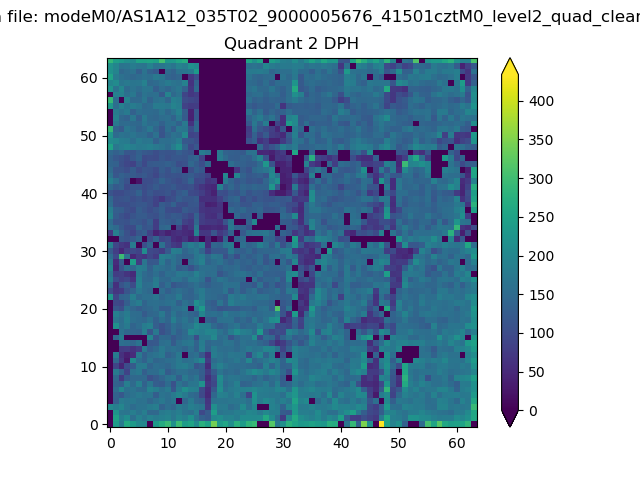 |
Quadrant C |
| Plot type | Count rate plots | Images |
|---|---|---|
| Comparison with Poisson distribution Blue bars denote a histogram of data divided into 1 sec bins. Red curve is a Poisson curve with rate = median count rate of data. |
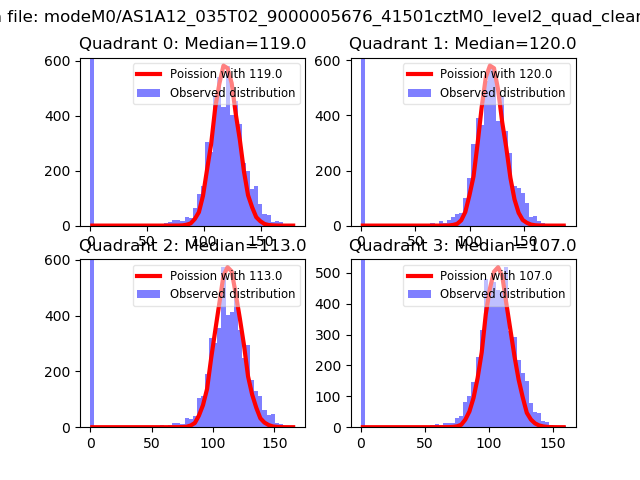 |
 |
| Quadrant-wise count rates Data is divided into 100 sec bins |
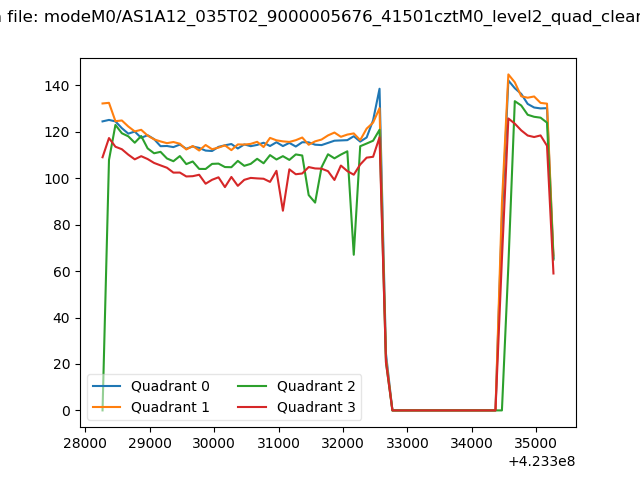 |
|
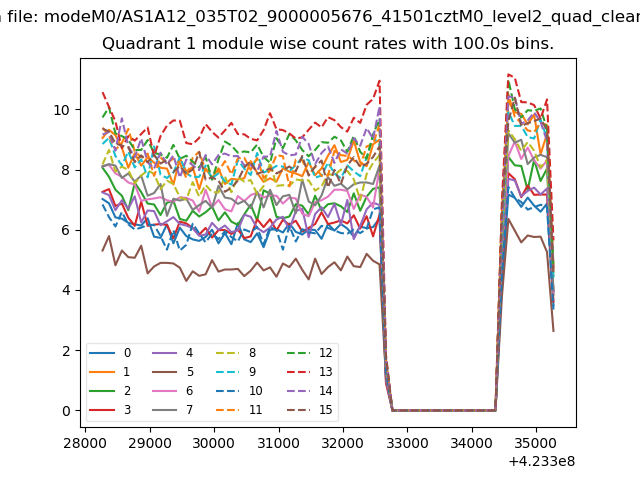
| Module-wise count rates for Quadrant A Data is divided into 100 sec bins |
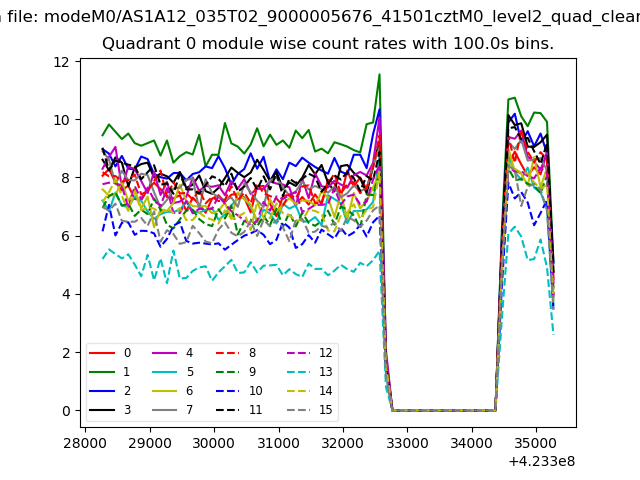 |
 |
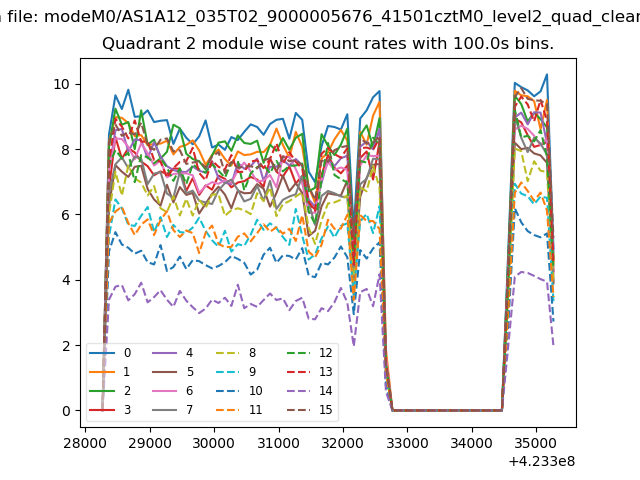
| Module-wise count rates for Quadrant B Data is divided into 100 sec bins |
 |
 |
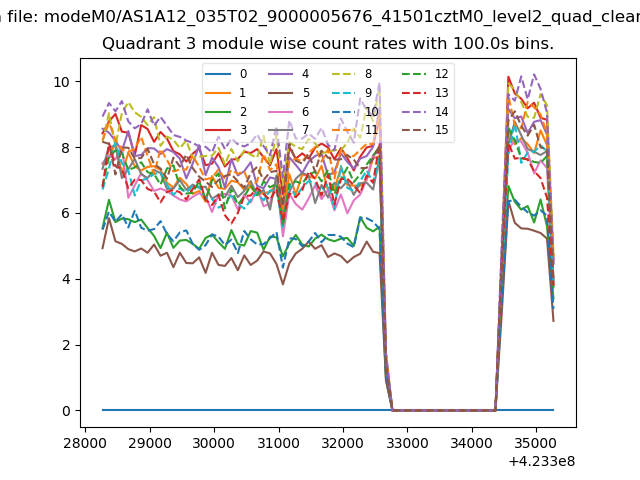
| Module-wise count rates for Quadrant C Data is divided into 100 sec bins |
 |
 |
| Module-wise count rates for Quadrant D Data is divided into 100 sec bins |
 |
 |
| Parameter | Plot |
|---|---|
| CZT HV Monitor | 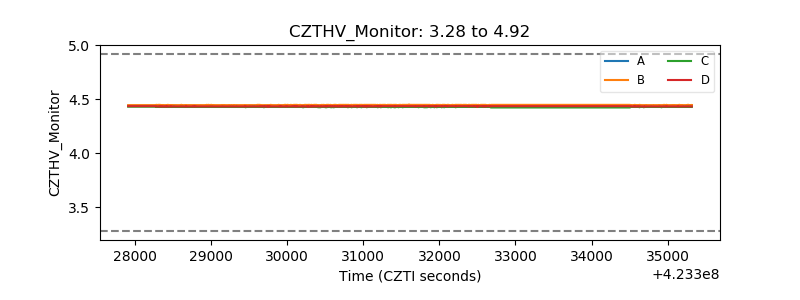 |
| D_VDD | 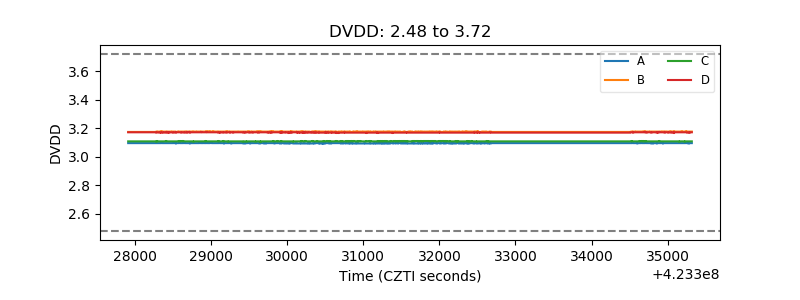 |
| Temperature 1 | 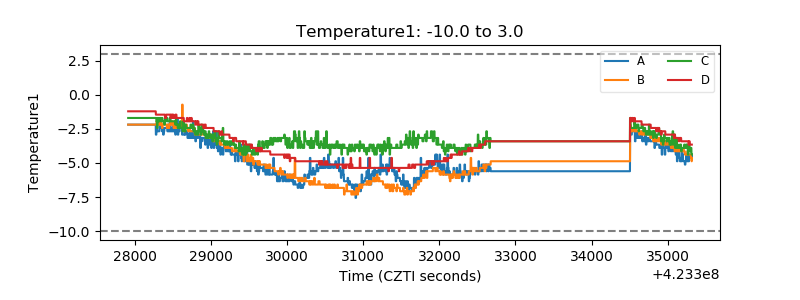 |
| Veto HV Monitor |  |
| Veto LLD | 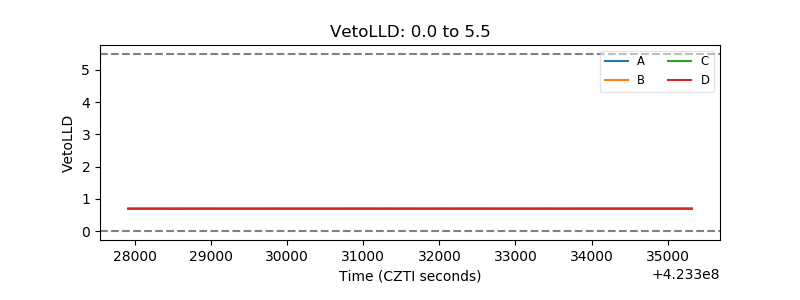 |
| Alpha Counter | 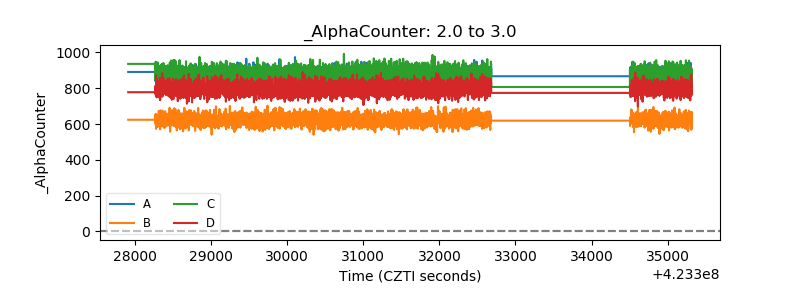 |
| _CPM_Rate | 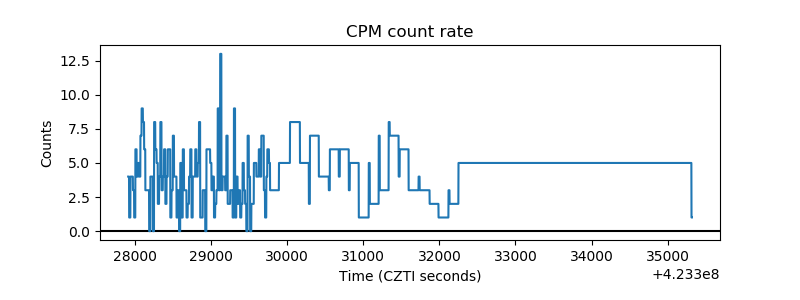 |
| CZT Counter | 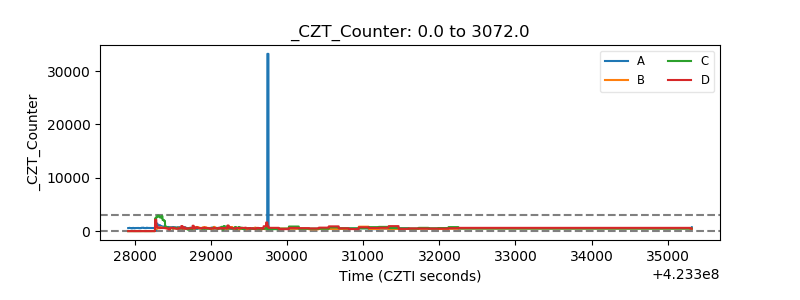 |
| +2.5 Volts monitor | 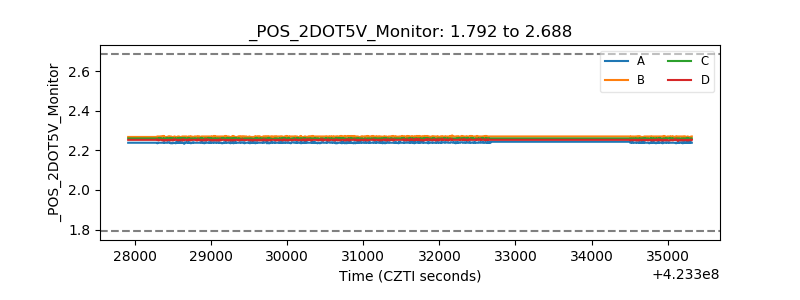 |
| +5 Volts monitor | 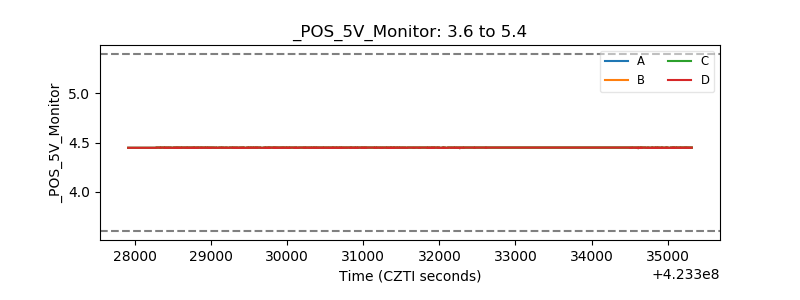 |
| _ROLL_ROT | 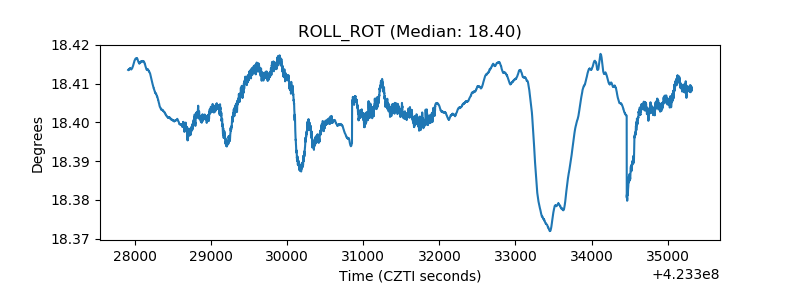 |
| _Roll_DEC | 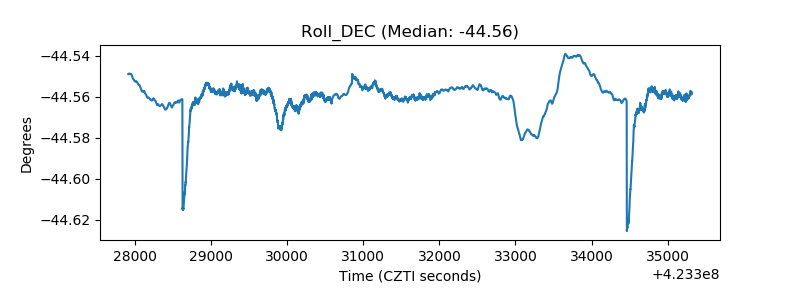 |
| _Roll_RA | 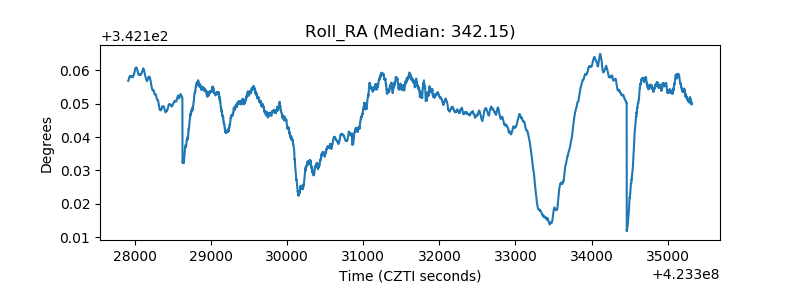 |
| Veto Counter | 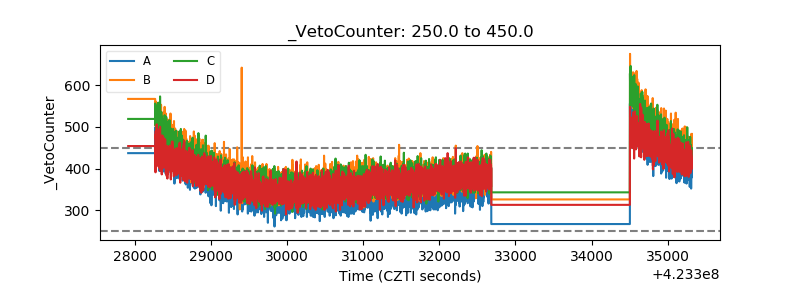 |