| Param | Original file | Final file |
|---|---|---|
| Filename | modeM0/AS1A12_035T02_9000005676_41502cztM0_level2.fits | modeM0/AS1A12_035T02_9000005676_41502cztM0_level2_quad_clean.evt |
| Size (bytes) | 328,363,200 | 93,597,120 |
| Size | 313.2 MB | 89.3 MB |
| Events in quadrant A | 2,891,914 | 650,115 |
| Events in quadrant B | 2,604,127 | 662,397 |
| Events in quadrant C | 3,262,103 | 589,596 |
| Events in quadrant D | 2,993,214 | 568,960 |
| Mode SS | |||
|---|---|---|---|
| Quadrant | BADHDUFLAG | Total packets | Discarded packets |
| A | 0 | 108 | 0 |
| B | 0 | 108 | 0 |
| C | 0 | 108 | 0 |
| D | 0 | 108 | 0 |
| Mode M0 | |||
|---|---|---|---|
| Quadrant | BADHDUFLAG | Total packets | Discarded packets |
| A | 0 | 11707 | 3 |
| B | 0 | 11138 | 2 |
| C | 0 | 12674 | 2 |
| D | 0 | 12315 | 2 |
| Mode M9 | |||
|---|---|---|---|
| Quadrant | BADHDUFLAG | Total packets | Discarded packets |
| A | 0 | 30 | 0 |
| B | 0 | 30 | 0 |
| C | 0 | 30 | 0 |
| D | 0 | 31 | 0 |
| Quadrant | Total seconds | Saturated seconds | Saturation percentage |
|---|---|---|---|
| A | 5180 | 16 | 0.308880% |
| B | 5180 | 16 | 0.308880% |
| C | 5180 | 243 | 4.691120% |
| D | 5180 | 122 | 2.355212% |
Noise dominated data is calculated using 1-second bins in cleaned event files. If a bin has >2000 counts, and if more than 50% of those come from <1% of pixels, then it is considered to be noise-dominated and hence unusable.
| Quadrant | # 1 sec bins | Bins with >0 counts | Bins with >2000 counts | High rate bins dominated by noise | Noise dominated (total time) | Noise dominated (detector-on time) | Marked lightcurve |
|---|---|---|---|---|---|---|---|
| A | 7123 | 5181 | 5 | 5 | 0.07% | 0.10% | 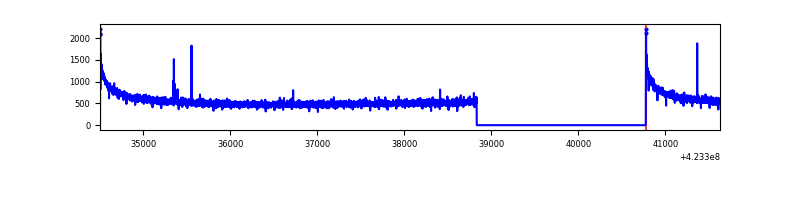 |
| B | 7123 | 5181 | 4 | 4 | 0.06% | 0.08% | 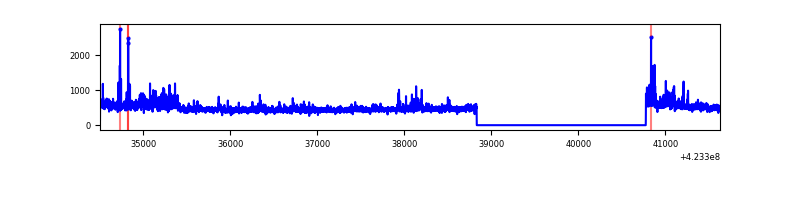 |
| C | 7123 | 5181 | 235 | 235 | 3.30% | 4.54% | 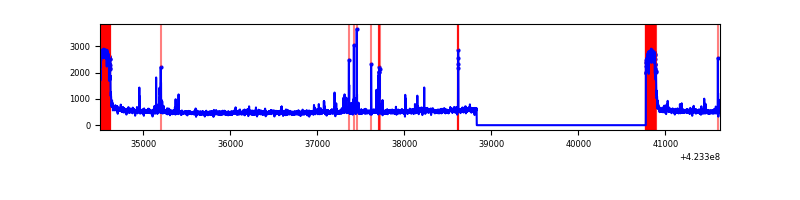 |
| D | 7123 | 5181 | 107 | 107 | 1.50% | 2.07% | 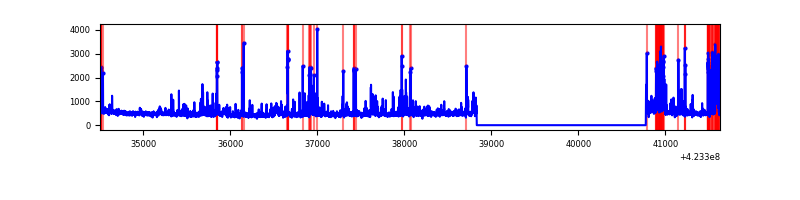 |
Top three noisy pixels from each quadrant. If the there are fewer than three noisy pixels in the level2.evt file, extra rows are filled as -1
| Pixel properties | Quadrant properties | ||||||
|---|---|---|---|---|---|---|---|
| Quadrant | DetID | PixID | Counts | Sigma | Mean | Median | Sigma |
| A | 10 | 83 | 516844 | 4127.95 | 608 | 597 | 125.1 |
| A | 13 | 248 | 11795 | 89.54 | 608 | 597 | 125.1 |
| A | 13 | 254 | 10509 | 79.26 | 608 | 597 | 125.1 |
| B | 0 | 190 | 160352 | 1391.3 | 604 | 589 | 114.8 |
| B | 0 | 245 | 47429 | 407.91 | 604 | 589 | 114.8 |
| B | 4 | 141 | 15786 | 132.34 | 604 | 589 | 114.8 |
| C | 0 | 10 | 641384 | 4863.95 | 568 | 573 | 131.7 |
| C | 15 | 214 | 215854 | 1634.05 | 568 | 573 | 131.7 |
| C | 4 | 254 | 62968 | 473.6 | 568 | 573 | 131.7 |
| D | 12 | 16 | 165640 | 1166.81 | 583 | 569 | 141.5 |
| D | 12 | 128 | 148823 | 1047.94 | 583 | 569 | 141.5 |
| D | 1 | 47 | 91795 | 644.84 | 583 | 569 | 141.5 |
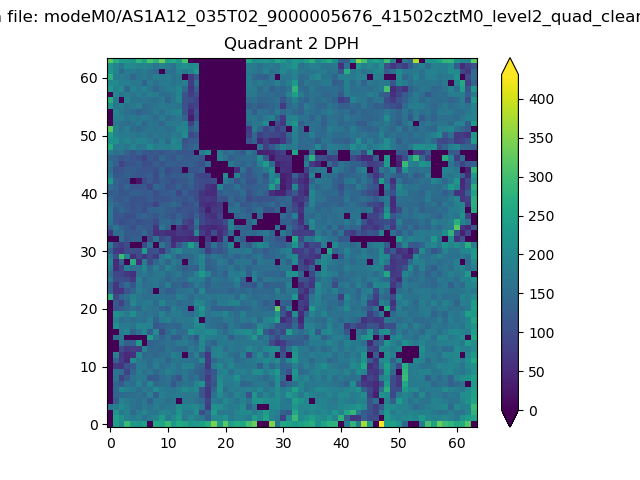
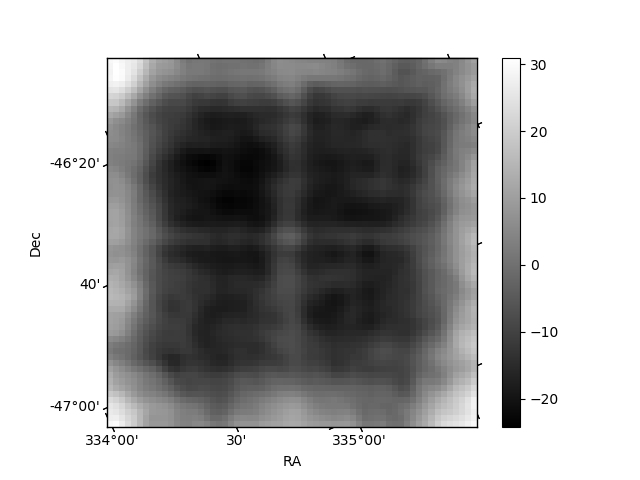
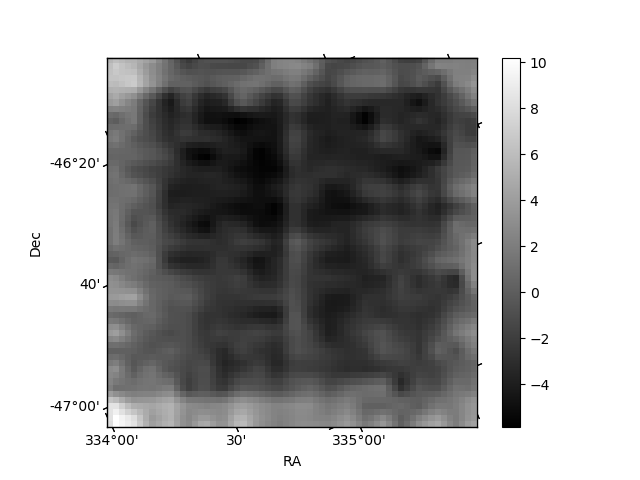
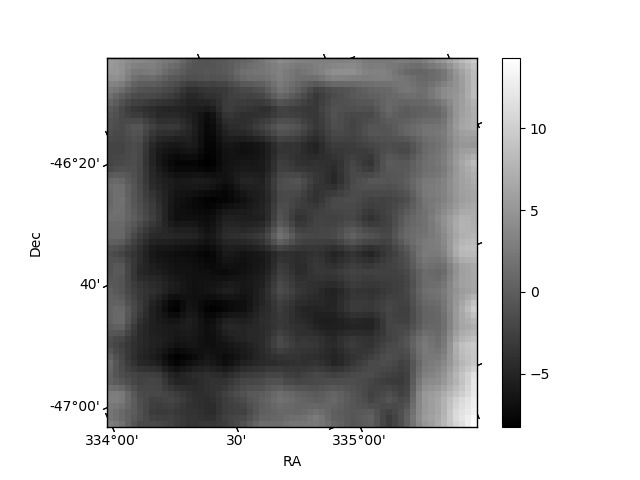
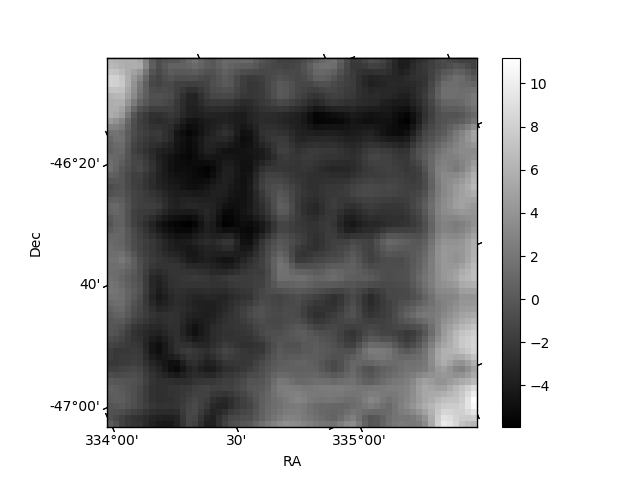
Histogram calculated using DETX and DETY for each event in the final _common_clean file
| Quadrant A | 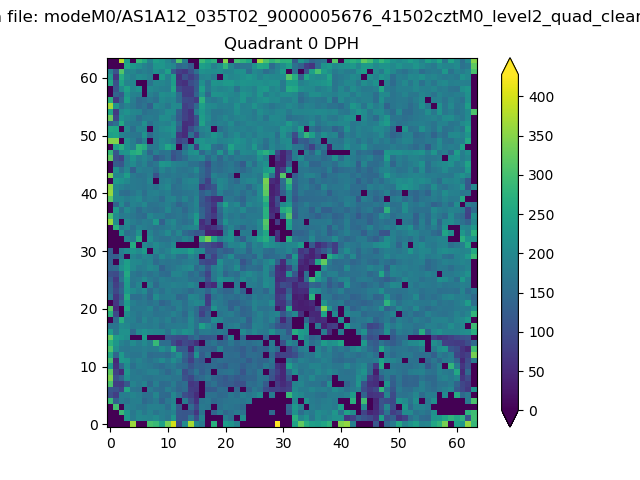 |
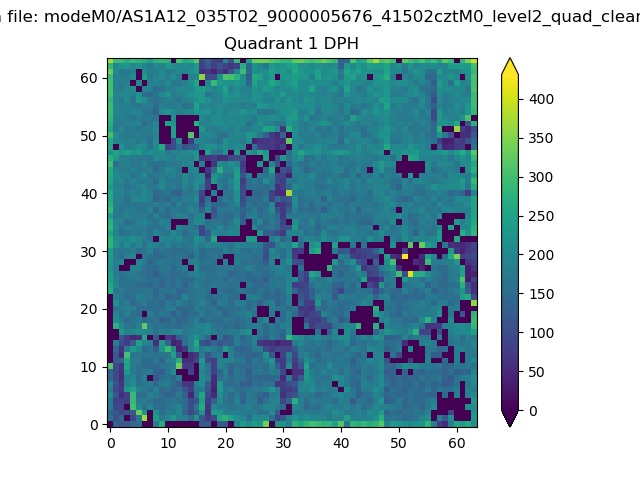 |
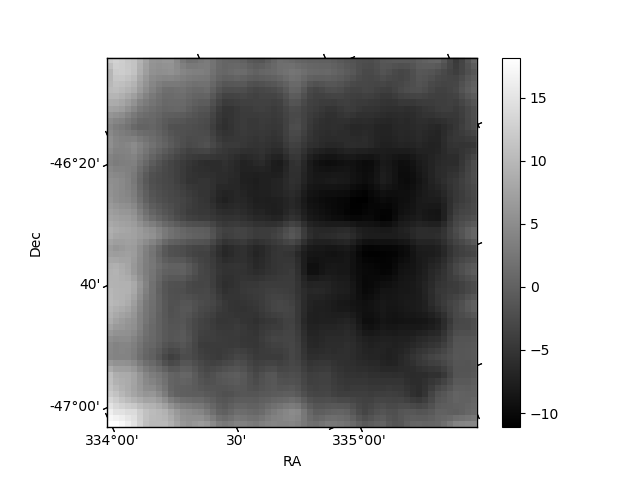
Quadrant B |
|---|---|---|---|
| Quadrant D | 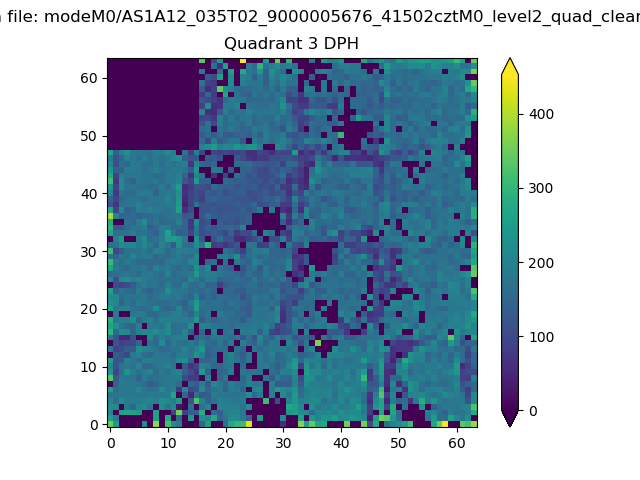 |
 |
Quadrant C |
| Plot type | Count rate plots | Images |
|---|---|---|
| Comparison with Poisson distribution Blue bars denote a histogram of data divided into 1 sec bins. Red curve is a Poisson curve with rate = median count rate of data. |
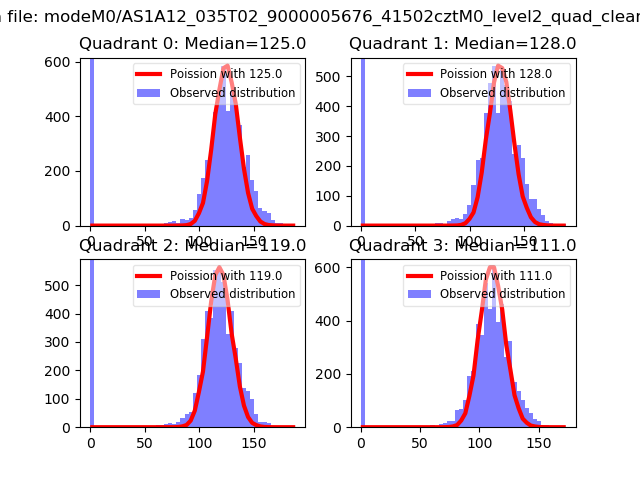 |
 |
| Quadrant-wise count rates Data is divided into 100 sec bins |
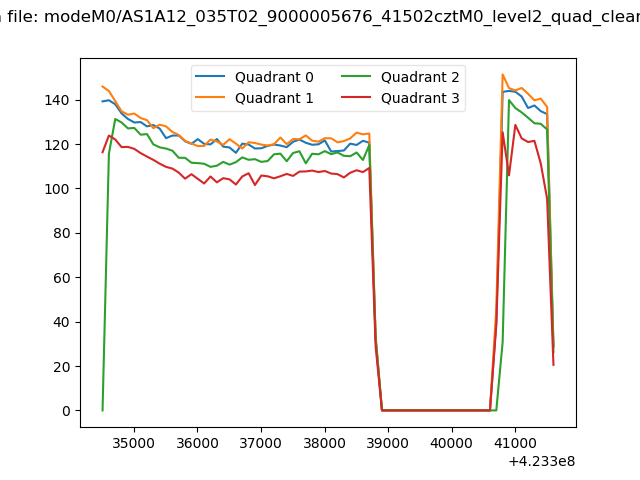 |
|
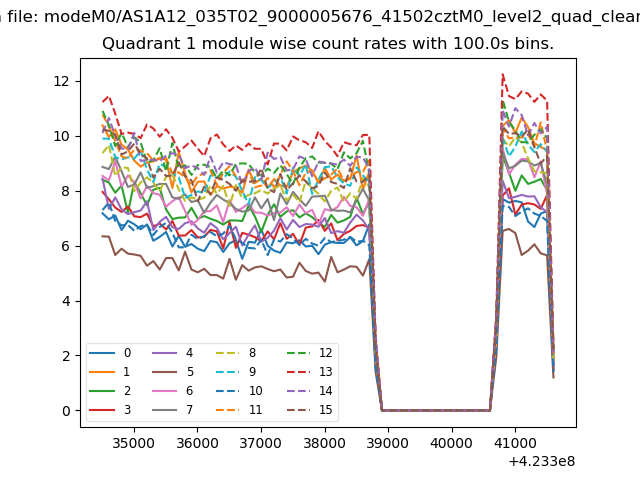
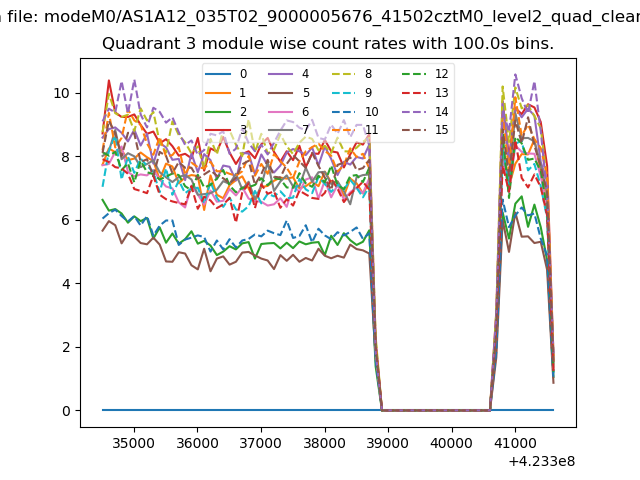
| Module-wise count rates for Quadrant A Data is divided into 100 sec bins |
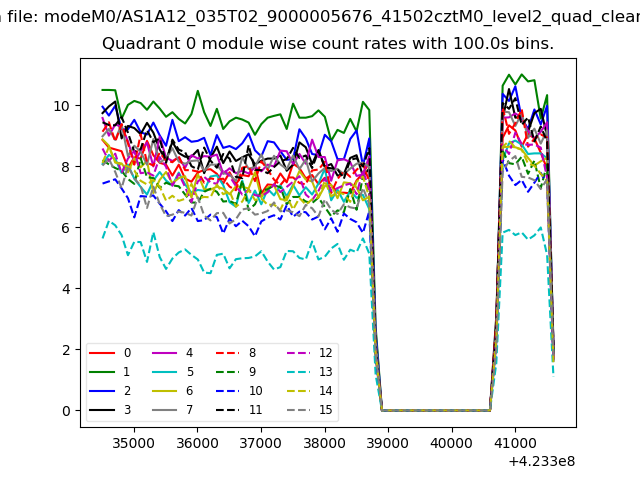 |
 |
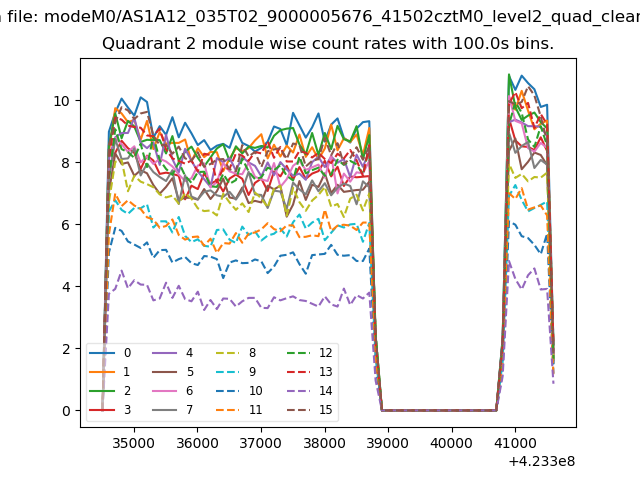
| Module-wise count rates for Quadrant B Data is divided into 100 sec bins |
 |
 |
| Module-wise count rates for Quadrant C Data is divided into 100 sec bins |
 |
 |
| Module-wise count rates for Quadrant D Data is divided into 100 sec bins |
 |
 |
| Parameter | Plot |
|---|---|
| CZT HV Monitor | 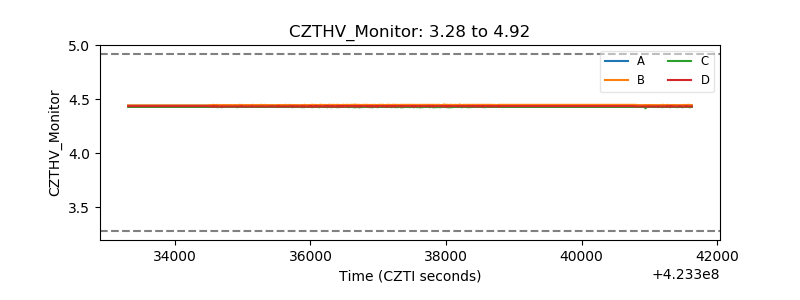 |
| D_VDD | 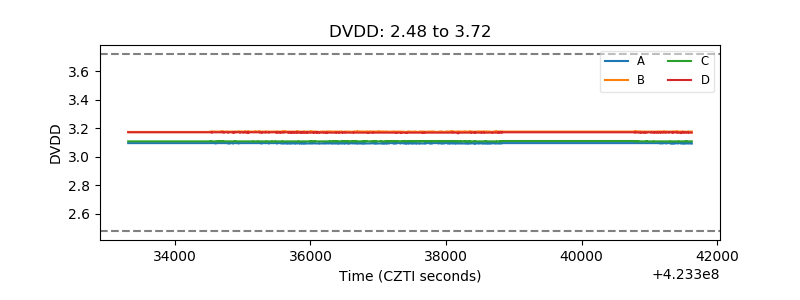 |
| Temperature 1 | 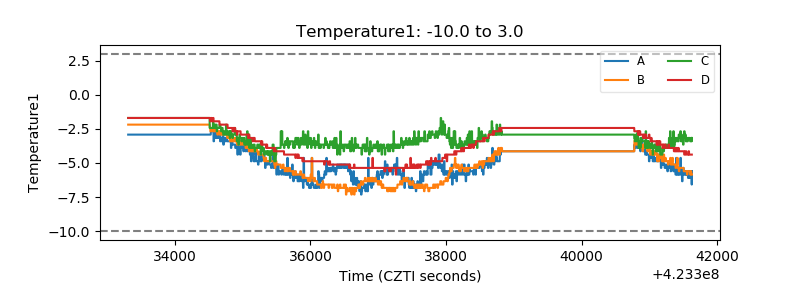 |
| Veto HV Monitor |  |
| Veto LLD | 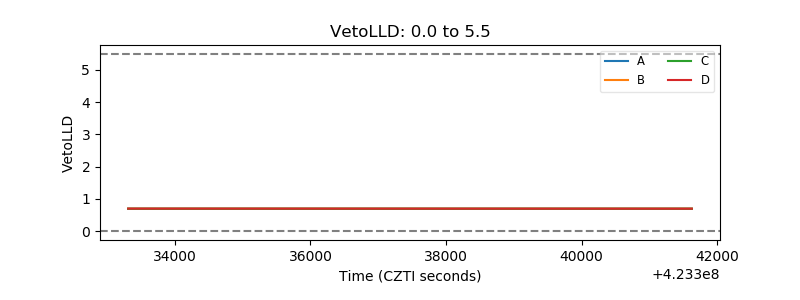 |
| Alpha Counter | 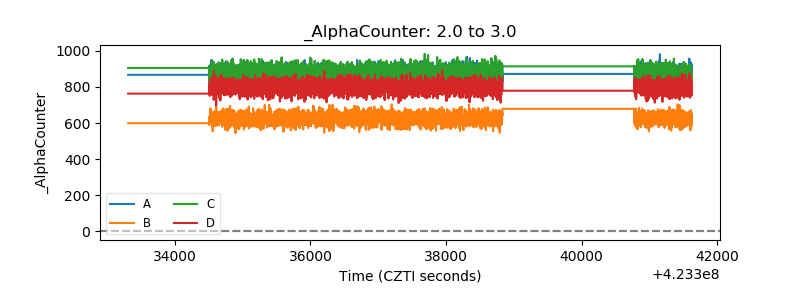 |
| _CPM_Rate | 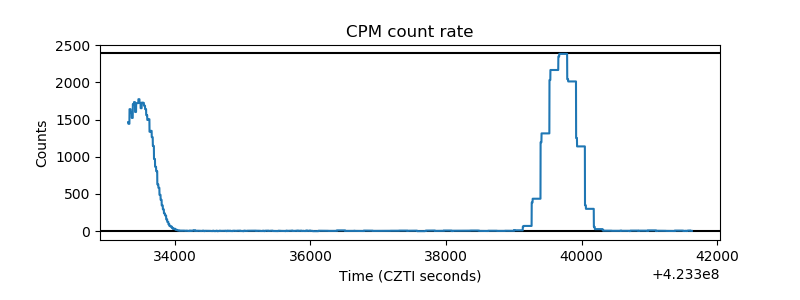 |
| CZT Counter | 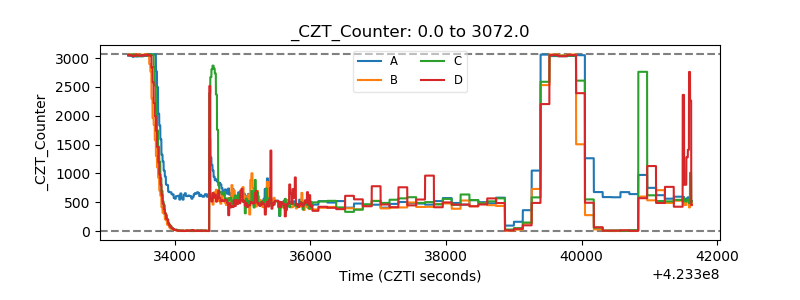 |
| +2.5 Volts monitor | 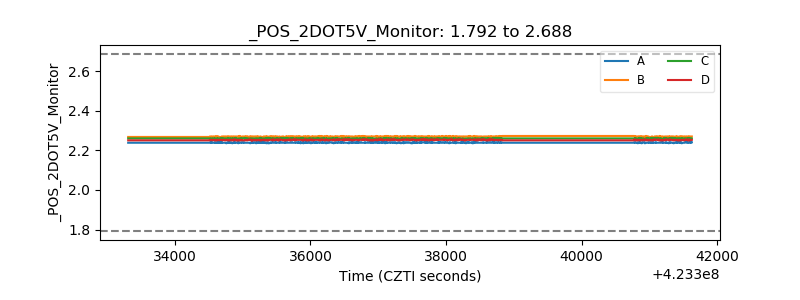 |
| +5 Volts monitor | 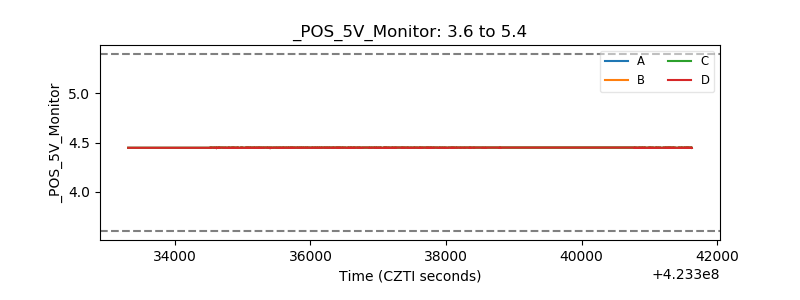 |
| _ROLL_ROT | 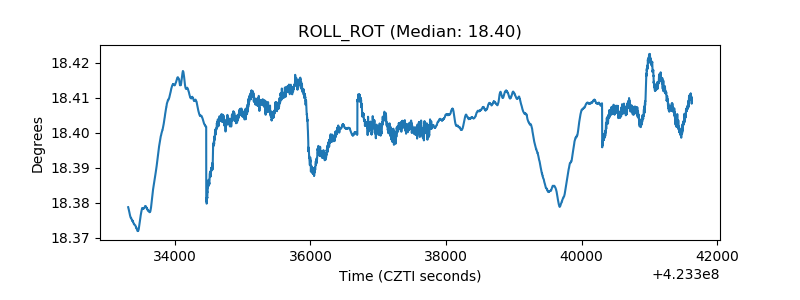 |
| _Roll_DEC | 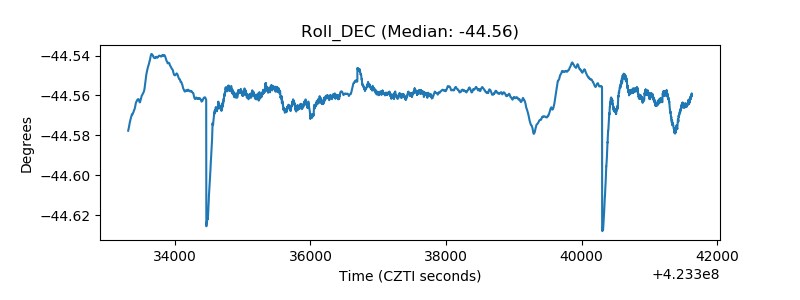 |
| _Roll_RA | 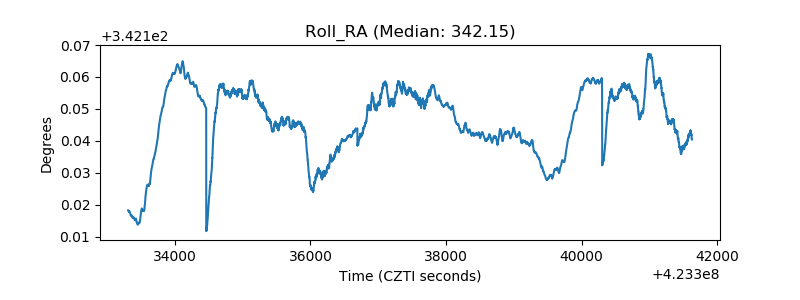 |
| Veto Counter | 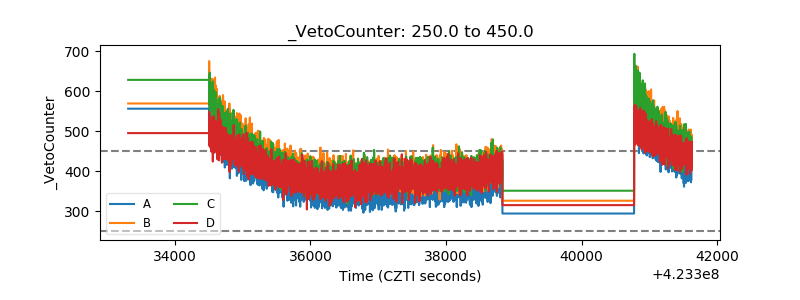 |