| Param | Original file | Final file |
|---|---|---|
| Filename | modeM0/AS1A12_035T02_9000005676_41503cztM0_level2.fits | modeM0/AS1A12_035T02_9000005676_41503cztM0_level2_quad_clean.evt |
| Size (bytes) | 332,219,520 | 90,388,800 |
| Size | 316.8 MB | 86.2 MB |
| Events in quadrant A | 2,785,536 | 633,836 |
| Events in quadrant B | 2,425,082 | 648,940 |
| Events in quadrant C | 3,171,480 | 573,651 |
| Events in quadrant D | 3,530,821 | 534,700 |
| Mode SS | |||
|---|---|---|---|
| Quadrant | BADHDUFLAG | Total packets | Discarded packets |
| A | 0 | 100 | 0 |
| B | 0 | 100 | 0 |
| C | 0 | 100 | 0 |
| D | 0 | 100 | 0 |
| Mode M0 | |||
|---|---|---|---|
| Quadrant | BADHDUFLAG | Total packets | Discarded packets |
| A | 0 | 11183 | 3 |
| B | 0 | 10355 | 2 |
| C | 0 | 12258 | 2 |
| D | 0 | 13745 | 2 |
| Mode M9 | |||
|---|---|---|---|
| Quadrant | BADHDUFLAG | Total packets | Discarded packets |
| A | 0 | 24 | 0 |
| B | 0 | 24 | 0 |
| C | 0 | 24 | 0 |
| D | 0 | 25 | 0 |
| Quadrant | Total seconds | Saturated seconds | Saturation percentage |
|---|---|---|---|
| A | 4937 | 22 | 0.445615% |
| B | 4937 | 14 | 0.283573% |
| C | 4937 | 256 | 5.185335% |
| D | 4937 | 289 | 5.853757% |
Noise dominated data is calculated using 1-second bins in cleaned event files. If a bin has >2000 counts, and if more than 50% of those come from <1% of pixels, then it is considered to be noise-dominated and hence unusable.
| Quadrant | # 1 sec bins | Bins with >0 counts | Bins with >2000 counts | High rate bins dominated by noise | Noise dominated (total time) | Noise dominated (detector-on time) | Marked lightcurve |
|---|---|---|---|---|---|---|---|
| A | 7000 | 4938 | 6 | 6 | 0.09% | 0.12% | 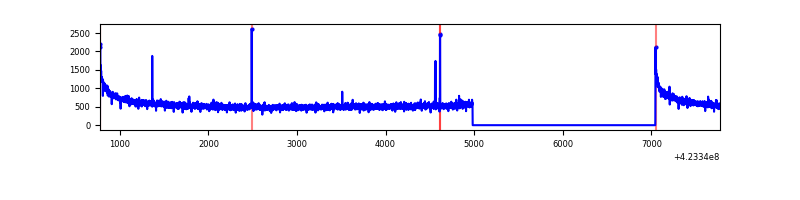 |
| B | 7000 | 4938 | 1 | 1 | 0.01% | 0.02% | 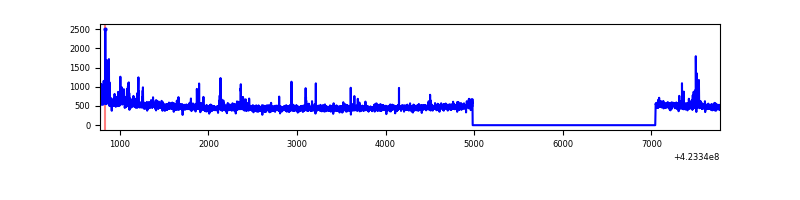 |
| C | 7000 | 4938 | 254 | 254 | 3.63% | 5.14% | 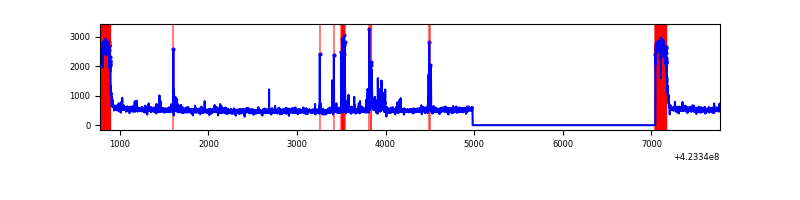 |
| D | 7000 | 4938 | 281 | 281 | 4.01% | 5.69% | 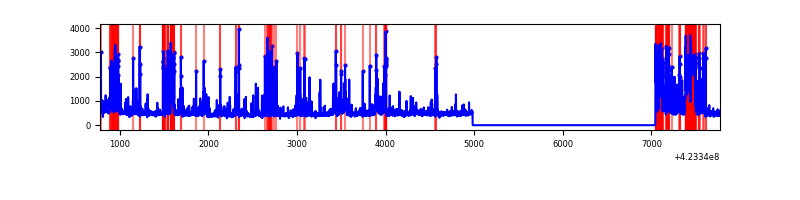 |
Top three noisy pixels from each quadrant. If the there are fewer than three noisy pixels in the level2.evt file, extra rows are filled as -1
| Pixel properties | Quadrant properties | ||||||
|---|---|---|---|---|---|---|---|
| Quadrant | DetID | PixID | Counts | Sigma | Mean | Median | Sigma |
| A | 10 | 83 | 488258 | 4110.94 | 584 | 573 | 118.6 |
| A | 2 | 79 | 18420 | 150.44 | 584 | 573 | 118.6 |
| A | 13 | 6 | 12085 | 97.04 | 584 | 573 | 118.6 |
| B | 0 | 190 | 82695 | 749.79 | 583 | 567 | 109.5 |
| B | 0 | 245 | 23318 | 207.71 | 583 | 567 | 109.5 |
| B | 15 | 54 | 17699 | 156.41 | 583 | 567 | 109.5 |
| C | 0 | 10 | 628308 | 4978.71 | 549 | 554 | 126.1 |
| C | 15 | 214 | 203916 | 1612.86 | 549 | 554 | 126.1 |
| C | 14 | 254 | 127396 | 1005.98 | 549 | 554 | 126.1 |
| D | 12 | 128 | 437503 | 3243.67 | 554 | 538 | 134.7 |
| D | 12 | 16 | 225517 | 1670.06 | 554 | 538 | 134.7 |
| D | 12 | 218 | 220669 | 1634.07 | 554 | 538 | 134.7 |
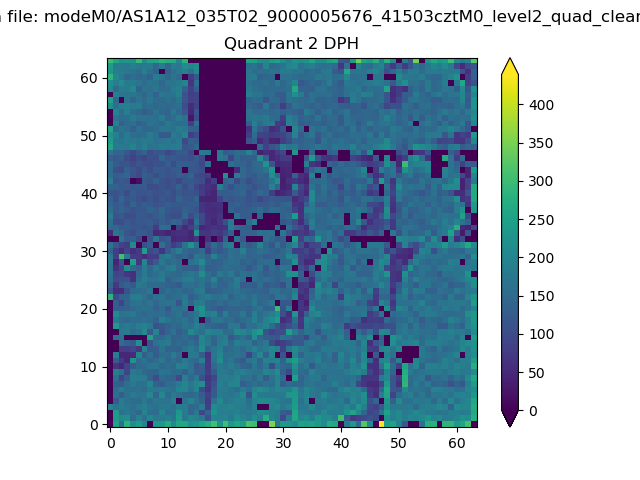
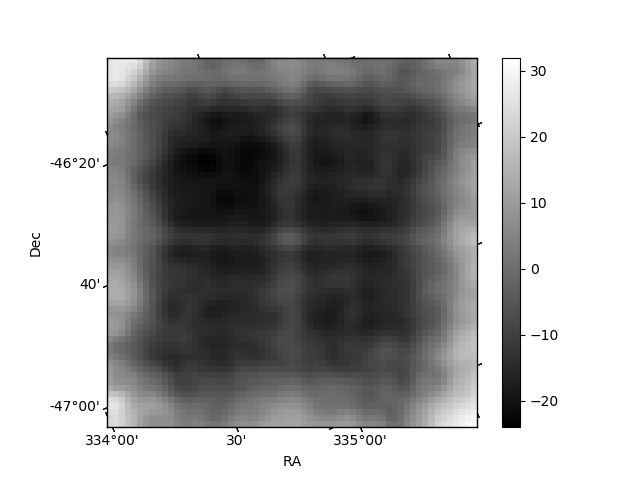
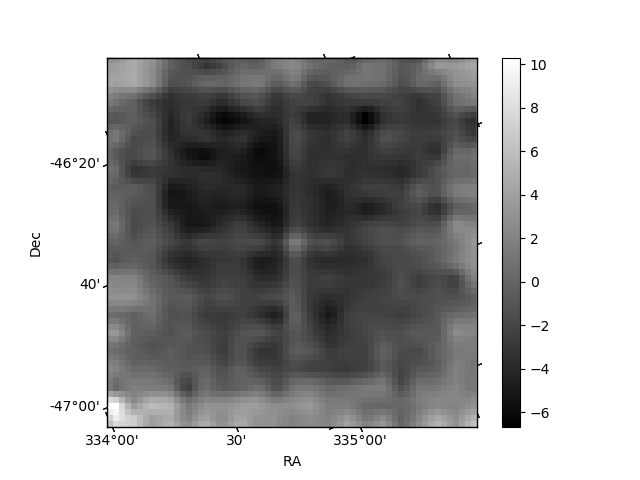
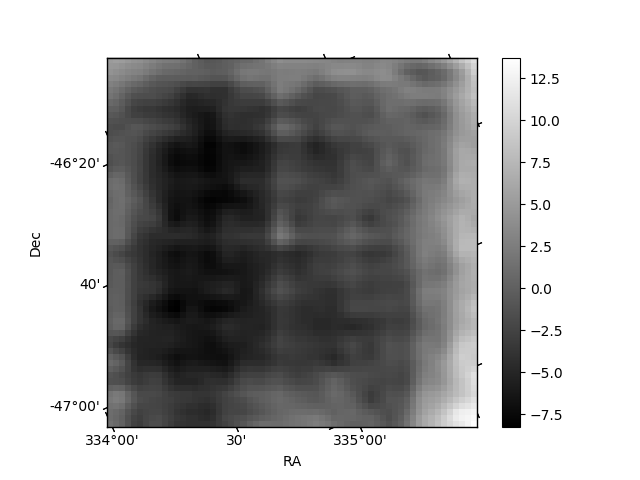
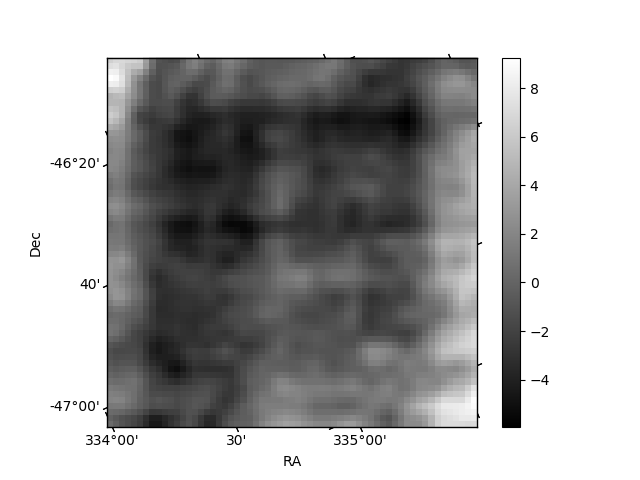
Histogram calculated using DETX and DETY for each event in the final _common_clean file
| Quadrant A | 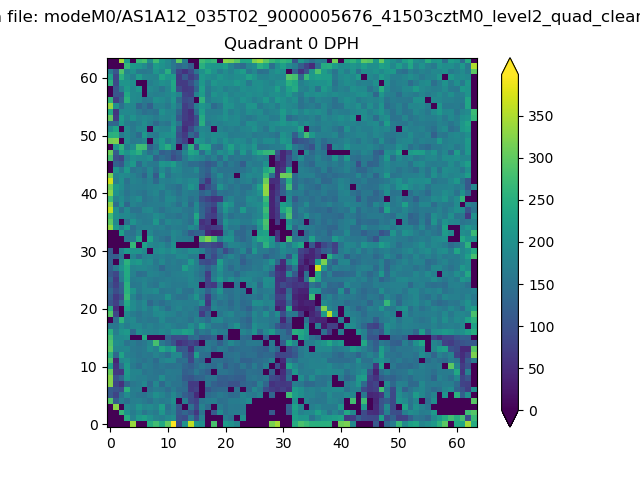 |
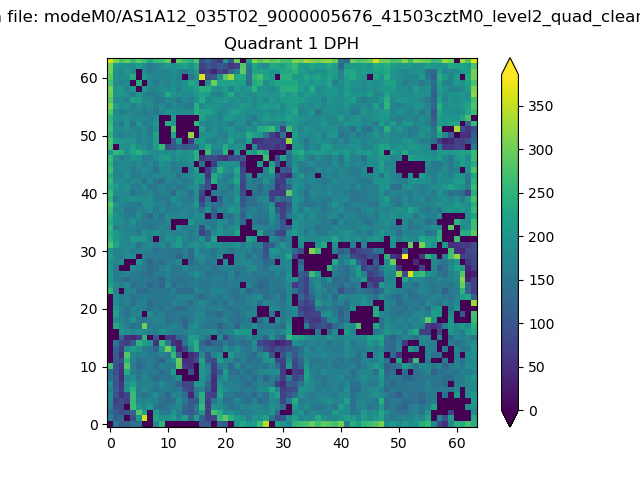 |
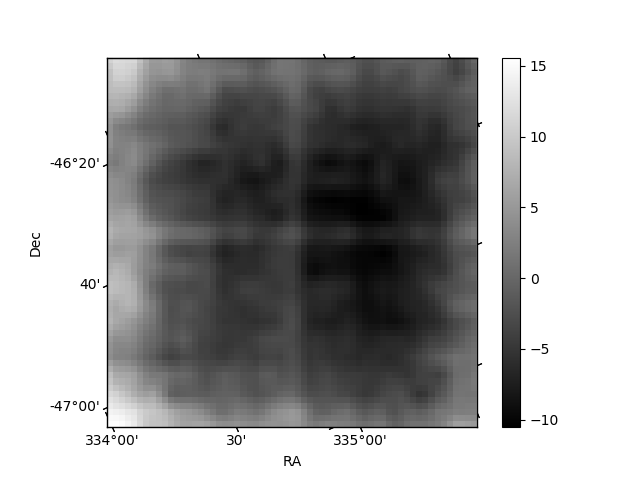
Quadrant B |
|---|---|---|---|
| Quadrant D | 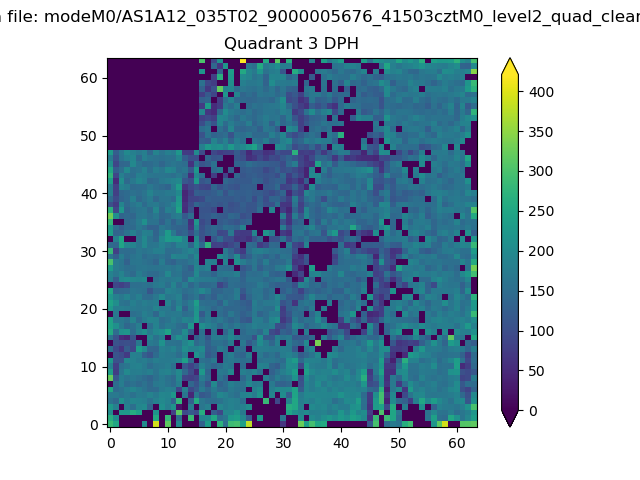 |
 |
Quadrant C |
| Plot type | Count rate plots | Images |
|---|---|---|
| Comparison with Poisson distribution Blue bars denote a histogram of data divided into 1 sec bins. Red curve is a Poisson curve with rate = median count rate of data. |
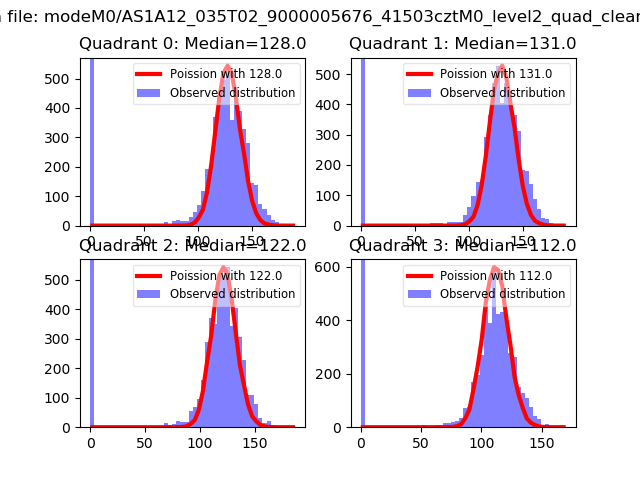 |
 |
| Quadrant-wise count rates Data is divided into 100 sec bins |
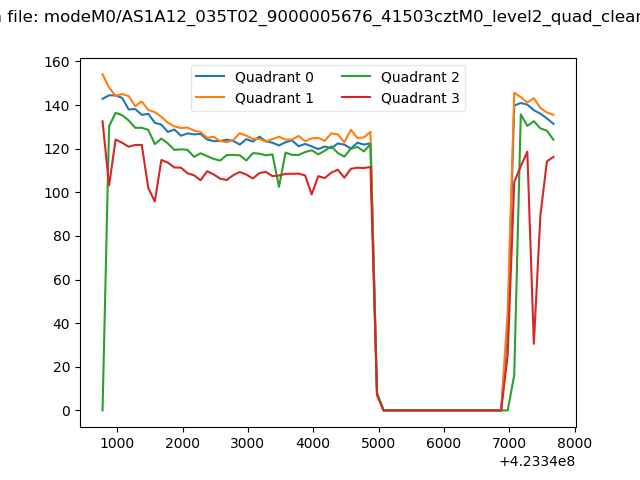 |
|
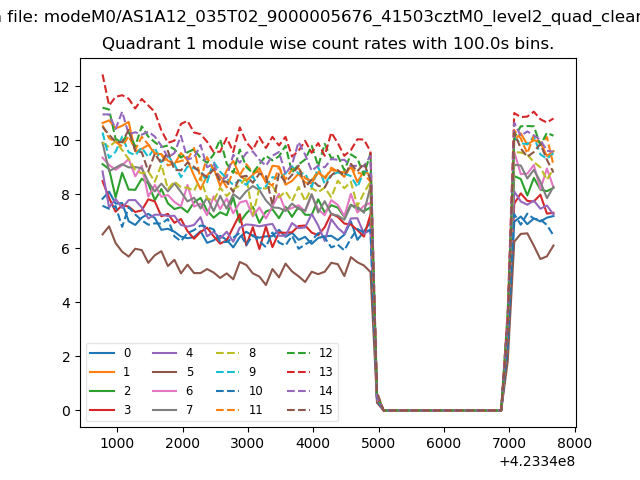
| Module-wise count rates for Quadrant A Data is divided into 100 sec bins |
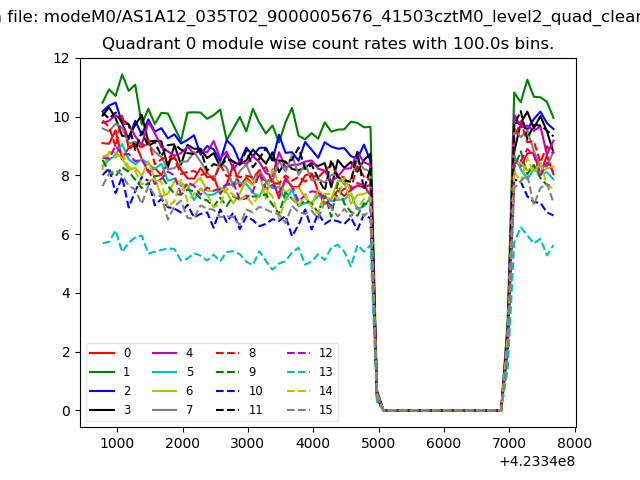 |
 |
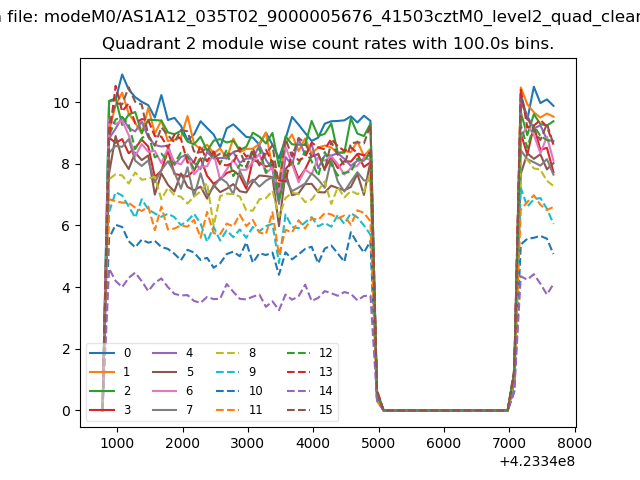
| Module-wise count rates for Quadrant B Data is divided into 100 sec bins |
 |
 |
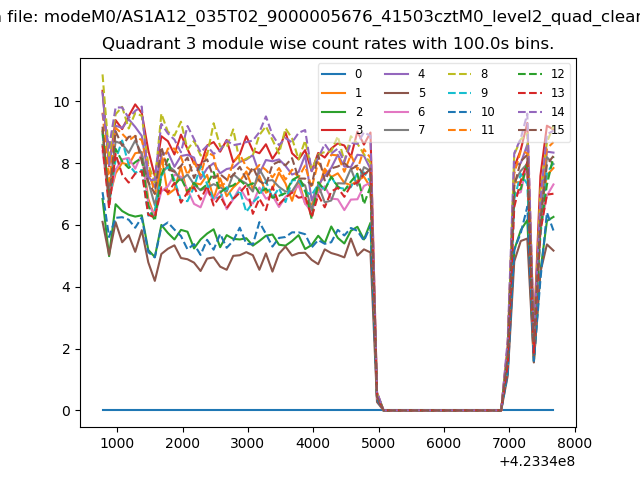
| Module-wise count rates for Quadrant C Data is divided into 100 sec bins |
 |
 |
| Module-wise count rates for Quadrant D Data is divided into 100 sec bins |
 |
 |
| Parameter | Plot |
|---|---|
| CZT HV Monitor | 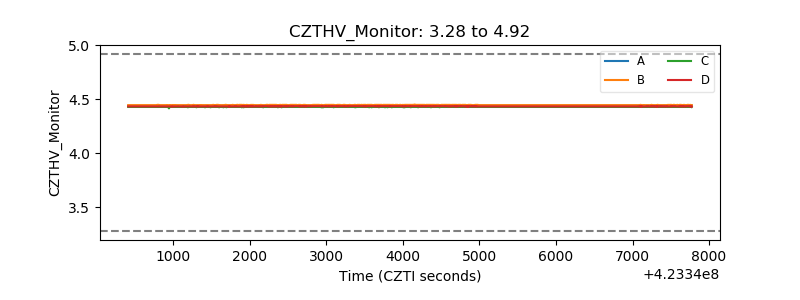 |
| D_VDD | 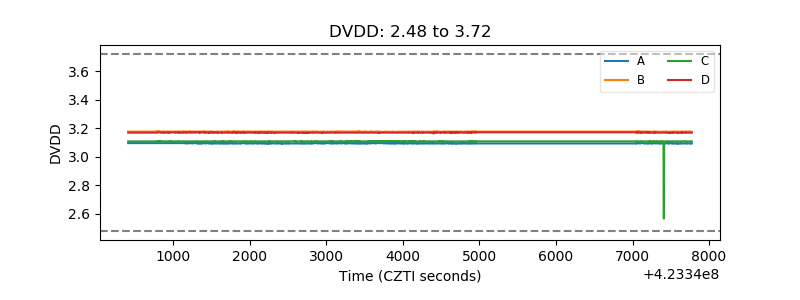 |
| Temperature 1 | 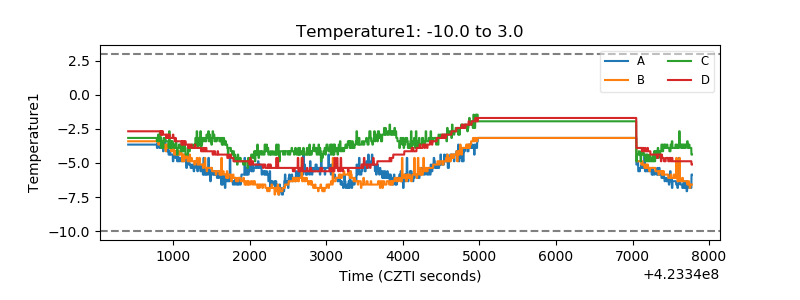 |
| Veto HV Monitor | 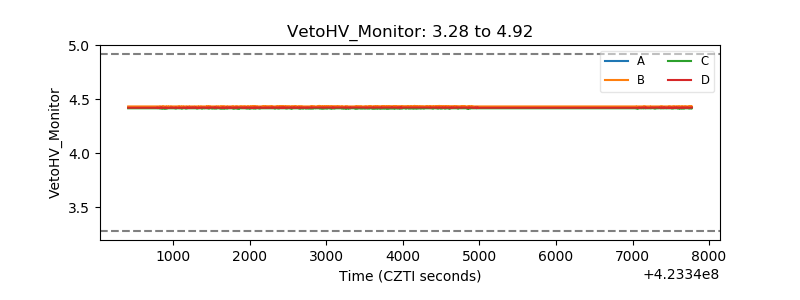 |
| Veto LLD | 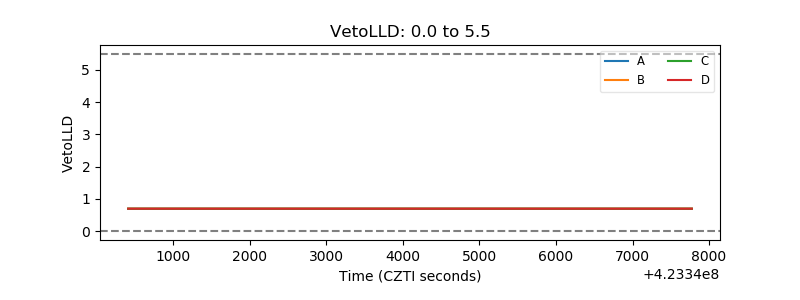 |
| Alpha Counter | 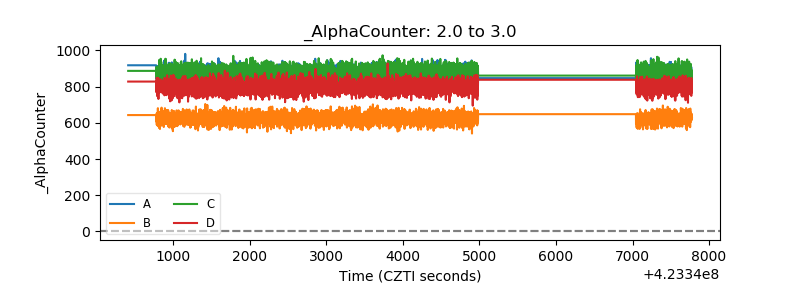 |
| _CPM_Rate | 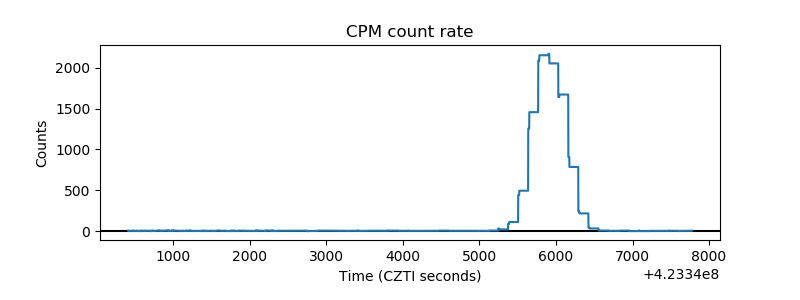 |
| CZT Counter | 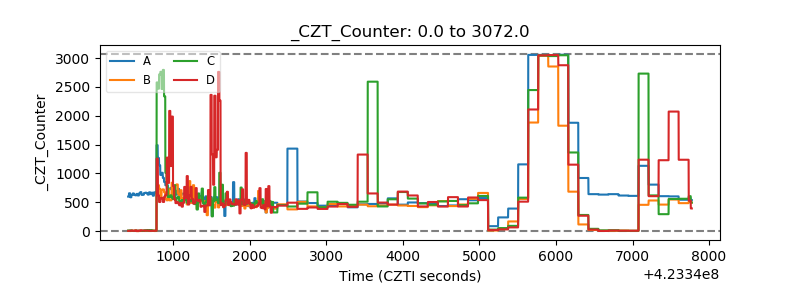 |
| +2.5 Volts monitor | 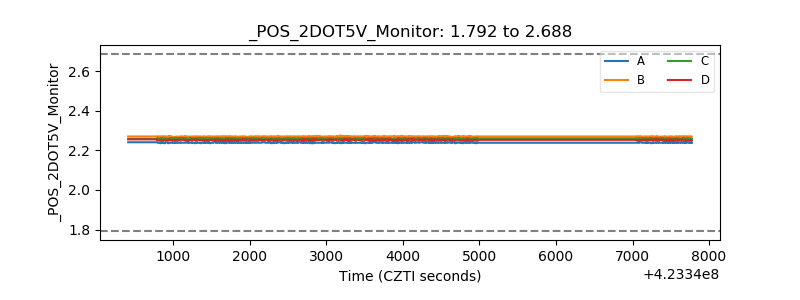 |
| +5 Volts monitor | 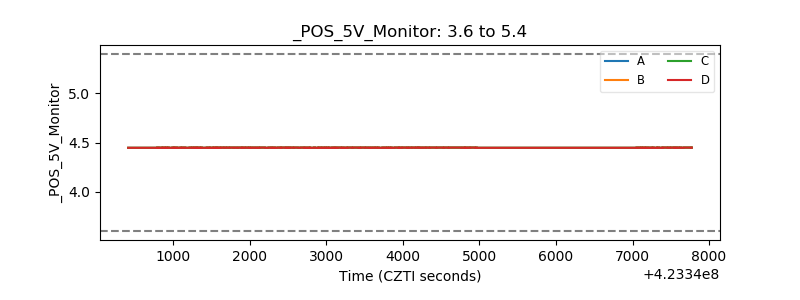 |
| _ROLL_ROT | 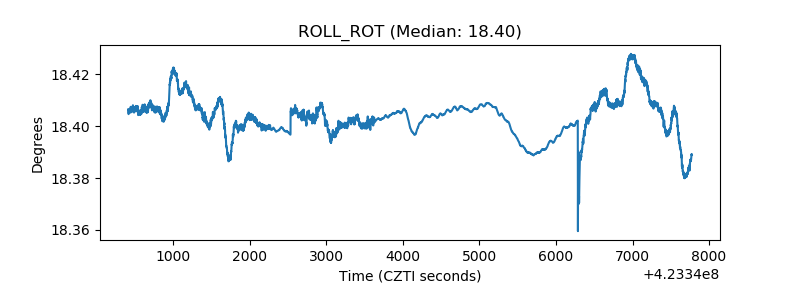 |
| _Roll_DEC | 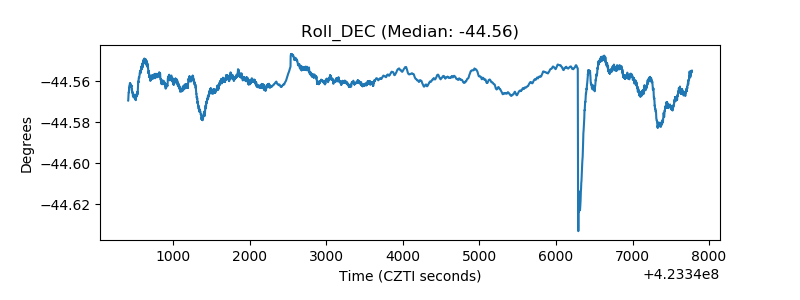 |
| _Roll_RA | 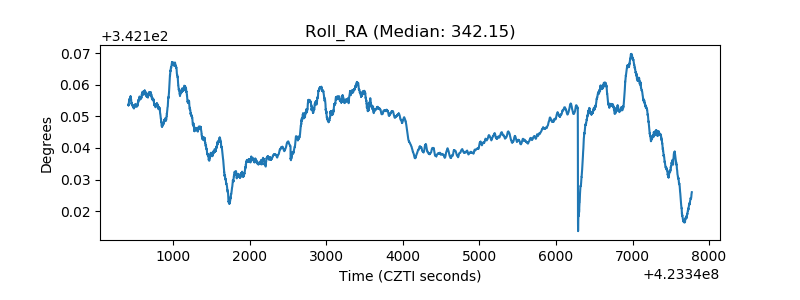 |
| Veto Counter | 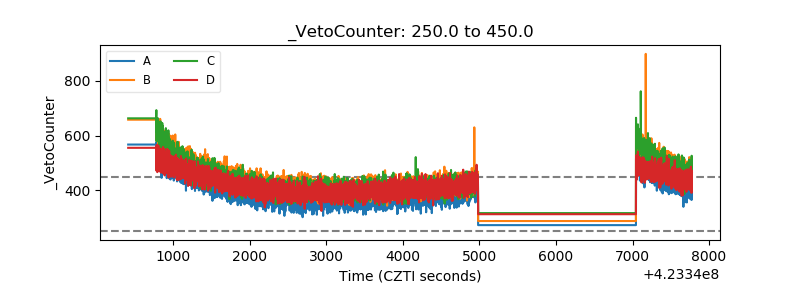 |