| Param | Original file | Final file |
|---|---|---|
| Filename | modeM0/AS1A12_035T02_9000005676_41505cztM0_level2.fits | modeM0/AS1A12_035T02_9000005676_41505cztM0_level2_quad_clean.evt |
| Size (bytes) | 300,320,640 | 85,936,320 |
| Size | 286.4 MB | 82.0 MB |
| Events in quadrant A | 2,917,688 | 578,107 |
| Events in quadrant B | 2,224,701 | 603,744 |
| Events in quadrant C | 2,954,606 | 545,261 |
| Events in quadrant D | 2,632,586 | 527,422 |
| Mode SS | |||
|---|---|---|---|
| Quadrant | BADHDUFLAG | Total packets | Discarded packets |
| A | 0 | 100 | 0 |
| B | 0 | 100 | 0 |
| C | 0 | 100 | 0 |
| D | 0 | 100 | 0 |
| Mode M0 | |||
|---|---|---|---|
| Quadrant | BADHDUFLAG | Total packets | Discarded packets |
| A | 0 | 11717 | 3 |
| B | 0 | 10030 | 2 |
| C | 0 | 11741 | 2 |
| D | 0 | 11301 | 2 |
| Mode M9 | |||
|---|---|---|---|
| Quadrant | BADHDUFLAG | Total packets | Discarded packets |
| A | 0 | 29 | 0 |
| B | 0 | 29 | 0 |
| C | 0 | 29 | 0 |
| D | 0 | 30 | 0 |
| Quadrant | Total seconds | Saturated seconds | Saturation percentage |
|---|---|---|---|
| A | 4965 | 107 | 2.155086% |
| B | 4965 | 3 | 0.060423% |
| C | 4965 | 241 | 4.853978% |
| D | 4965 | 67 | 1.349446% |
Noise dominated data is calculated using 1-second bins in cleaned event files. If a bin has >2000 counts, and if more than 50% of those come from <1% of pixels, then it is considered to be noise-dominated and hence unusable.
| Quadrant | # 1 sec bins | Bins with >0 counts | Bins with >2000 counts | High rate bins dominated by noise | Noise dominated (total time) | Noise dominated (detector-on time) | Marked lightcurve |
|---|---|---|---|---|---|---|---|
| A | 7088 | 4966 | 98 | 98 | 1.38% | 1.97% | 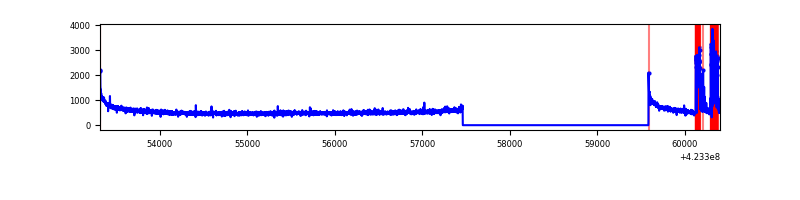 |
| B | 7088 | 4966 | 0 | 0 | 0.00% | 0.00% | 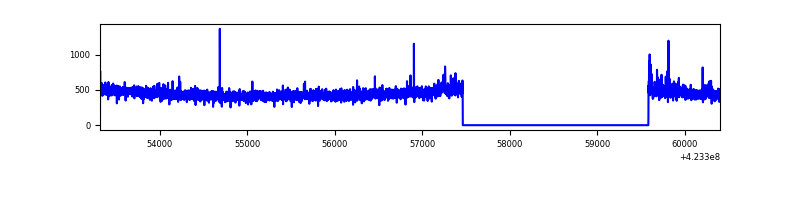 |
| C | 7088 | 4966 | 236 | 236 | 3.33% | 4.75% | 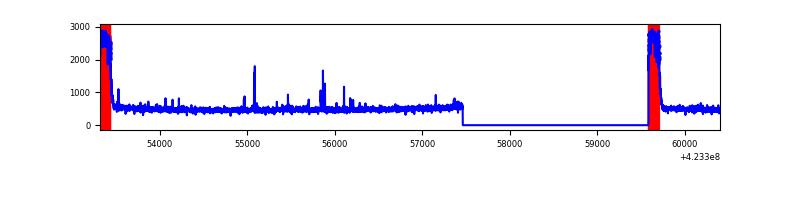 |
| D | 7088 | 4966 | 70 | 70 | 0.99% | 1.41% | 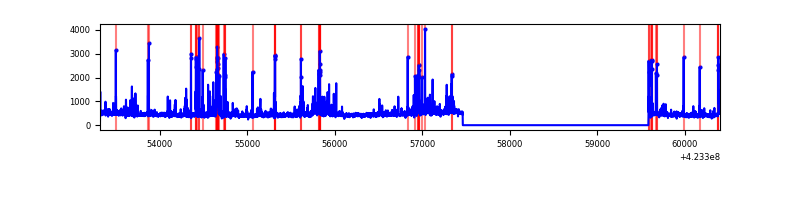 |
Top three noisy pixels from each quadrant. If the there are fewer than three noisy pixels in the level2.evt file, extra rows are filled as -1
| Pixel properties | Quadrant properties | ||||||
|---|---|---|---|---|---|---|---|
| Quadrant | DetID | PixID | Counts | Sigma | Mean | Median | Sigma |
| A | 10 | 83 | 479514 | 4260.95 | 551 | 540 | 112.4 |
| A | 15 | 190 | 274586 | 2437.91 | 551 | 540 | 112.4 |
| A | 2 | 79 | 21398 | 185.55 | 551 | 540 | 112.4 |
| B | 0 | 190 | 30331 | 280.3 | 555 | 541 | 106.3 |
| B | 12 | 111 | 13224 | 119.34 | 555 | 541 | 106.3 |
| B | 11 | 111 | 12116 | 108.91 | 555 | 541 | 106.3 |
| C | 0 | 10 | 624793 | 5004.86 | 536 | 541 | 124.7 |
| C | 15 | 214 | 205145 | 1640.39 | 536 | 541 | 124.7 |
| C | 14 | 254 | 17485 | 135.85 | 536 | 541 | 124.7 |
| D | 1 | 47 | 191912 | 1446.68 | 546 | 531 | 132.3 |
| D | 12 | 6 | 90513 | 680.18 | 546 | 531 | 132.3 |
| D | 2 | 153 | 75275 | 565.0 | 546 | 531 | 132.3 |
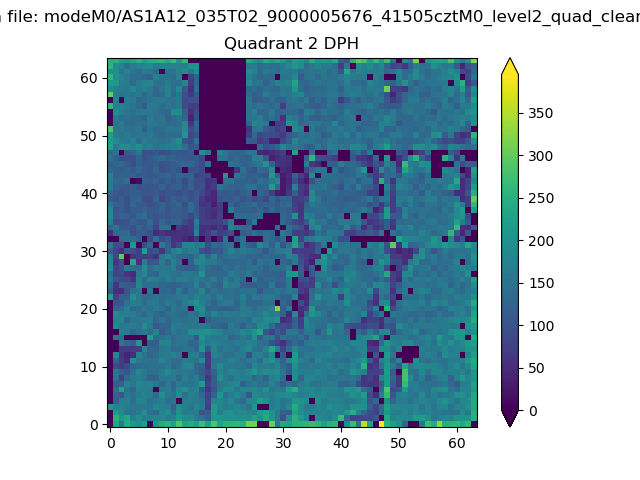
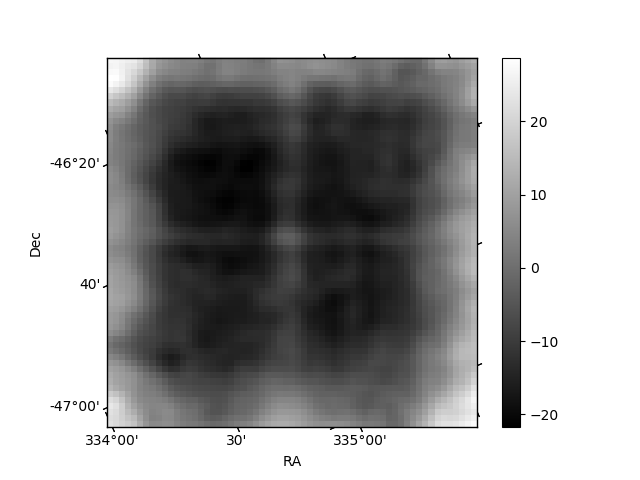
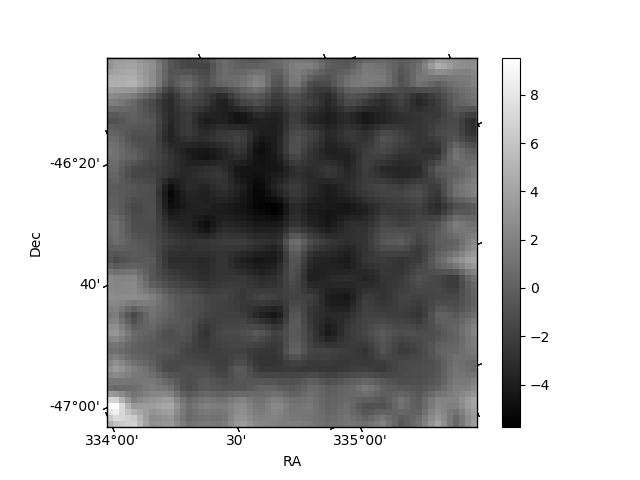
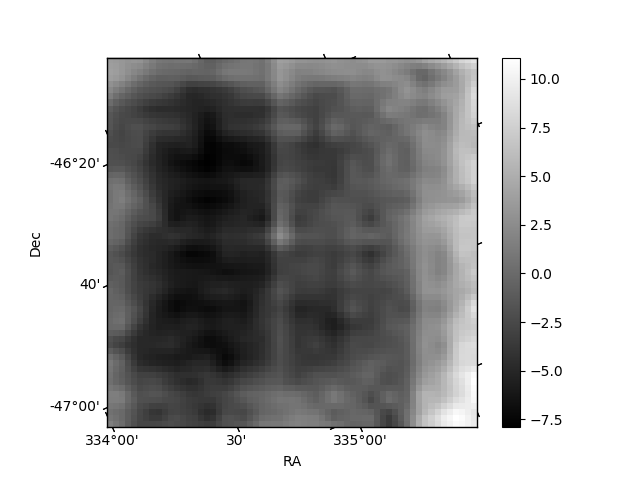
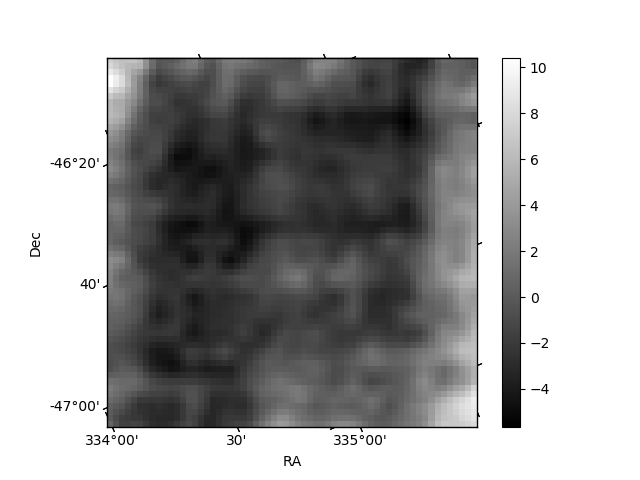
Histogram calculated using DETX and DETY for each event in the final _common_clean file
| Quadrant A | 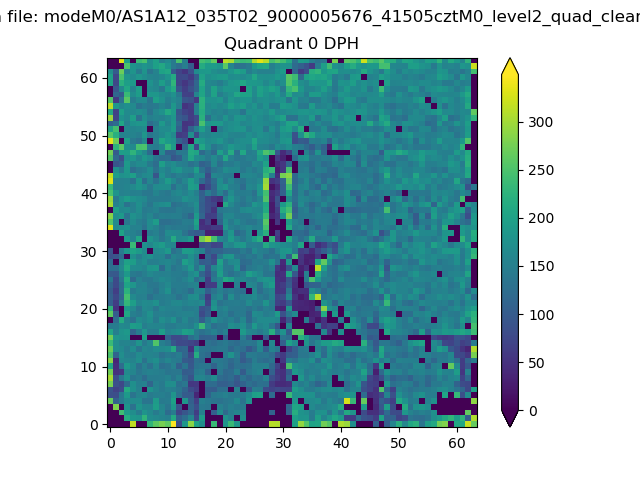 |
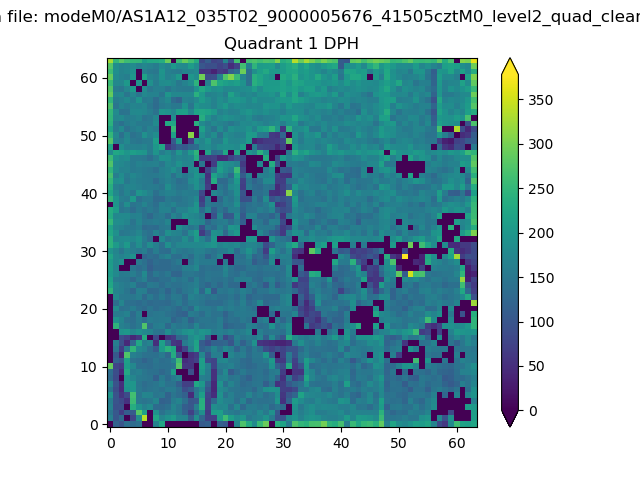 |
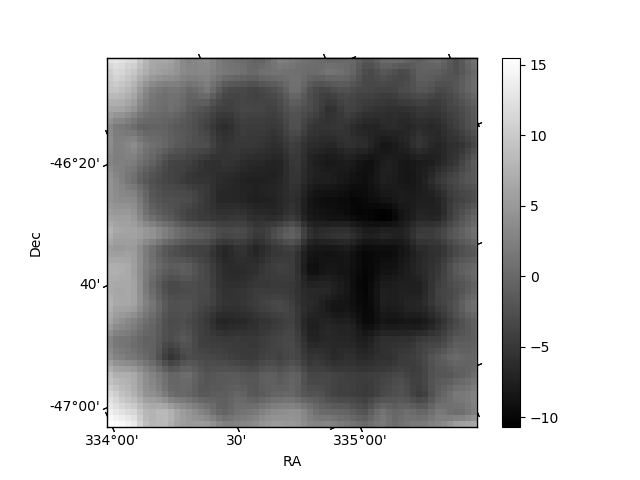
Quadrant B |
|---|---|---|---|
| Quadrant D | 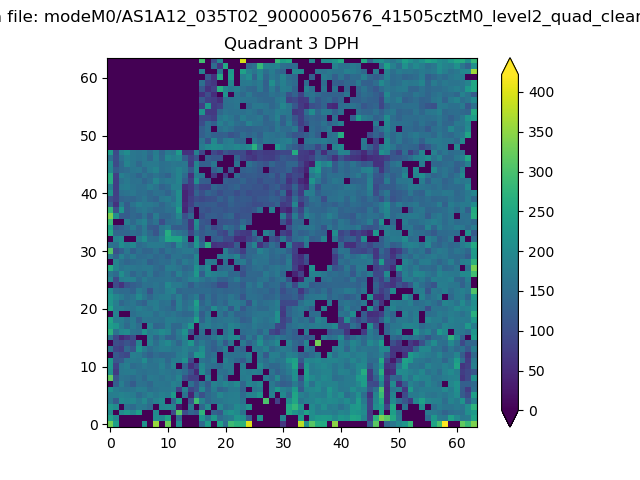 |
 |
Quadrant C |
| Plot type | Count rate plots | Images |
|---|---|---|
| Comparison with Poisson distribution Blue bars denote a histogram of data divided into 1 sec bins. Red curve is a Poisson curve with rate = median count rate of data. |
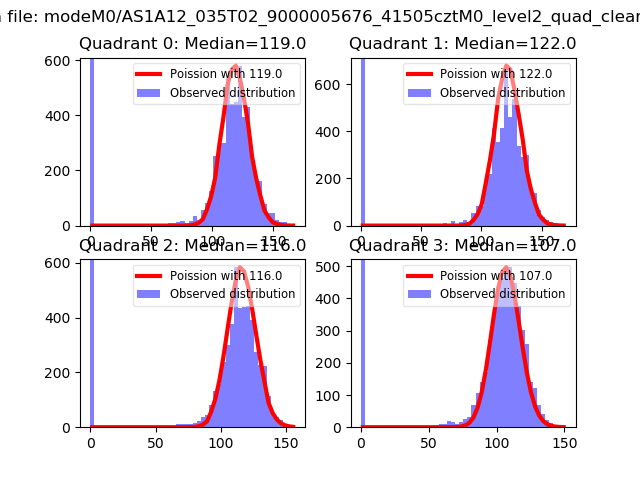 |
 |
| Quadrant-wise count rates Data is divided into 100 sec bins |
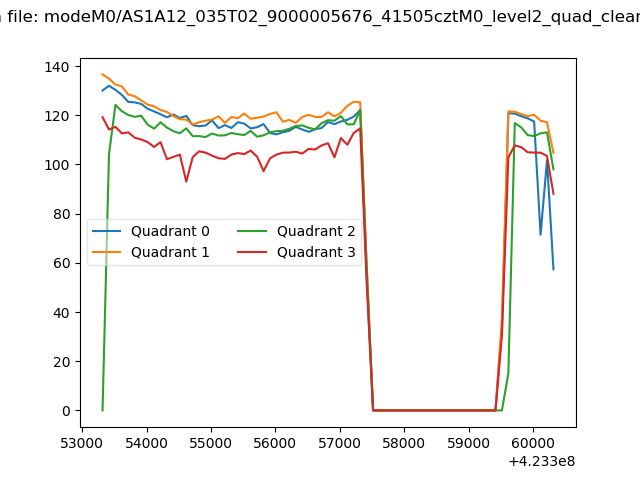 |
|
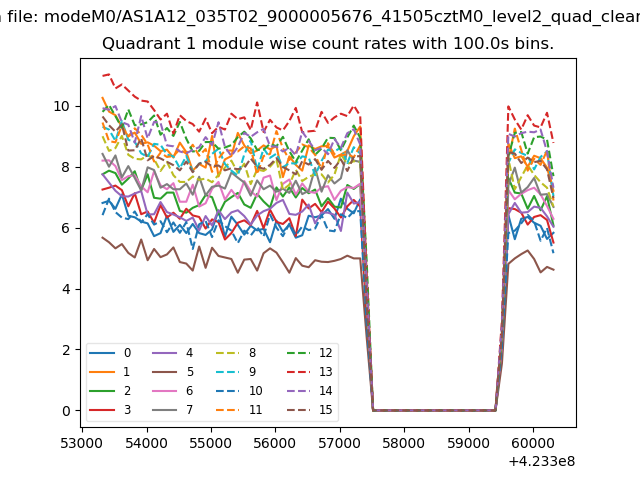
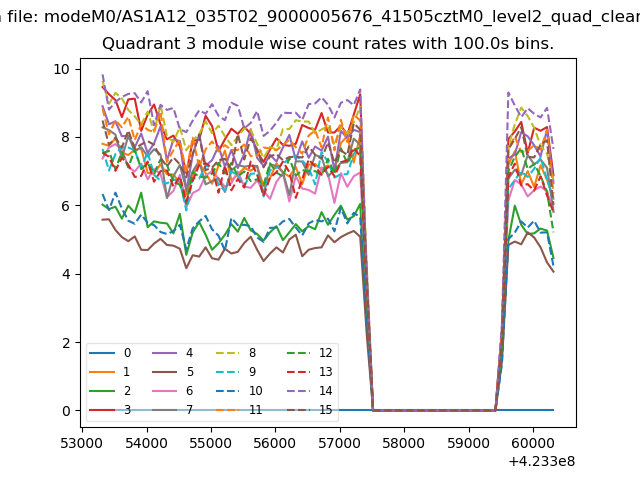
| Module-wise count rates for Quadrant A Data is divided into 100 sec bins |
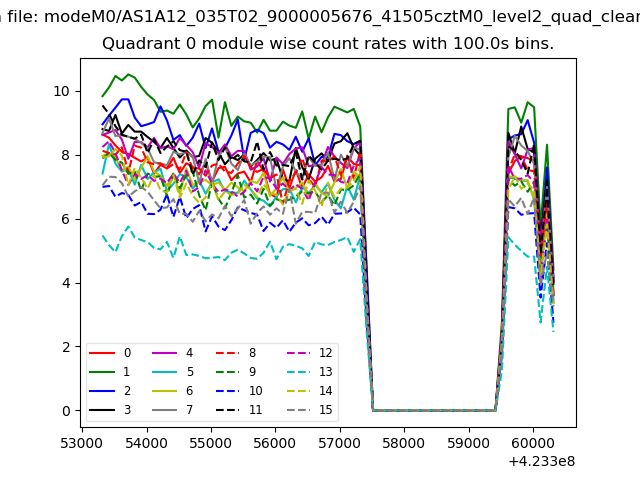 |
 |
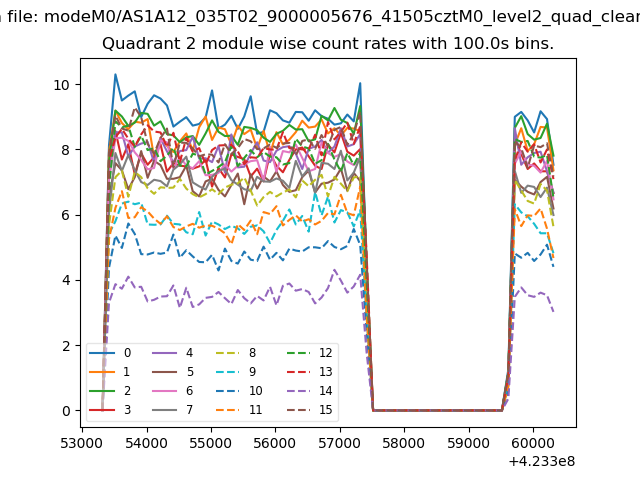
| Module-wise count rates for Quadrant B Data is divided into 100 sec bins |
 |
 |
| Module-wise count rates for Quadrant C Data is divided into 100 sec bins |
 |
 |
| Module-wise count rates for Quadrant D Data is divided into 100 sec bins |
 |
 |
| Parameter | Plot |
|---|---|
| CZT HV Monitor | 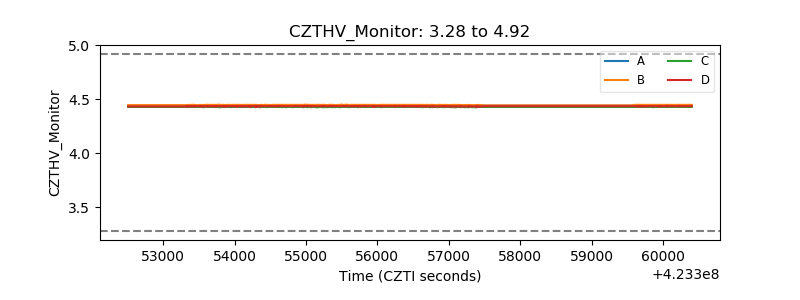 |
| D_VDD | 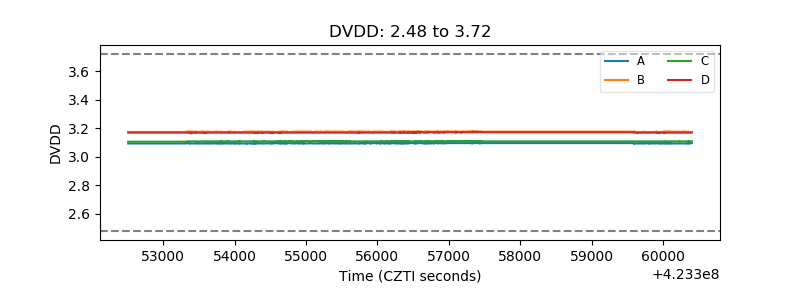 |
| Temperature 1 |  |
| Veto HV Monitor |  |
| Veto LLD | 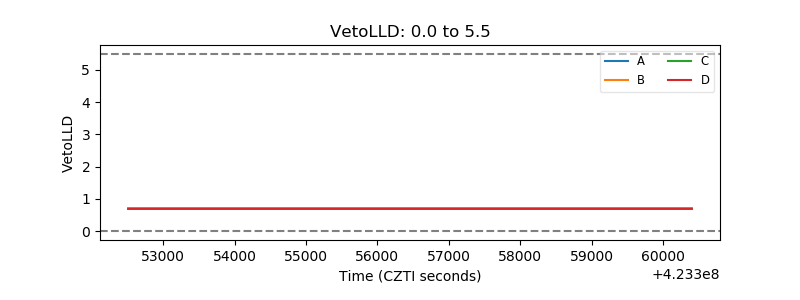 |
| Alpha Counter | 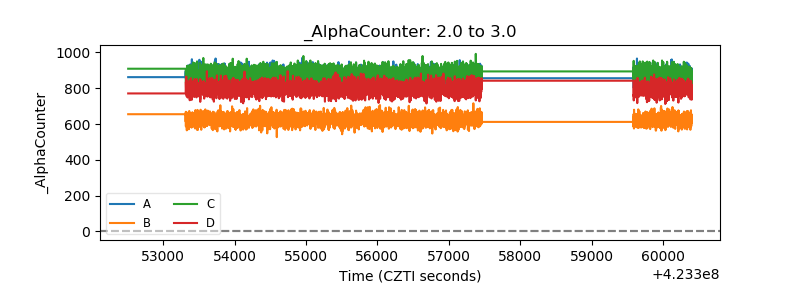 |
| _CPM_Rate | 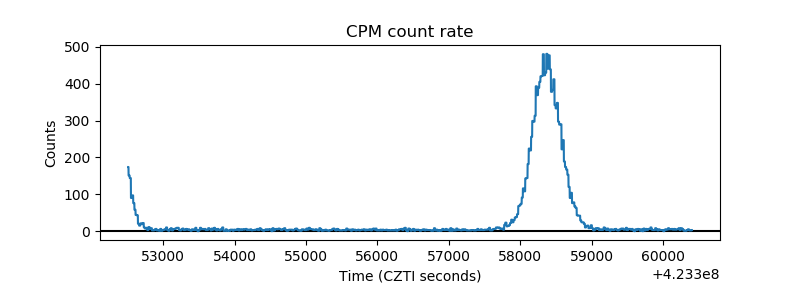 |
| CZT Counter | 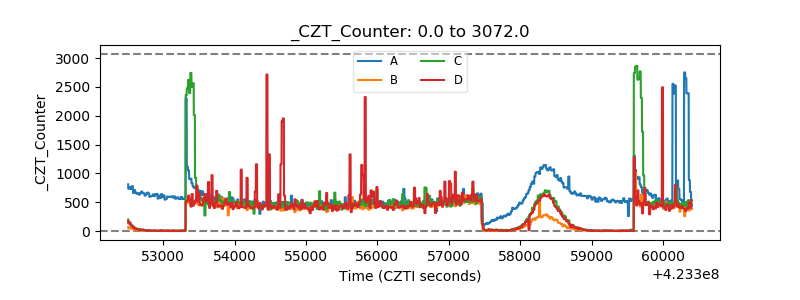 |
| +2.5 Volts monitor | 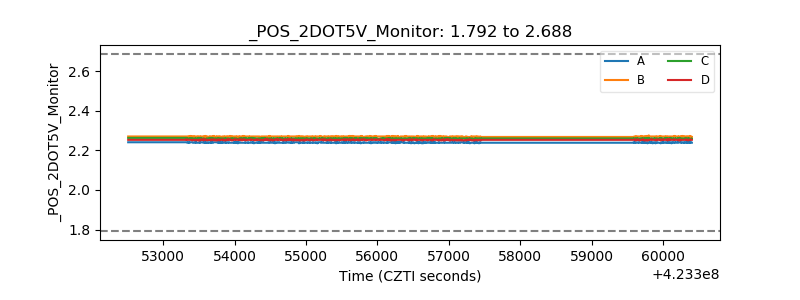 |
| +5 Volts monitor | 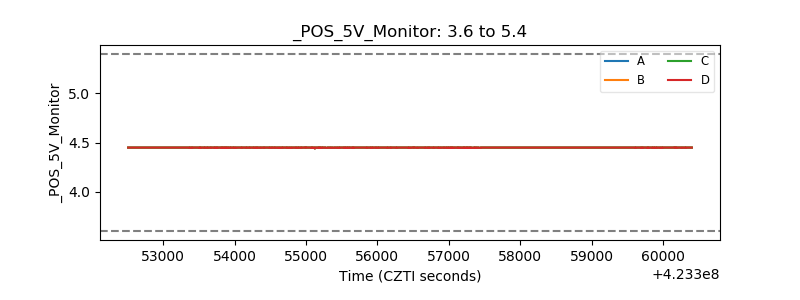 |
| _ROLL_ROT | 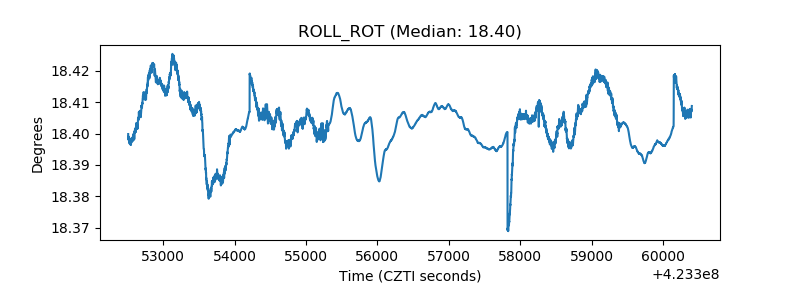 |
| _Roll_DEC | 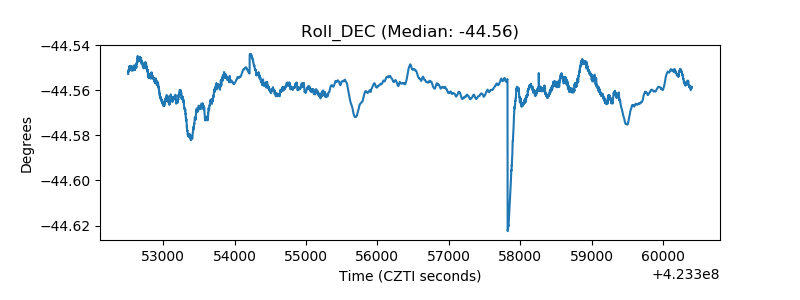 |
| _Roll_RA | 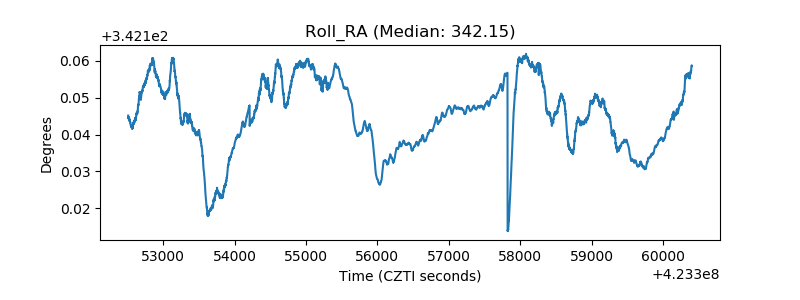 |
| Veto Counter | 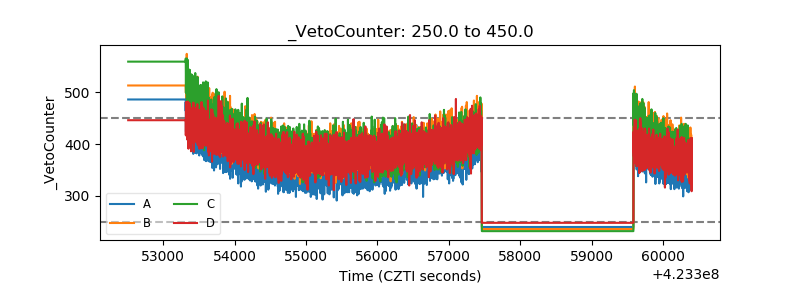 |