| Param | Original file | Final file |
|---|---|---|
| Filename | modeM0/AS1A12_035T02_9000005676_41506cztM0_level2.fits | modeM0/AS1A12_035T02_9000005676_41506cztM0_level2_quad_clean.evt |
| Size (bytes) | 302,633,280 | 83,548,800 |
| Size | 288.6 MB | 79.7 MB |
| Events in quadrant A | 2,956,685 | 555,534 |
| Events in quadrant B | 2,277,844 | 579,538 |
| Events in quadrant C | 2,901,717 | 532,706 |
| Events in quadrant D | 2,675,757 | 511,210 |
| Mode SS | |||
|---|---|---|---|
| Quadrant | BADHDUFLAG | Total packets | Discarded packets |
| A | 0 | 102 | 0 |
| B | 0 | 102 | 0 |
| C | 0 | 102 | 0 |
| D | 0 | 102 | 0 |
| Mode M0 | |||
|---|---|---|---|
| Quadrant | BADHDUFLAG | Total packets | Discarded packets |
| A | 0 | 11814 | 3 |
| B | 0 | 10300 | 2 |
| C | 0 | 11686 | 2 |
| D | 0 | 11485 | 2 |
| Mode M9 | |||
|---|---|---|---|
| Quadrant | BADHDUFLAG | Total packets | Discarded packets |
| A | 0 | 34 | 0 |
| B | 0 | 34 | 0 |
| C | 0 | 34 | 0 |
| D | 0 | 35 | 0 |
| Quadrant | Total seconds | Saturated seconds | Saturation percentage |
|---|---|---|---|
| A | 5006 | 117 | 2.337195% |
| B | 5006 | 10 | 0.199760% |
| C | 5006 | 227 | 4.534559% |
| D | 5006 | 54 | 1.078706% |
Noise dominated data is calculated using 1-second bins in cleaned event files. If a bin has >2000 counts, and if more than 50% of those come from <1% of pixels, then it is considered to be noise-dominated and hence unusable.
| Quadrant | # 1 sec bins | Bins with >0 counts | Bins with >2000 counts | High rate bins dominated by noise | Noise dominated (total time) | Noise dominated (detector-on time) | Marked lightcurve |
|---|---|---|---|---|---|---|---|
| A | 7009 | 5007 | 112 | 112 | 1.60% | 2.24% | 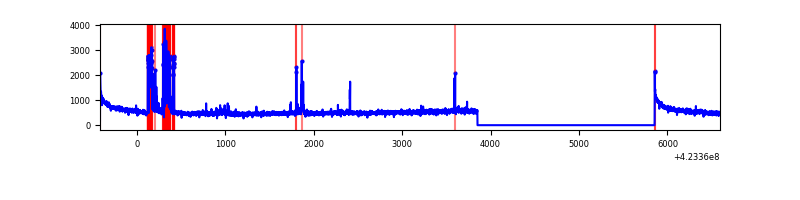 |
| B | 7009 | 5007 | 2 | 2 | 0.03% | 0.04% | 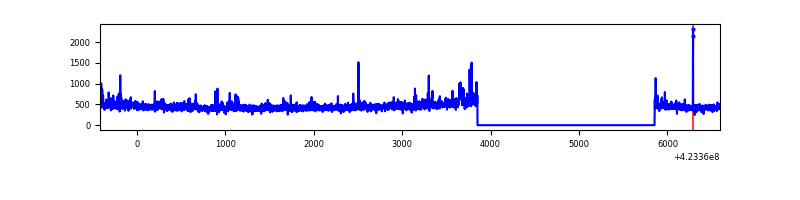 |
| C | 7009 | 5007 | 228 | 228 | 3.25% | 4.55% | 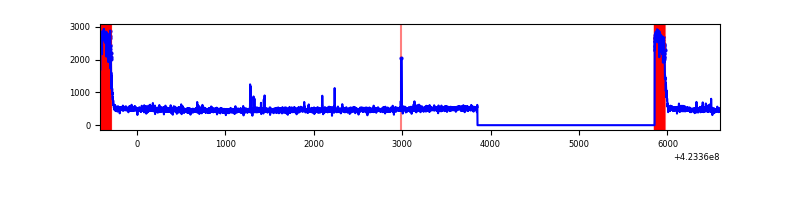 |
| D | 7009 | 5007 | 60 | 60 | 0.86% | 1.20% | 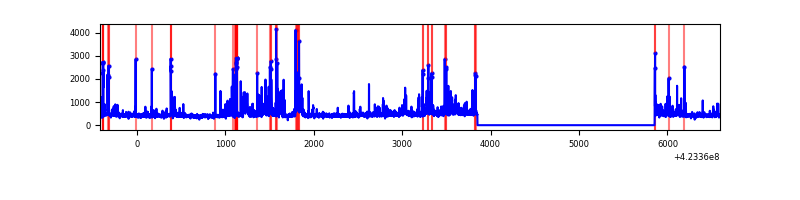 |
Top three noisy pixels from each quadrant. If the there are fewer than three noisy pixels in the level2.evt file, extra rows are filled as -1
| Pixel properties | Quadrant properties | ||||||
|---|---|---|---|---|---|---|---|
| Quadrant | DetID | PixID | Counts | Sigma | Mean | Median | Sigma |
| A | 10 | 83 | 483690 | 4354.23 | 543 | 531 | 111.0 |
| A | 15 | 190 | 344021 | 3095.53 | 543 | 531 | 111.0 |
| A | 13 | 6 | 13803 | 119.61 | 543 | 531 | 111.0 |
| B | 0 | 190 | 113673 | 1074.72 | 545 | 529 | 105.3 |
| B | 0 | 245 | 14397 | 131.73 | 545 | 529 | 105.3 |
| B | 12 | 111 | 13097 | 119.38 | 545 | 529 | 105.3 |
| C | 0 | 10 | 609811 | 4948.76 | 528 | 530 | 123.1 |
| C | 15 | 214 | 206760 | 1675.06 | 528 | 530 | 123.1 |
| C | 14 | 254 | 12237 | 95.09 | 528 | 530 | 123.1 |
| D | 2 | 249 | 166905 | 1261.05 | 540 | 527 | 131.9 |
| D | 1 | 47 | 90097 | 678.89 | 540 | 527 | 131.9 |
| D | 12 | 16 | 89924 | 677.58 | 540 | 527 | 131.9 |
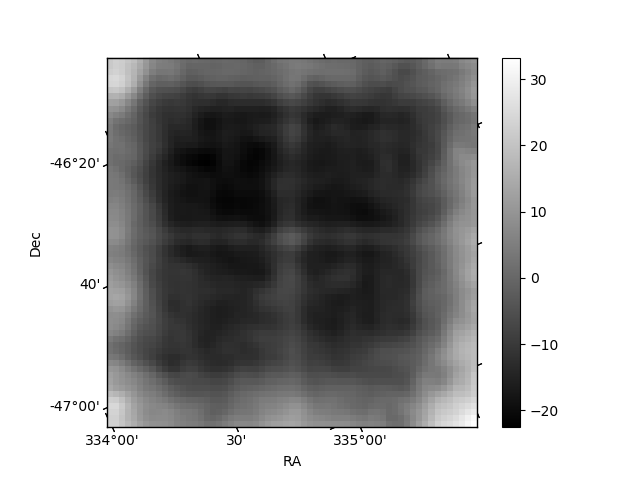
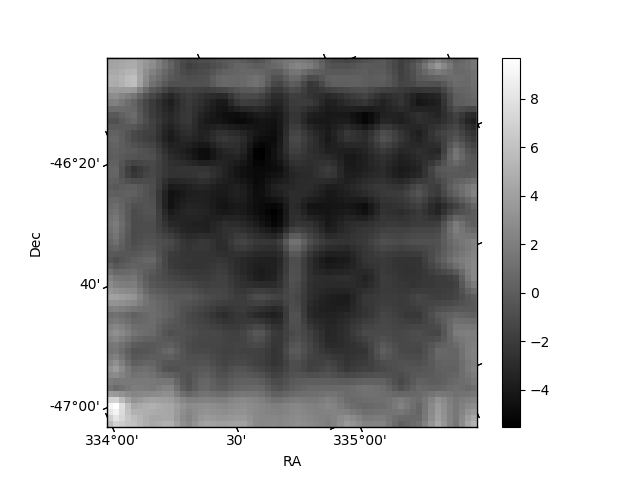
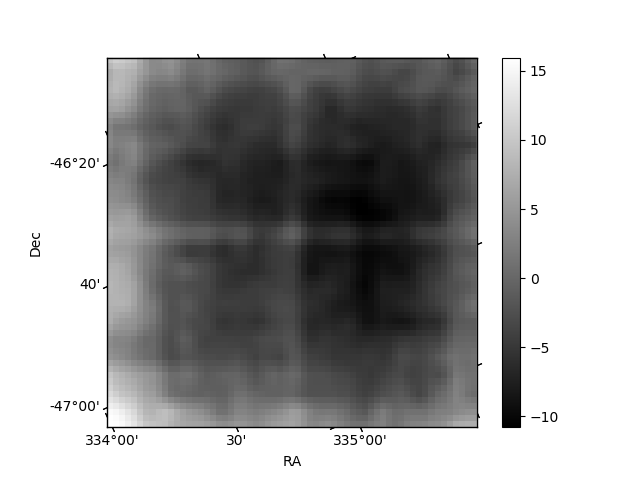
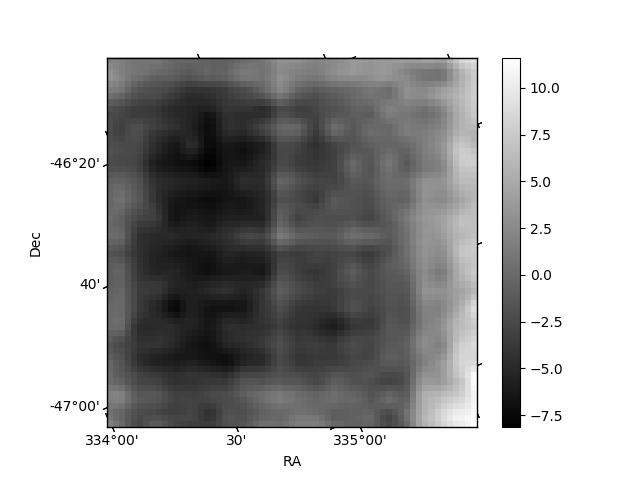
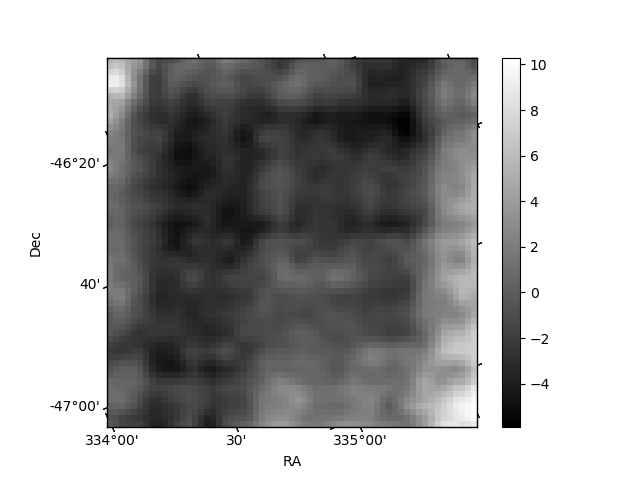
Histogram calculated using DETX and DETY for each event in the final _common_clean file
| Quadrant A | 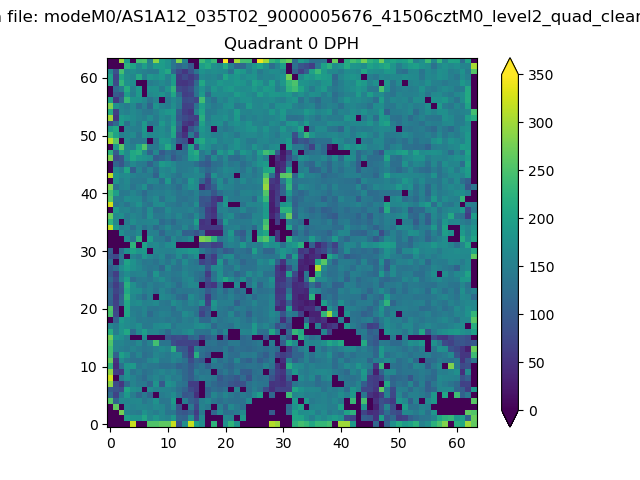 |
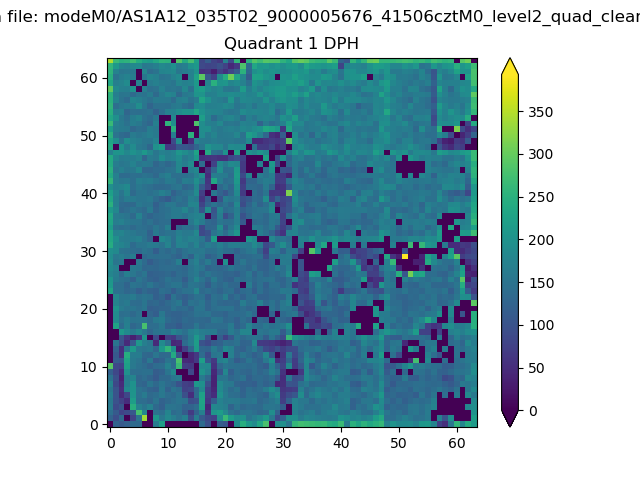 |
Quadrant B |
|---|---|---|---|
| Quadrant D | 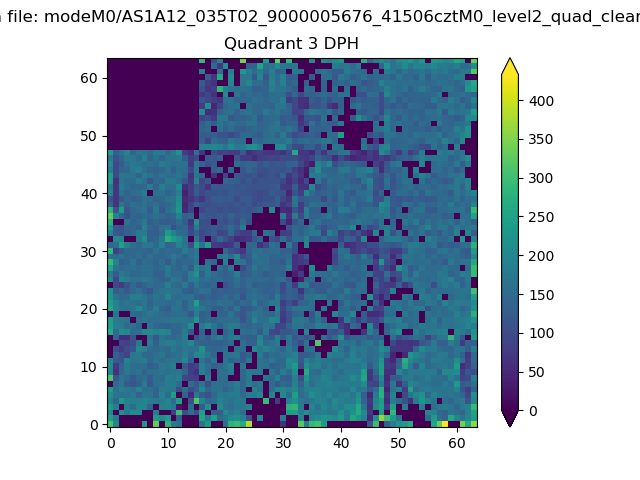 |
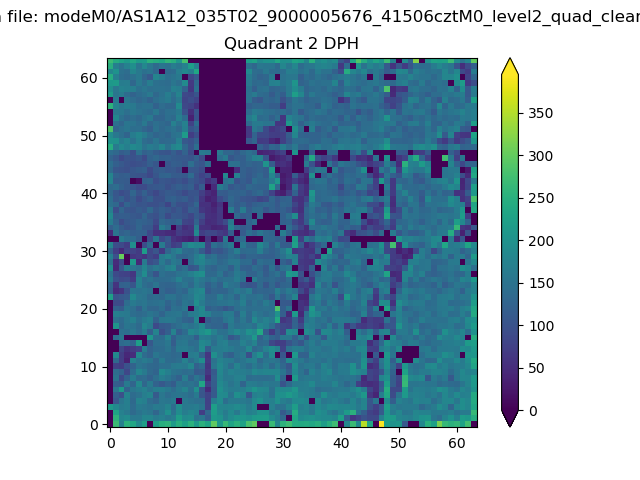 |
Quadrant C |
| Plot type | Count rate plots | Images |
|---|---|---|
| Comparison with Poisson distribution Blue bars denote a histogram of data divided into 1 sec bins. Red curve is a Poisson curve with rate = median count rate of data. |
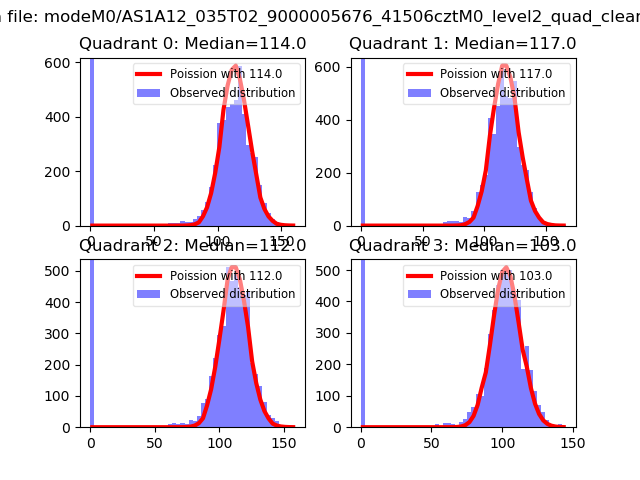 |
 |
| Quadrant-wise count rates Data is divided into 100 sec bins |
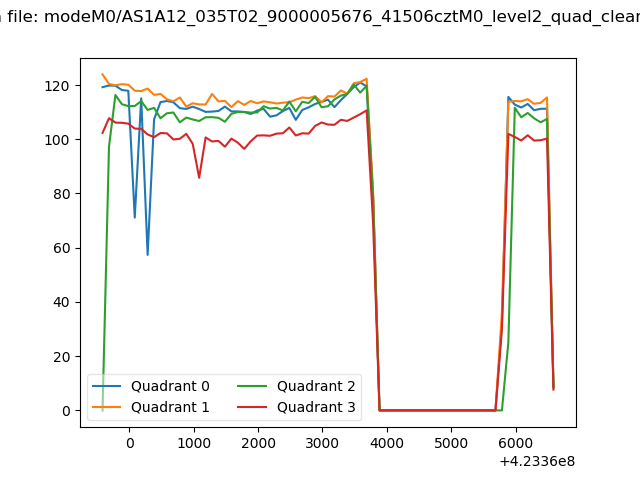 |
|
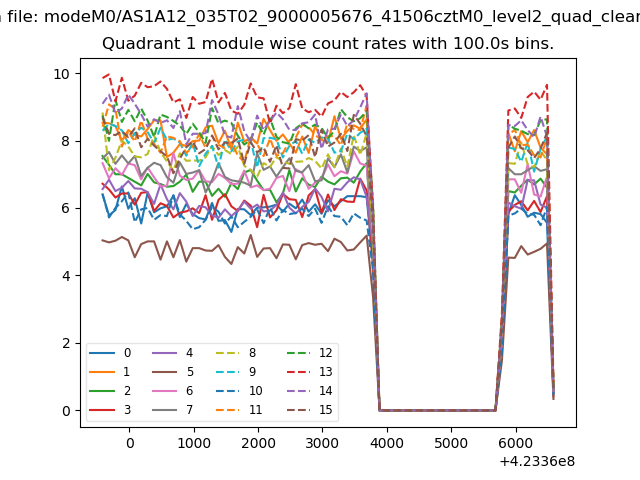
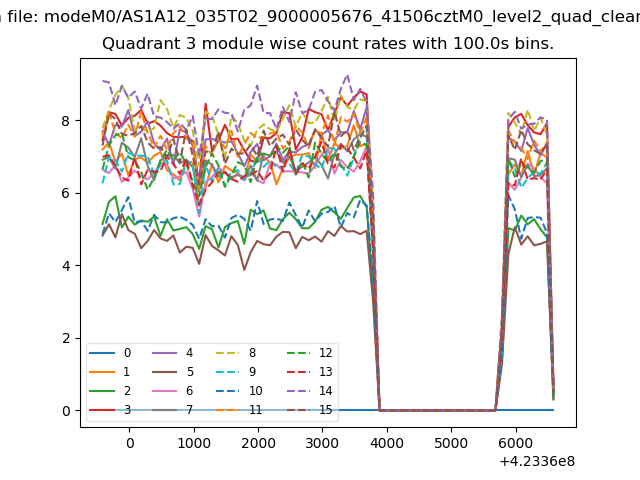
| Module-wise count rates for Quadrant A Data is divided into 100 sec bins |
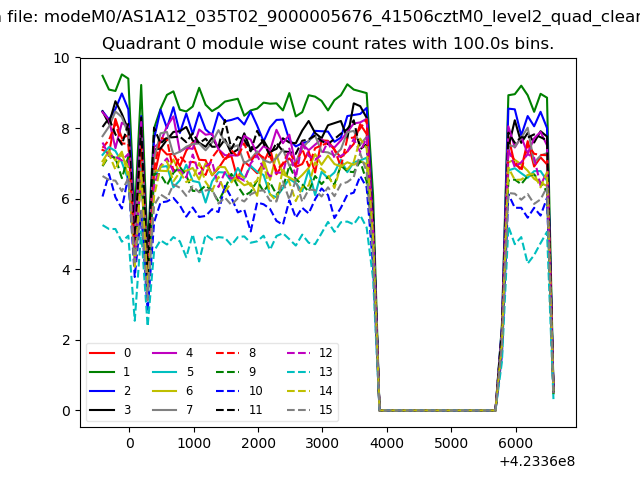 |
 |
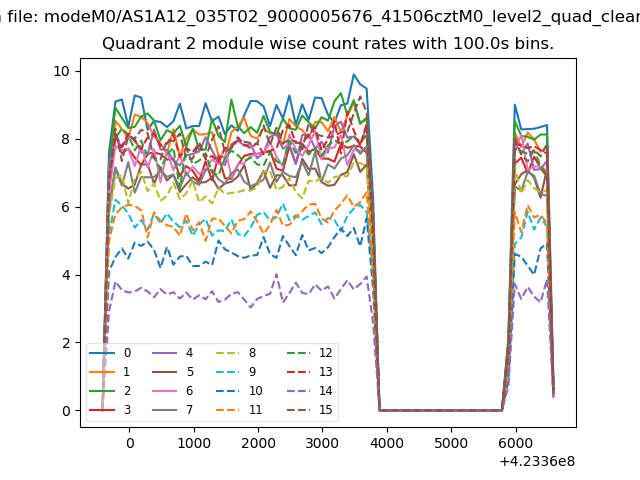
| Module-wise count rates for Quadrant B Data is divided into 100 sec bins |
 |
 |
| Module-wise count rates for Quadrant C Data is divided into 100 sec bins |
 |
 |
| Module-wise count rates for Quadrant D Data is divided into 100 sec bins |
 |
 |
| Parameter | Plot |
|---|---|
| CZT HV Monitor | 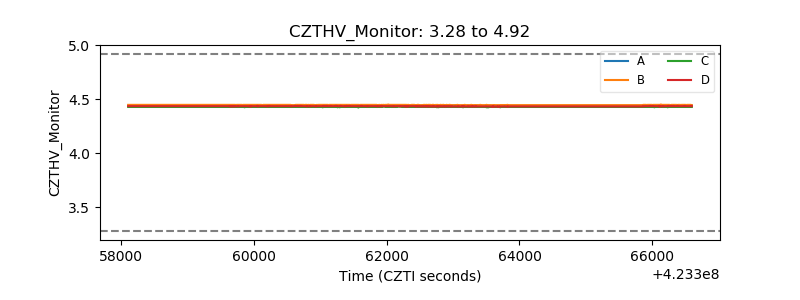 |
| D_VDD | 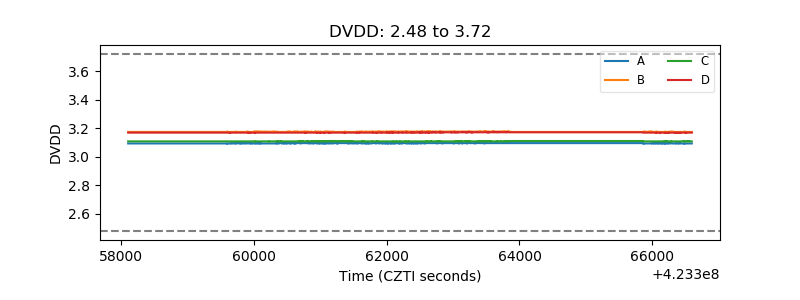 |
| Temperature 1 | 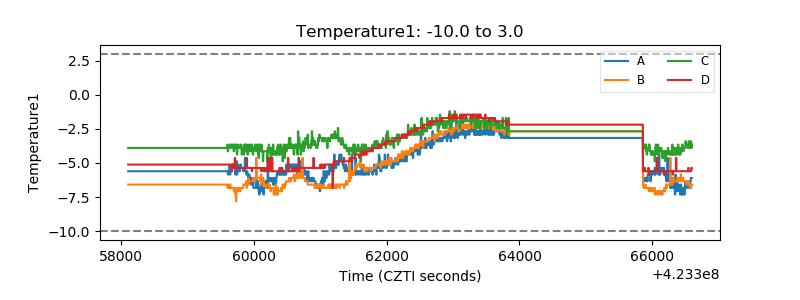 |
| Veto HV Monitor | 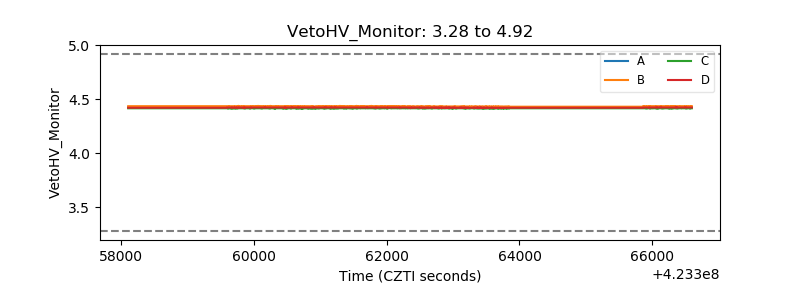 |
| Veto LLD | 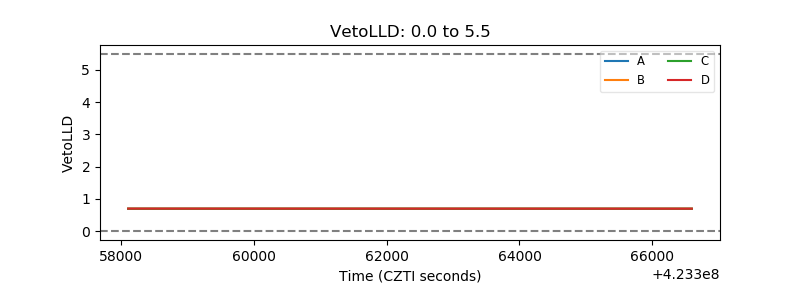 |
| Alpha Counter | 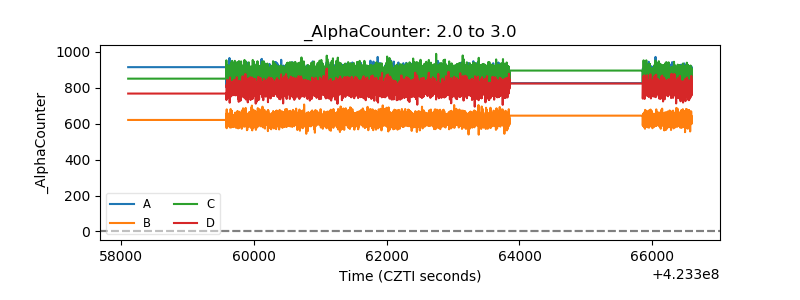 |
| _CPM_Rate | 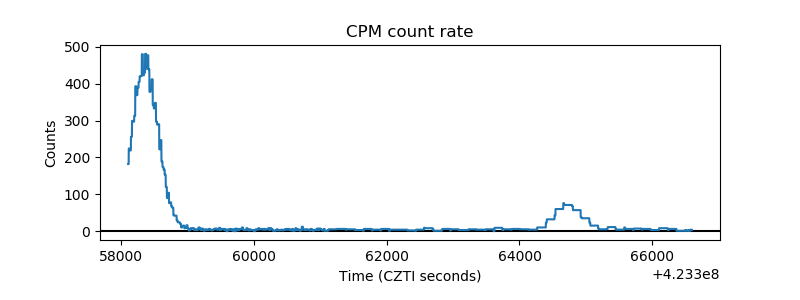 |
| CZT Counter | 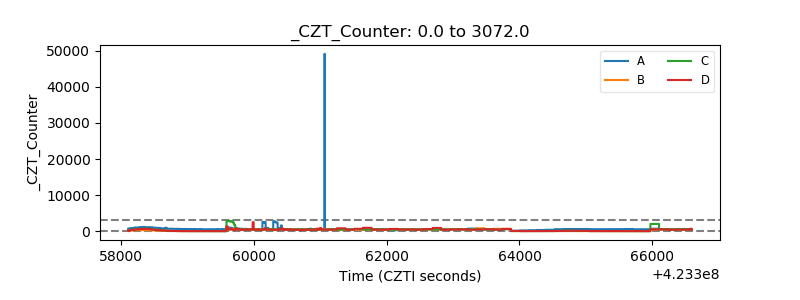 |
| +2.5 Volts monitor | 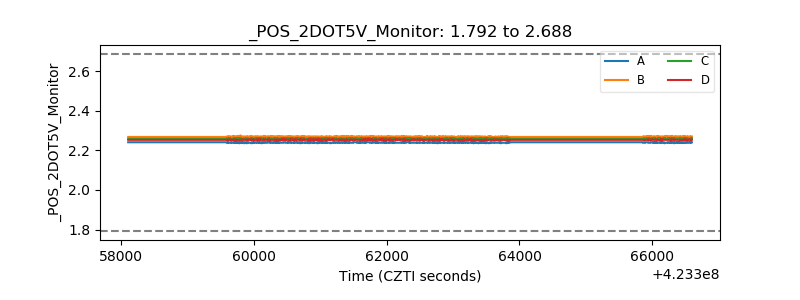 |
| +5 Volts monitor | 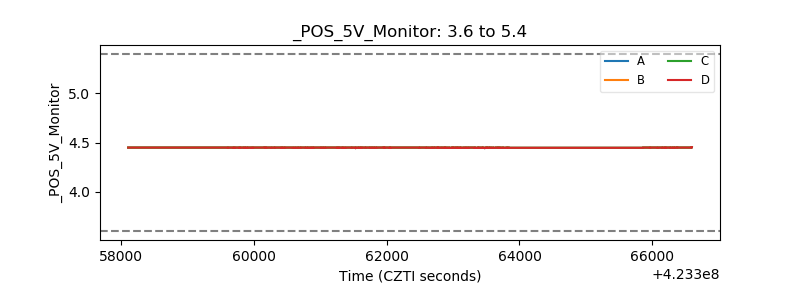 |
| _ROLL_ROT | 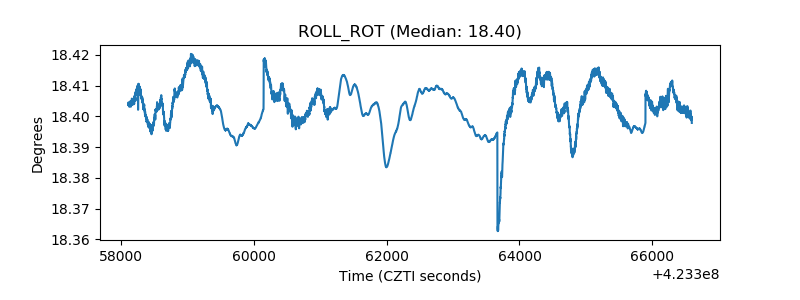 |
| _Roll_DEC | 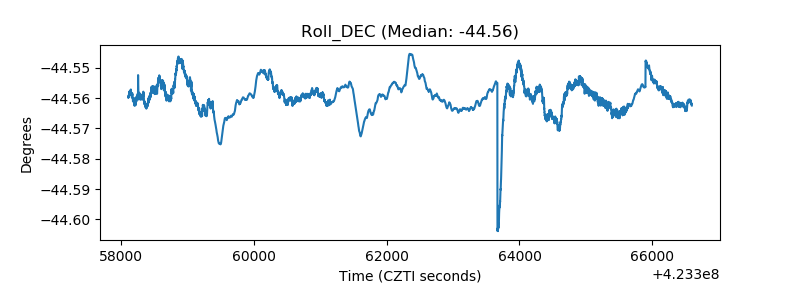 |
| _Roll_RA | 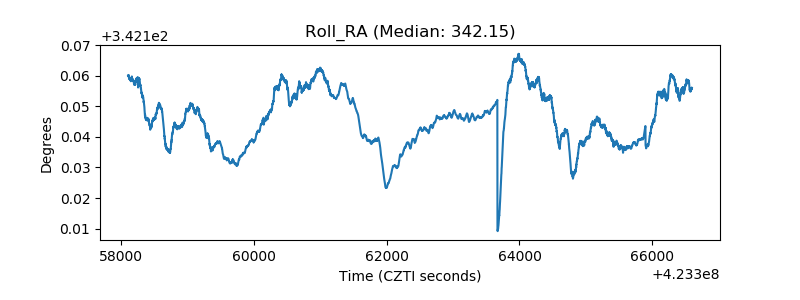 |
| Veto Counter | 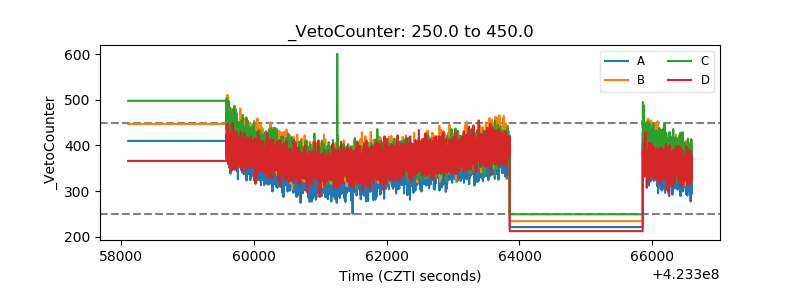 |