| Param | Original file | Final file |
|---|---|---|
| Filename | modeM0/AS1A12_035T02_9000005676_41507cztM0_level2.fits | modeM0/AS1A12_035T02_9000005676_41507cztM0_level2_quad_clean.evt |
| Size (bytes) | 316,647,360 | 88,876,800 |
| Size | 302.0 MB | 84.8 MB |
| Events in quadrant A | 2,966,871 | 595,411 |
| Events in quadrant B | 2,547,800 | 611,085 |
| Events in quadrant C | 3,083,932 | 564,351 |
| Events in quadrant D | 2,701,356 | 541,572 |
| Mode SS | |||
|---|---|---|---|
| Quadrant | BADHDUFLAG | Total packets | Discarded packets |
| A | 0 | 112 | 0 |
| B | 0 | 112 | 0 |
| C | 0 | 112 | 0 |
| D | 0 | 112 | 0 |
| Mode M0 | |||
|---|---|---|---|
| Quadrant | BADHDUFLAG | Total packets | Discarded packets |
| A | 0 | 12188 | 3 |
| B | 0 | 11454 | 2 |
| C | 0 | 12541 | 2 |
| D | 0 | 11882 | 2 |
| Mode M9 | |||
|---|---|---|---|
| Quadrant | BADHDUFLAG | Total packets | Discarded packets |
| A | 0 | 27 | 0 |
| B | 0 | 27 | 0 |
| C | 0 | 27 | 0 |
| D | 0 | 28 | 0 |
| Quadrant | Total seconds | Saturated seconds | Saturation percentage |
|---|---|---|---|
| A | 5404 | 17 | 0.314582% |
| B | 5404 | 19 | 0.351591% |
| C | 5404 | 222 | 4.108068% |
| D | 5404 | 42 | 0.777202% |
Noise dominated data is calculated using 1-second bins in cleaned event files. If a bin has >2000 counts, and if more than 50% of those come from <1% of pixels, then it is considered to be noise-dominated and hence unusable.
| Quadrant | # 1 sec bins | Bins with >0 counts | Bins with >2000 counts | High rate bins dominated by noise | Noise dominated (total time) | Noise dominated (detector-on time) | Marked lightcurve |
|---|---|---|---|---|---|---|---|
| A | 7077 | 5405 | 9 | 9 | 0.13% | 0.17% | 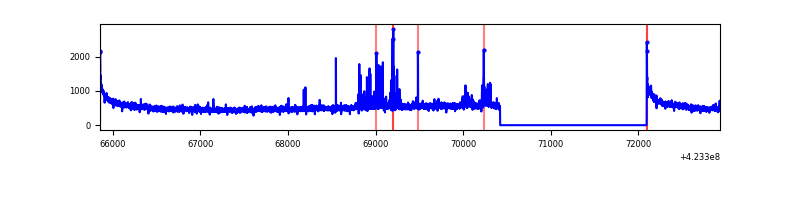 |
| B | 7077 | 5405 | 5 | 5 | 0.07% | 0.09% | 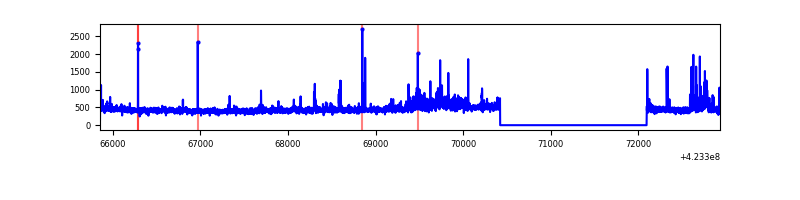 |
| C | 7077 | 5405 | 220 | 220 | 3.11% | 4.07% | 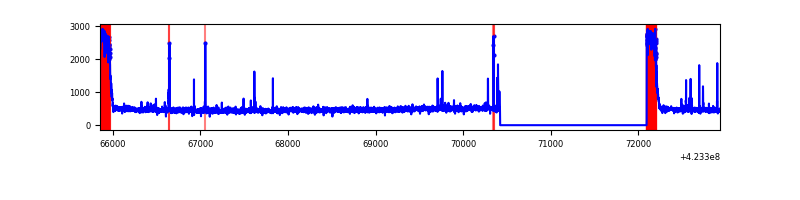 |
| D | 7077 | 5405 | 42 | 42 | 0.59% | 0.78% | 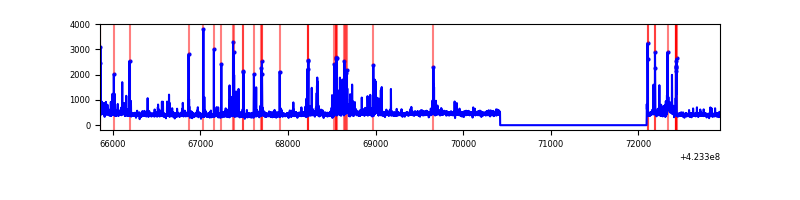 |
Top three noisy pixels from each quadrant. If the there are fewer than three noisy pixels in the level2.evt file, extra rows are filled as -1
| Pixel properties | Quadrant properties | ||||||
|---|---|---|---|---|---|---|---|
| Quadrant | DetID | PixID | Counts | Sigma | Mean | Median | Sigma |
| A | 10 | 83 | 528458 | 4294.93 | 590 | 578 | 122.9 |
| A | 0 | 8 | 118124 | 956.38 | 590 | 578 | 122.9 |
| A | 2 | 79 | 24422 | 194.0 | 590 | 578 | 122.9 |
| B | 0 | 190 | 114543 | 1005.24 | 584 | 568 | 113.4 |
| B | 5 | 255 | 99546 | 872.97 | 584 | 568 | 113.4 |
| B | 0 | 245 | 28133 | 243.12 | 584 | 568 | 113.4 |
| C | 0 | 10 | 575937 | 4344.52 | 567 | 571 | 132.4 |
| C | 15 | 214 | 225755 | 1700.34 | 567 | 571 | 132.4 |
| C | 14 | 254 | 45672 | 340.55 | 567 | 571 | 132.4 |
| D | 12 | 16 | 87778 | 616.68 | 581 | 565 | 141.4 |
| D | 2 | 249 | 75262 | 528.18 | 581 | 565 | 141.4 |
| D | 12 | 128 | 74361 | 521.81 | 581 | 565 | 141.4 |
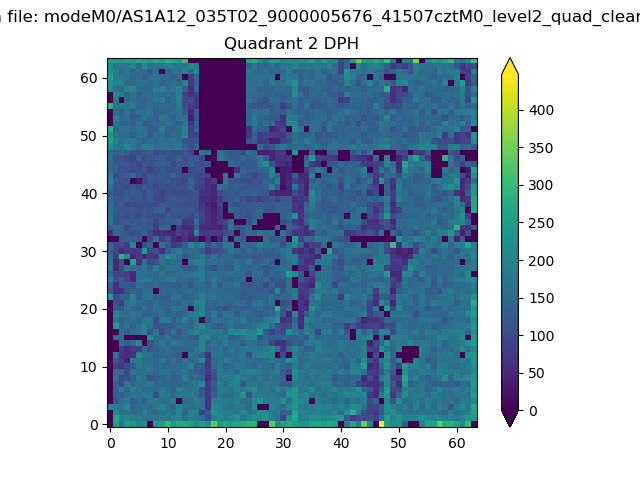
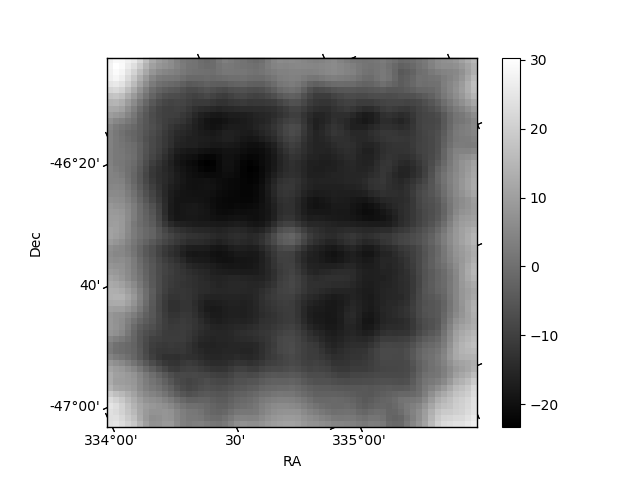
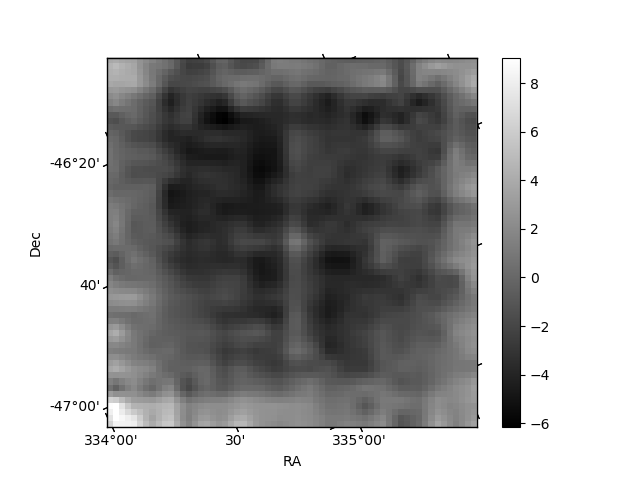
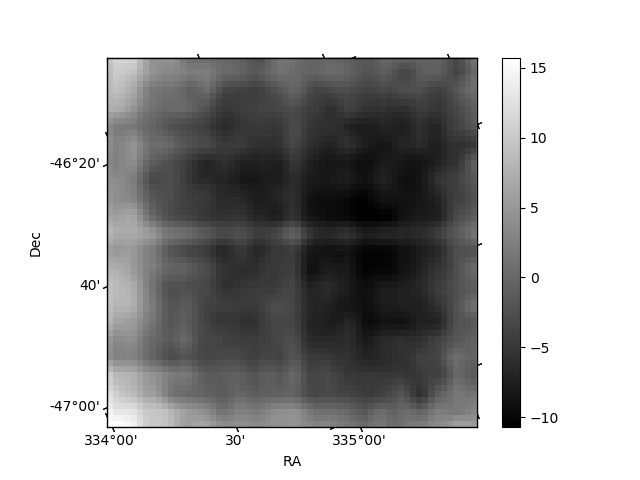
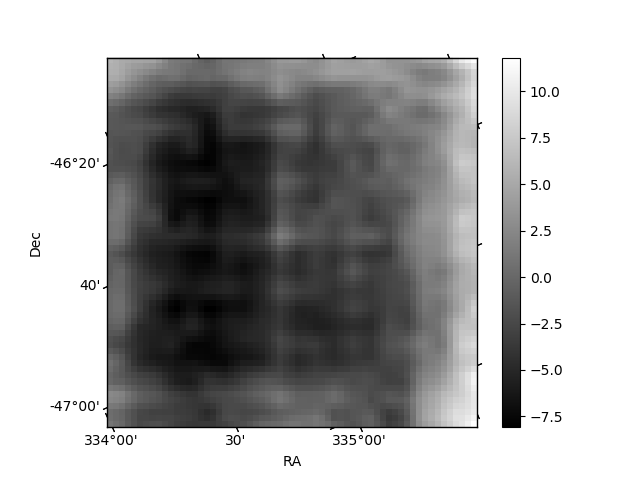
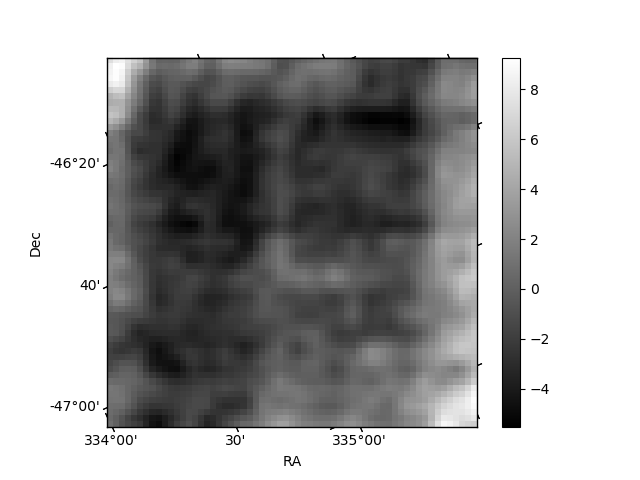
Histogram calculated using DETX and DETY for each event in the final _common_clean file
| Quadrant A | 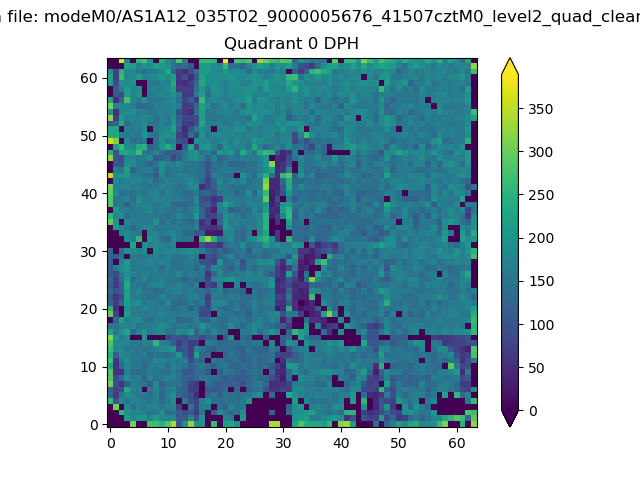 |
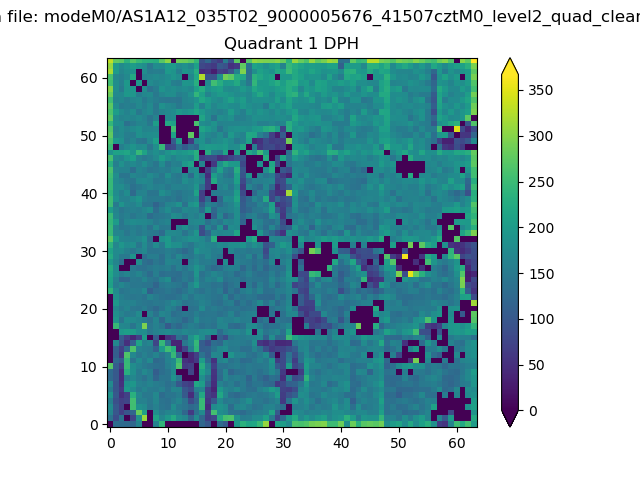 |
Quadrant B |
|---|---|---|---|
| Quadrant D | 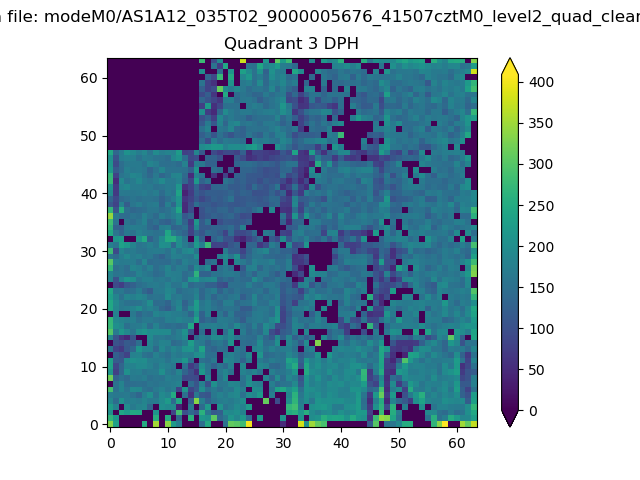 |
 |
Quadrant C |
| Plot type | Count rate plots | Images |
|---|---|---|
| Comparison with Poisson distribution Blue bars denote a histogram of data divided into 1 sec bins. Red curve is a Poisson curve with rate = median count rate of data. |
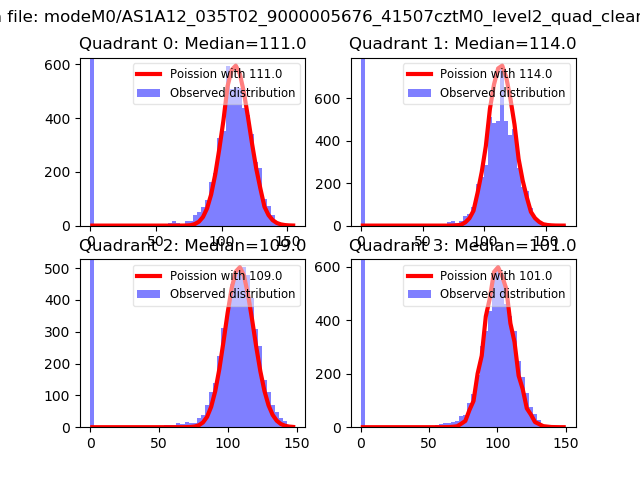 |
 |
| Quadrant-wise count rates Data is divided into 100 sec bins |
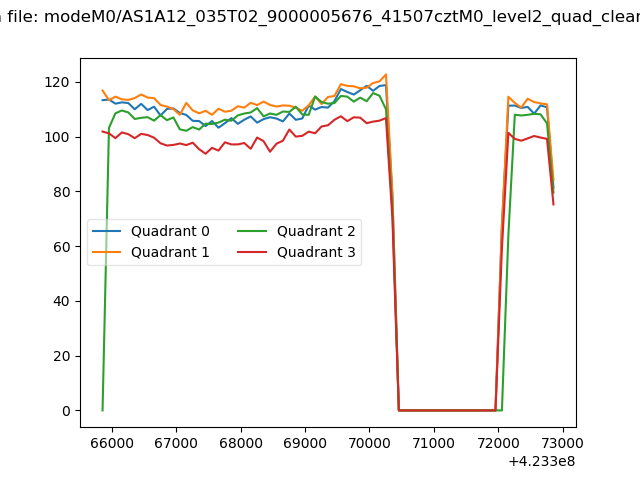 |
|
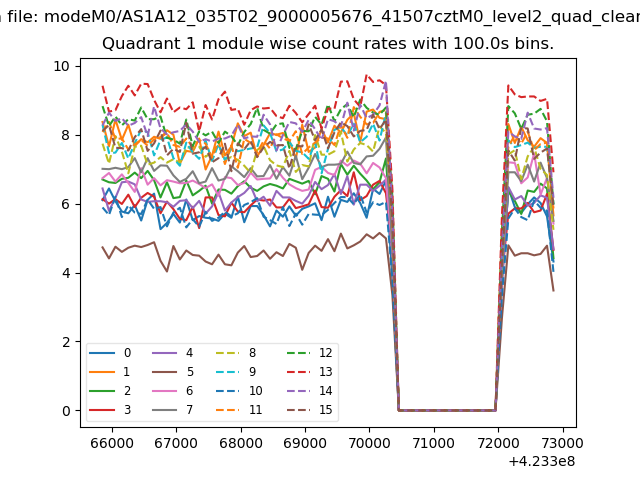
| Module-wise count rates for Quadrant A Data is divided into 100 sec bins |
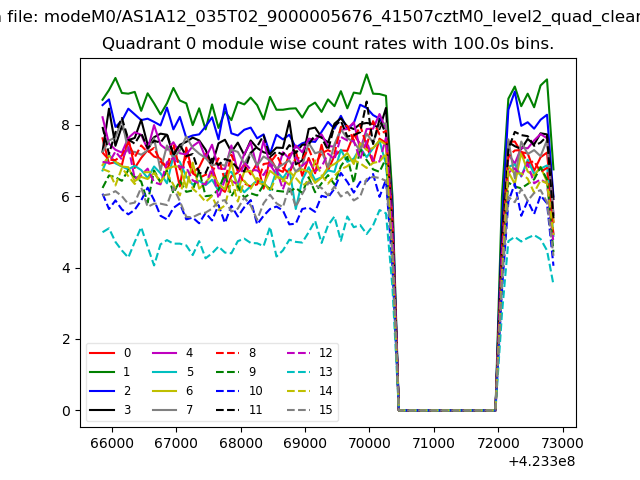 |
 |
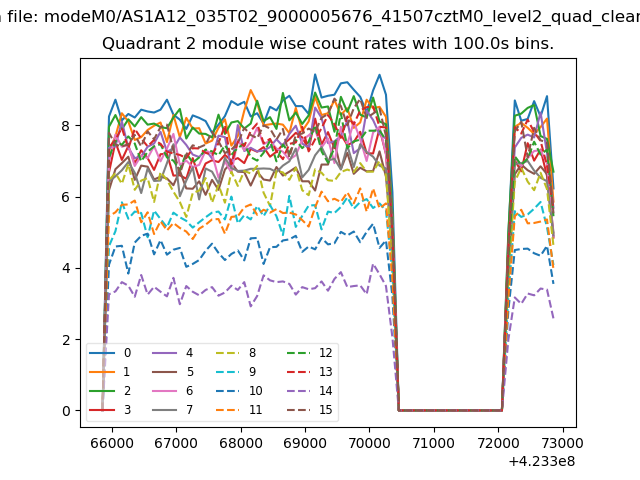
| Module-wise count rates for Quadrant B Data is divided into 100 sec bins |
 |
 |
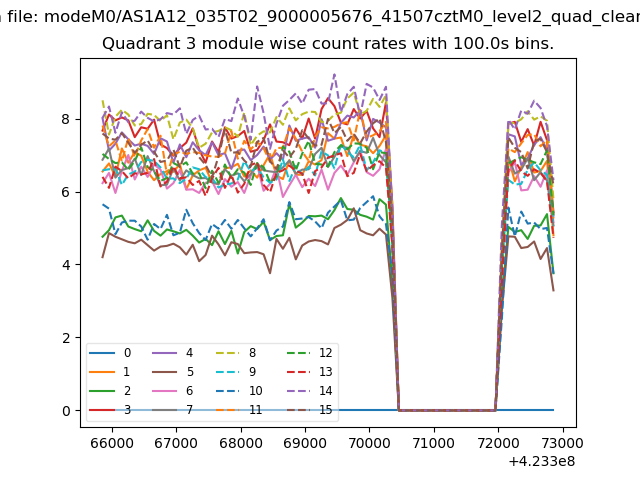
| Module-wise count rates for Quadrant C Data is divided into 100 sec bins |
 |
 |
| Module-wise count rates for Quadrant D Data is divided into 100 sec bins |
 |
 |
| Parameter | Plot |
|---|---|
| CZT HV Monitor | 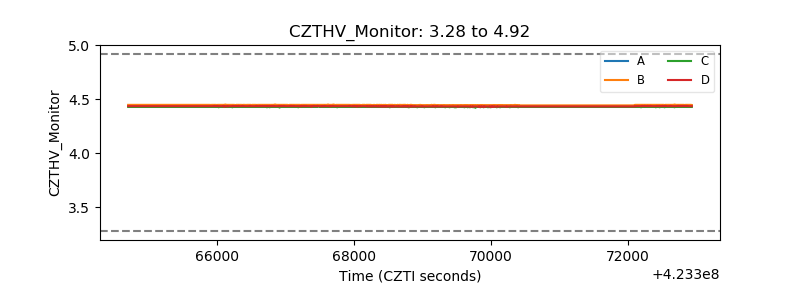 |
| D_VDD | 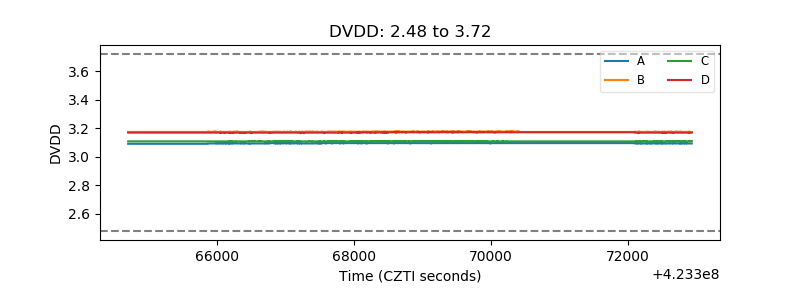 |
| Temperature 1 | 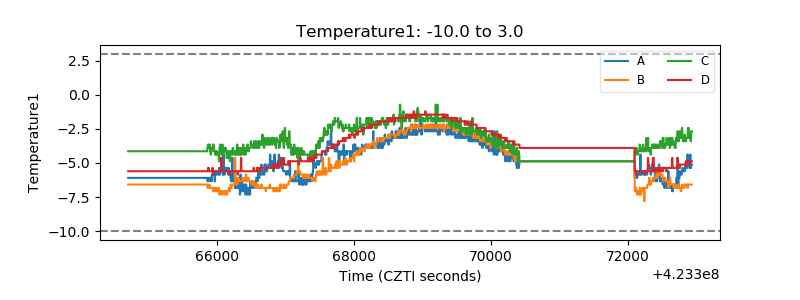 |
| Veto HV Monitor | 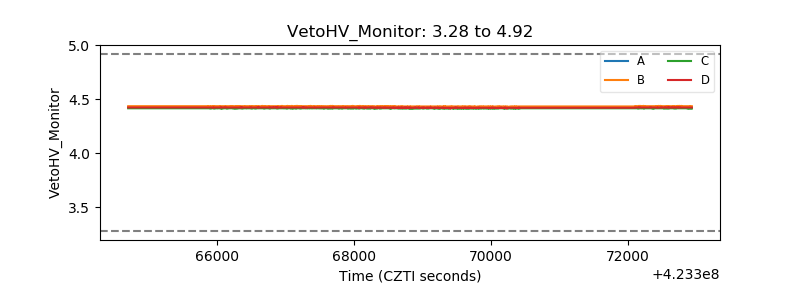 |
| Veto LLD | 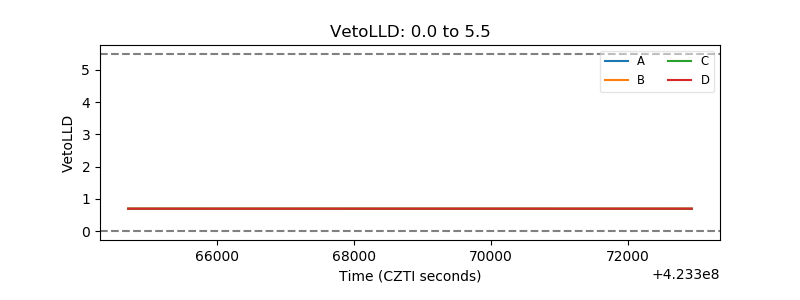 |
| Alpha Counter | 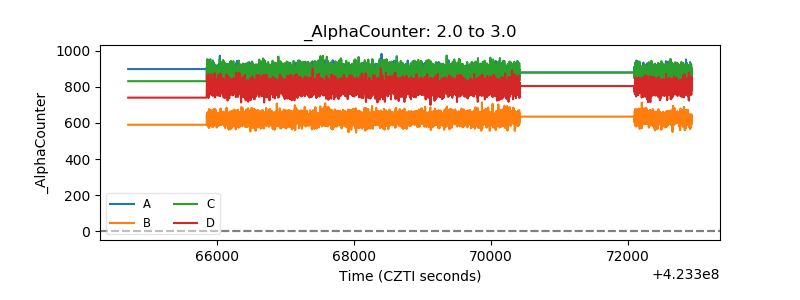 |
| _CPM_Rate | 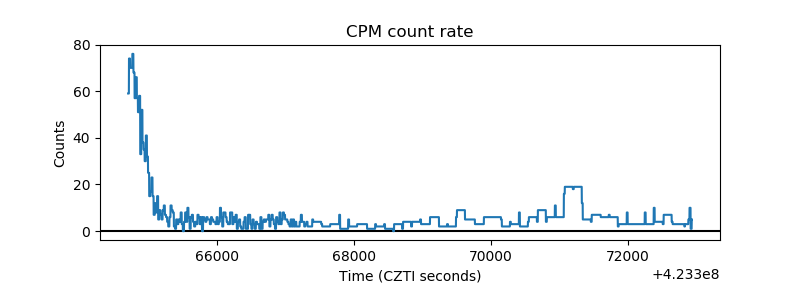 |
| CZT Counter | 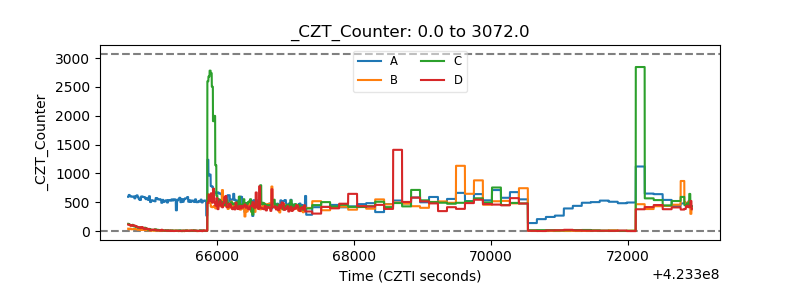 |
| +2.5 Volts monitor | 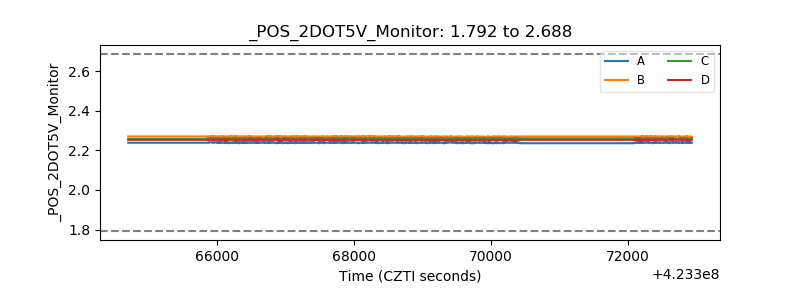 |
| +5 Volts monitor | 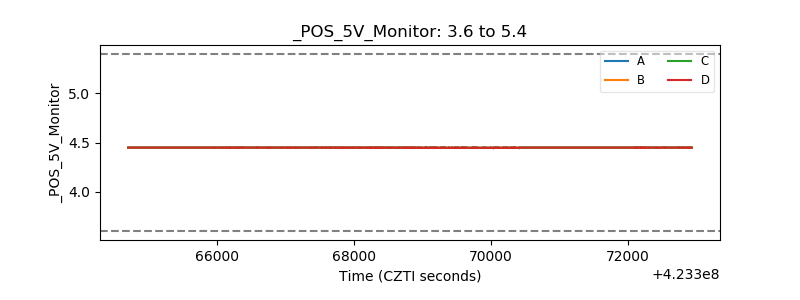 |
| _ROLL_ROT | 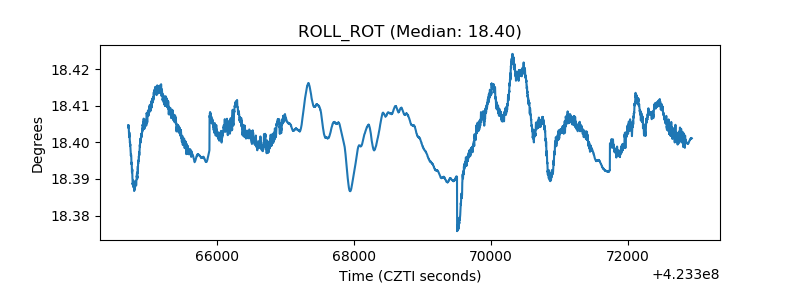 |
| _Roll_DEC | 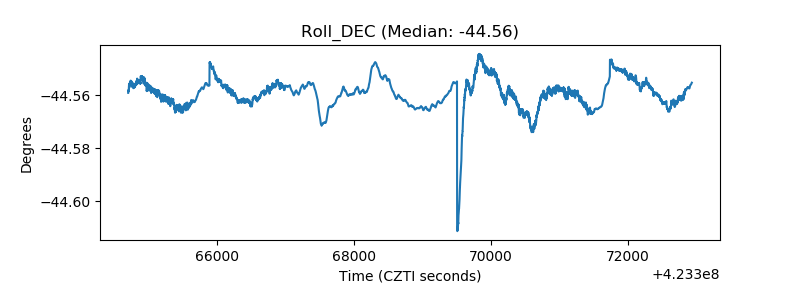 |
| _Roll_RA | 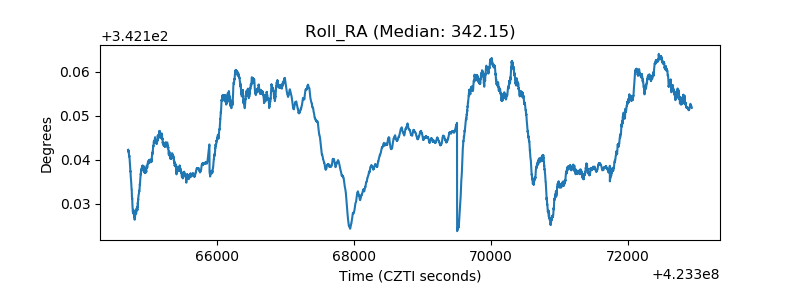 |
| Veto Counter | 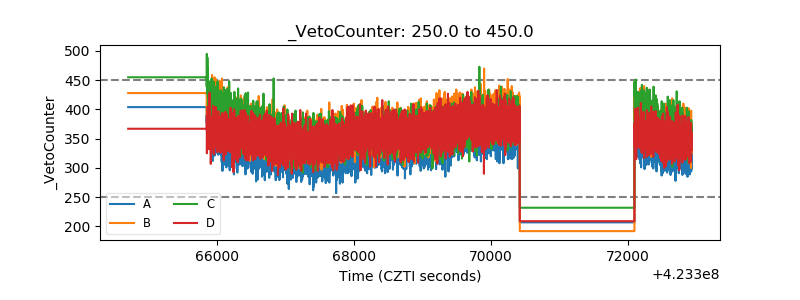 |