| Param | Original file | Final file |
|---|---|---|
| Filename | modeM0/AS1A12_035T02_9000005676_41512cztM0_level2.fits | modeM0/AS1A12_035T02_9000005676_41512cztM0_level2_quad_clean.evt |
| Size (bytes) | 1,535,872,320 | 410,437,440 |
| Size | 1.4 GB | 391.4 MB |
| Events in quadrant A | 14,387,782 | 2,733,959 |
| Events in quadrant B | 12,128,865 | 2,809,329 |
| Events in quadrant C | 13,760,937 | 2,652,361 |
| Events in quadrant D | 14,608,046 | 2,482,260 |
| Mode SS | |||
|---|---|---|---|
| Quadrant | BADHDUFLAG | Total packets | Discarded packets |
| A | 0 | 520 | 0 |
| B | 0 | 520 | 0 |
| C | 0 | 520 | 0 |
| D | 0 | 520 | 0 |
| Mode M0 | |||
|---|---|---|---|
| Quadrant | BADHDUFLAG | Total packets | Discarded packets |
| A | 0 | 57750 | 7 |
| B | 0 | 53553 | 6 |
| C | 0 | 57024 | 6 |
| D | 0 | 61206 | 6 |
| Mode M9 | |||
|---|---|---|---|
| Quadrant | BADHDUFLAG | Total packets | Discarded packets |
| A | 0 | 69 | 0 |
| B | 0 | 69 | 0 |
| C | 0 | 69 | 0 |
| D | 0 | 70 | 0 |
| Quadrant | Total seconds | Saturated seconds | Saturation percentage |
|---|---|---|---|
| A | 25423 | 278 | 1.093498% |
| B | 25423 | 77 | 0.302875% |
| C | 25423 | 642 | 2.525272% |
| D | 25423 | 545 | 2.143728% |
Noise dominated data is calculated using 1-second bins in cleaned event files. If a bin has >2000 counts, and if more than 50% of those come from <1% of pixels, then it is considered to be noise-dominated and hence unusable.
| Quadrant | # 1 sec bins | Bins with >0 counts | Bins with >2000 counts | High rate bins dominated by noise | Noise dominated (total time) | Noise dominated (detector-on time) | Marked lightcurve |
|---|---|---|---|---|---|---|---|
| A | 32377 | 25428 | 235 | 235 | 0.73% | 0.92% | 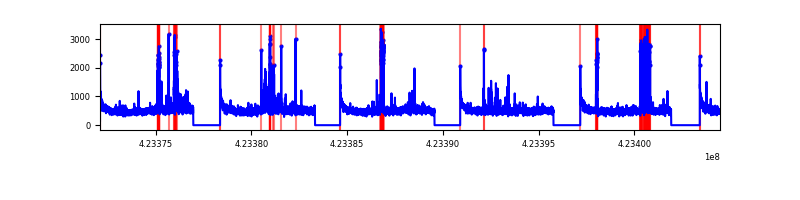 |
| B | 32377 | 25428 | 33 | 33 | 0.10% | 0.13% | 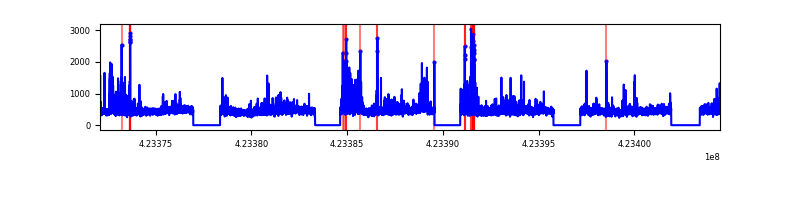 |
| C | 32377 | 25428 | 627 | 627 | 1.94% | 2.47% | 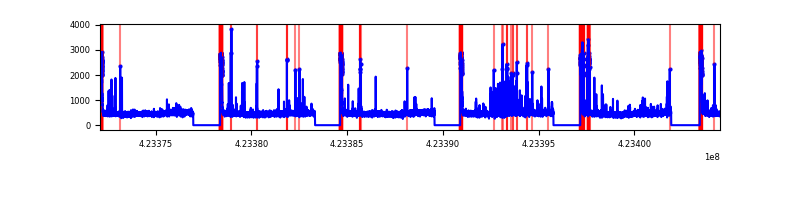 |
| D | 32377 | 25428 | 486 | 486 | 1.50% | 1.91% | 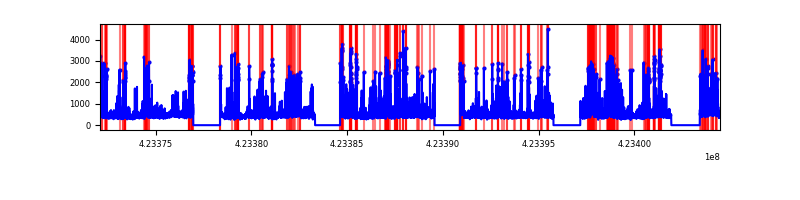 |
Top three noisy pixels from each quadrant. If the there are fewer than three noisy pixels in the level2.evt file, extra rows are filled as -1
| Pixel properties | Quadrant properties | ||||||
|---|---|---|---|---|---|---|---|
| Quadrant | DetID | PixID | Counts | Sigma | Mean | Median | Sigma |
| A | 10 | 83 | 2154131 | 3773.05 | 2793 | 2732 | 570.2 |
| A | 0 | 8 | 845684 | 1478.34 | 2793 | 2732 | 570.2 |
| A | 13 | 248 | 441831 | 770.08 | 2793 | 2732 | 570.2 |
| B | 5 | 255 | 615346 | 1155.01 | 2772 | 2698 | 530.4 |
| B | 0 | 190 | 436613 | 818.05 | 2772 | 2698 | 530.4 |
| B | 12 | 111 | 69256 | 125.48 | 2772 | 2698 | 530.4 |
| C | 0 | 10 | 1335998 | 2151.5 | 2690 | 2706 | 619.7 |
| C | 15 | 214 | 1050166 | 1690.26 | 2690 | 2706 | 619.7 |
| C | 14 | 254 | 765936 | 1231.61 | 2690 | 2706 | 619.7 |
| D | 1 | 52 | 1064885 | 1603.86 | 2720 | 2647 | 662.3 |
| D | 2 | 249 | 683799 | 1028.46 | 2720 | 2647 | 662.3 |
| D | 12 | 128 | 554363 | 833.03 | 2720 | 2647 | 662.3 |
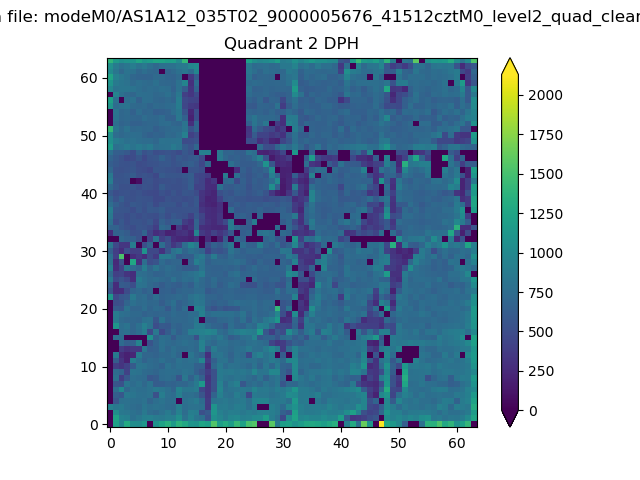
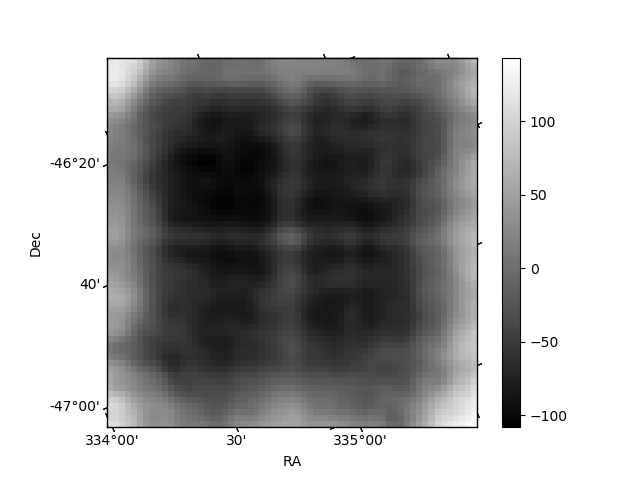
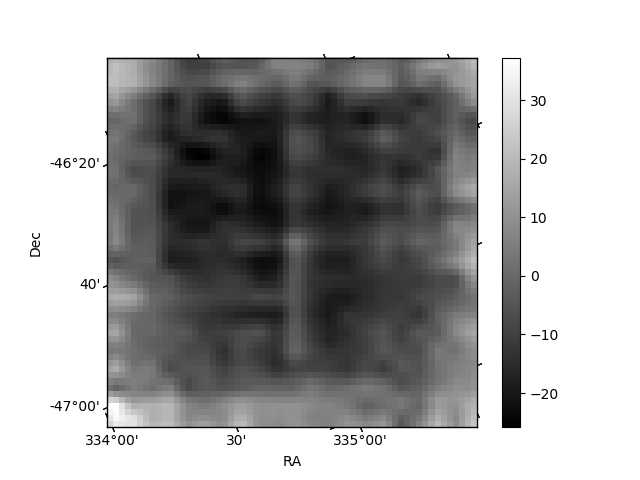
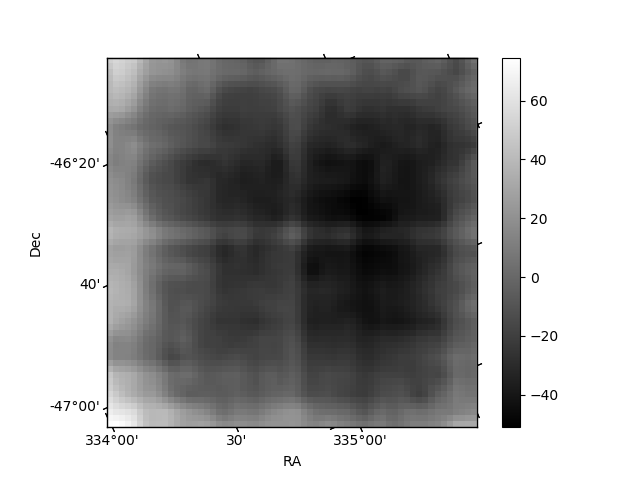
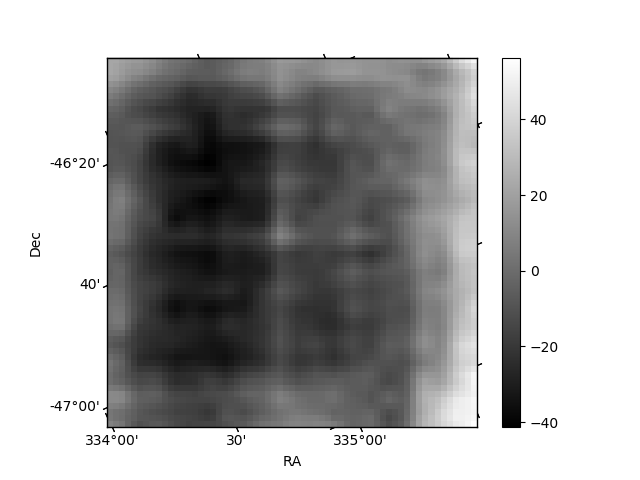
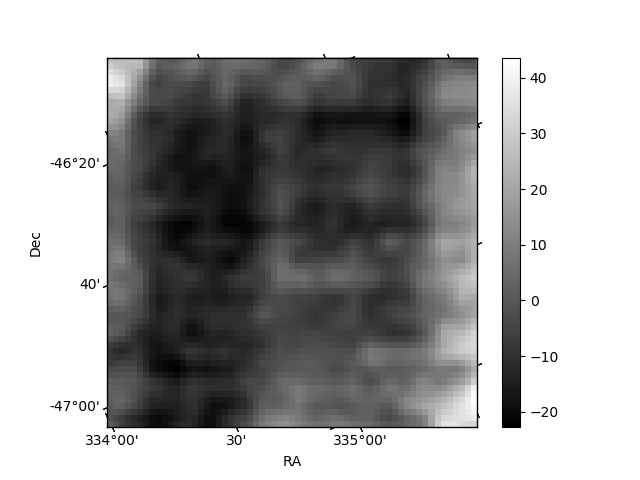
Histogram calculated using DETX and DETY for each event in the final _common_clean file
| Quadrant A | 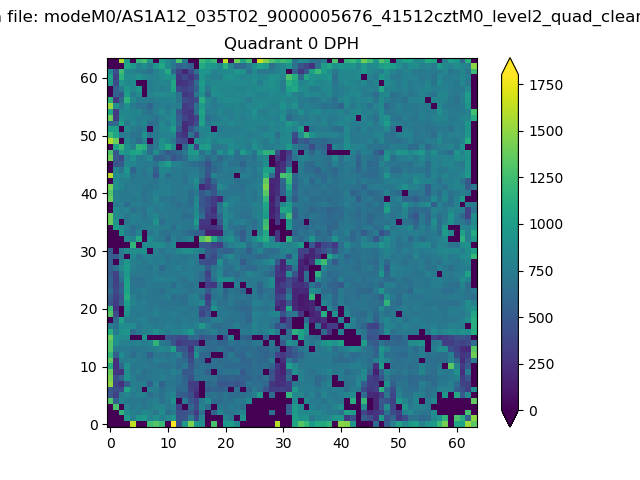 |
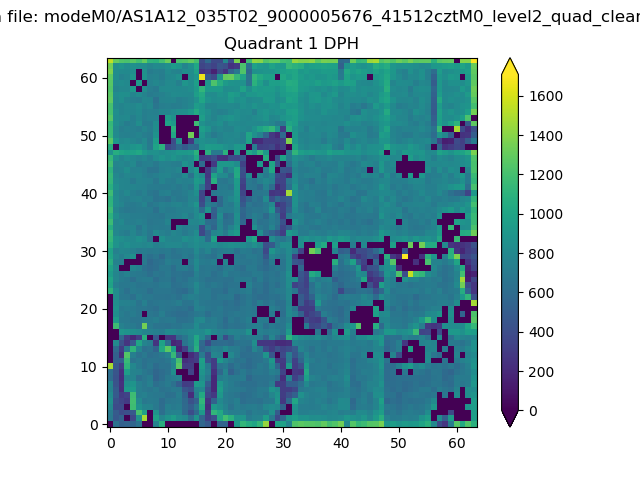 |
Quadrant B |
|---|---|---|---|
| Quadrant D | 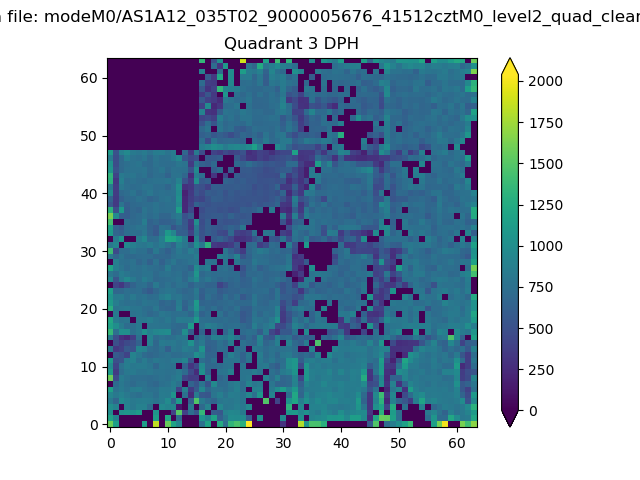 |
 |
Quadrant C |
| Plot type | Count rate plots | Images |
|---|---|---|
| Comparison with Poisson distribution Blue bars denote a histogram of data divided into 1 sec bins. Red curve is a Poisson curve with rate = median count rate of data. |
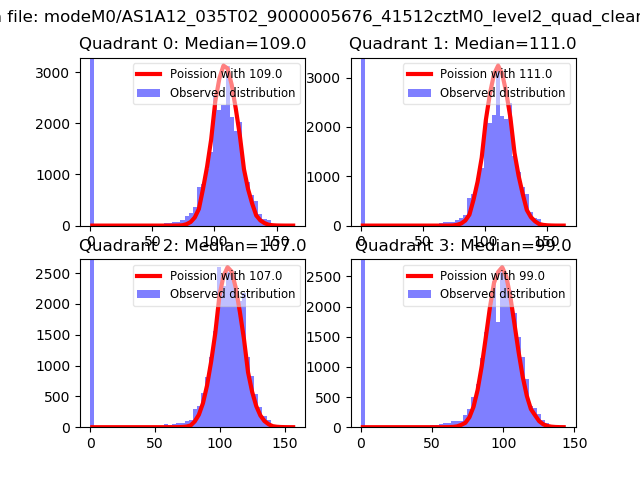 |
 |
| Quadrant-wise count rates Data is divided into 100 sec bins |
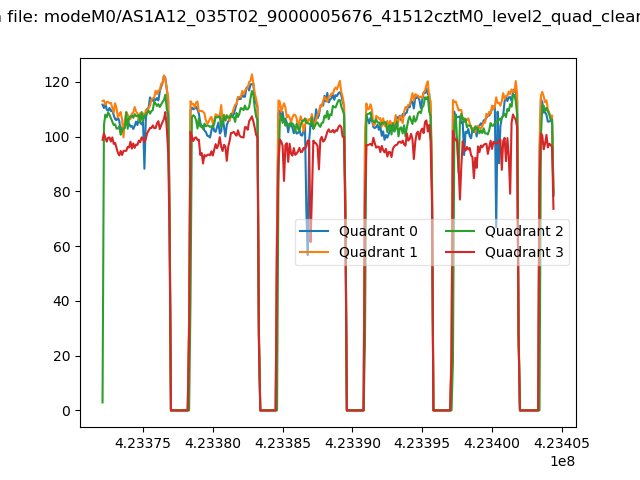 |
|
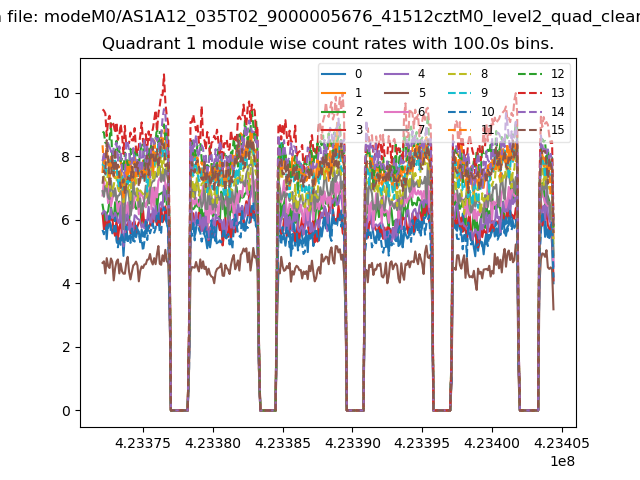
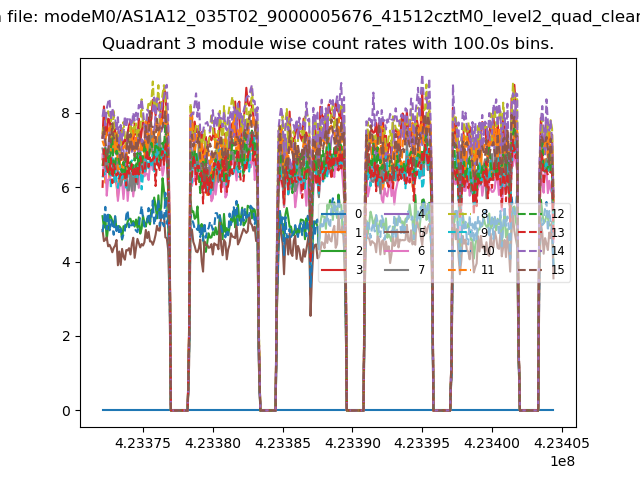
| Module-wise count rates for Quadrant A Data is divided into 100 sec bins |
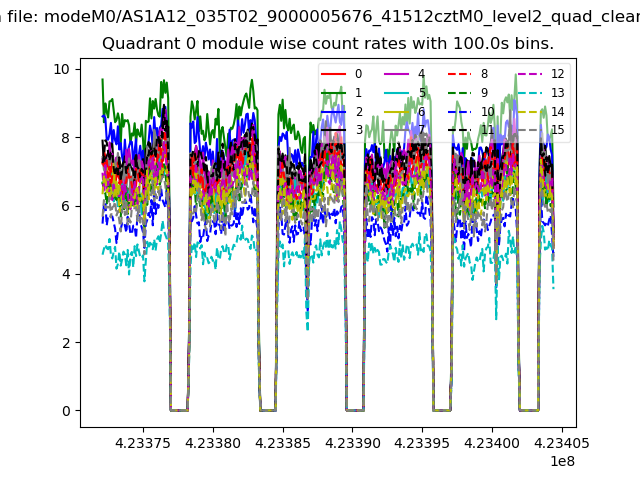 |
 |
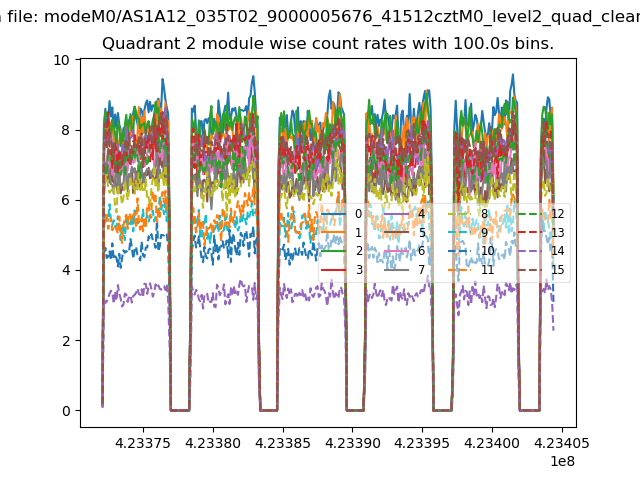
| Module-wise count rates for Quadrant B Data is divided into 100 sec bins |
 |
 |
| Module-wise count rates for Quadrant C Data is divided into 100 sec bins |
 |
 |
| Module-wise count rates for Quadrant D Data is divided into 100 sec bins |
 |
 |
| Parameter | Plot |
|---|---|
| CZT HV Monitor | 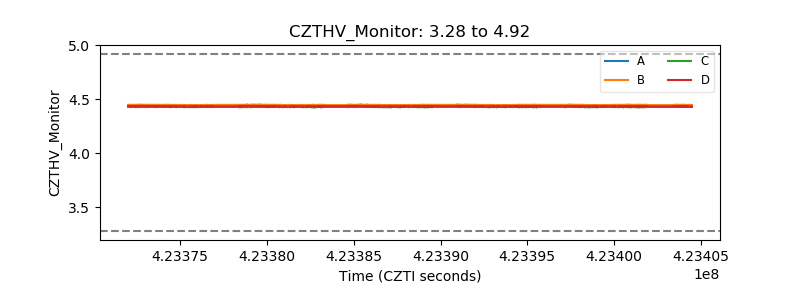 |
| D_VDD | 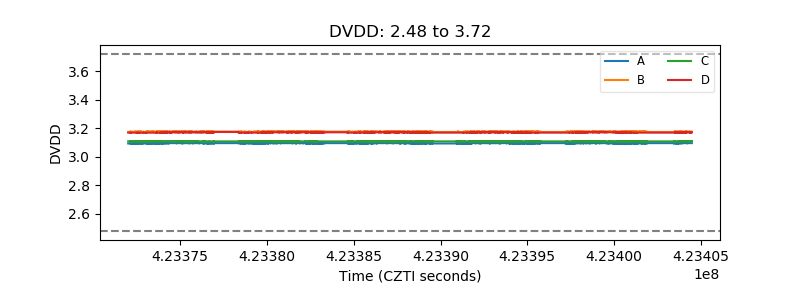 |
| Temperature 1 | 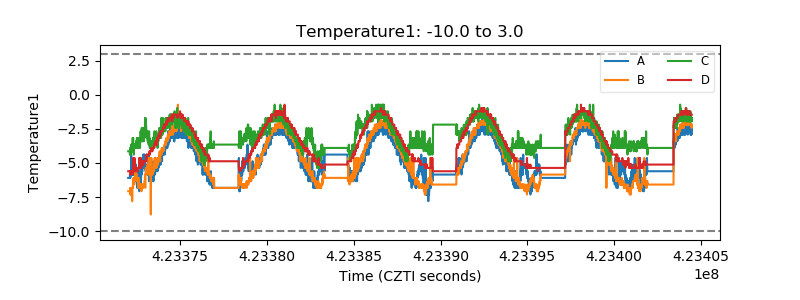 |
| Veto HV Monitor | 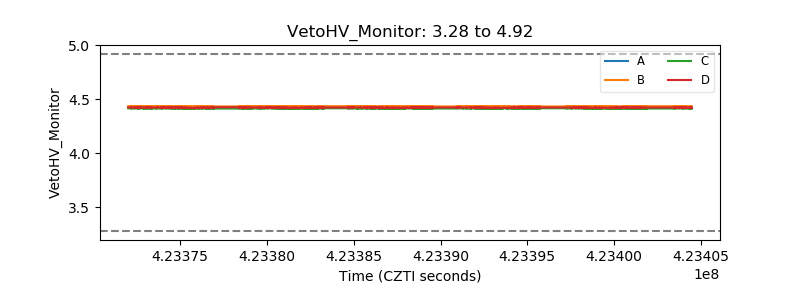 |
| Veto LLD | 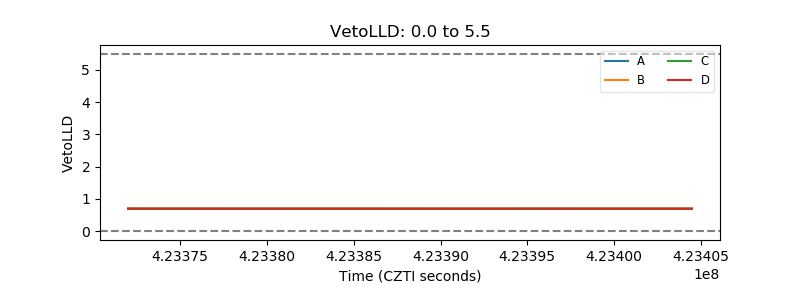 |
| Alpha Counter | 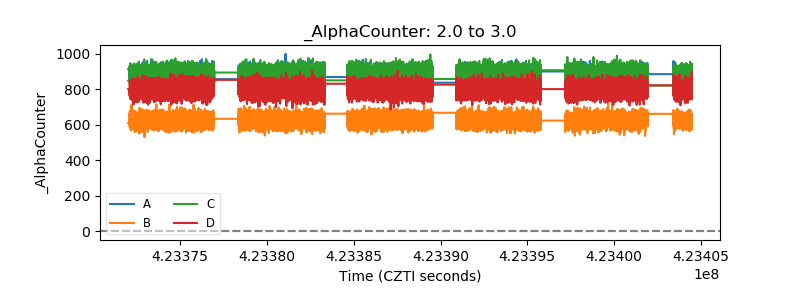 |
| _CPM_Rate | 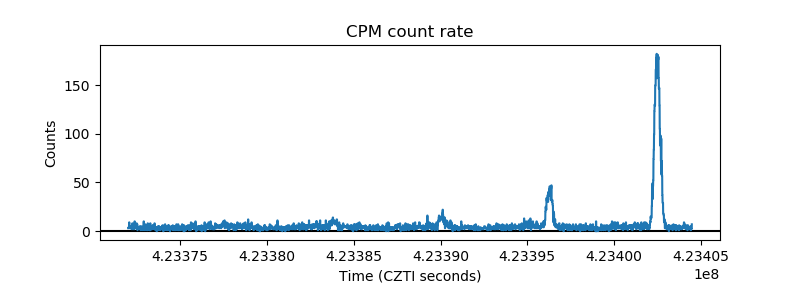 |
| CZT Counter | 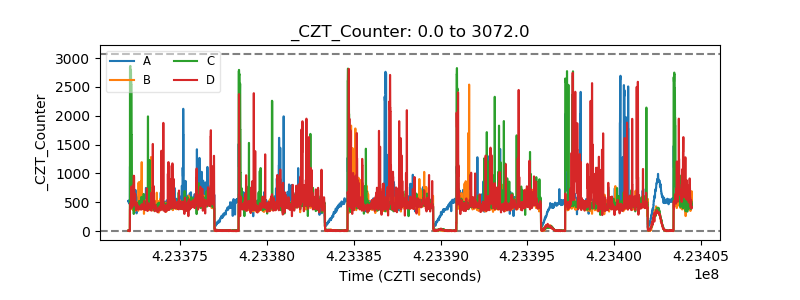 |
| +2.5 Volts monitor | 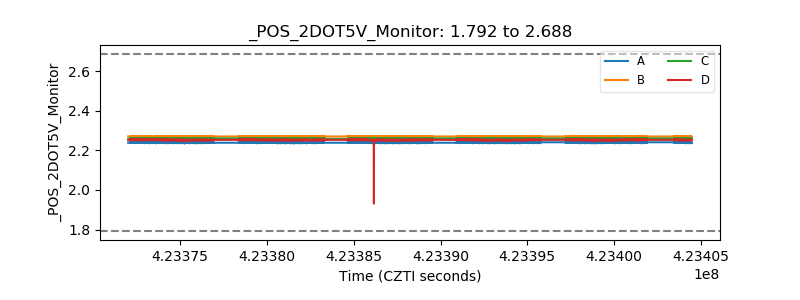 |
| +5 Volts monitor | 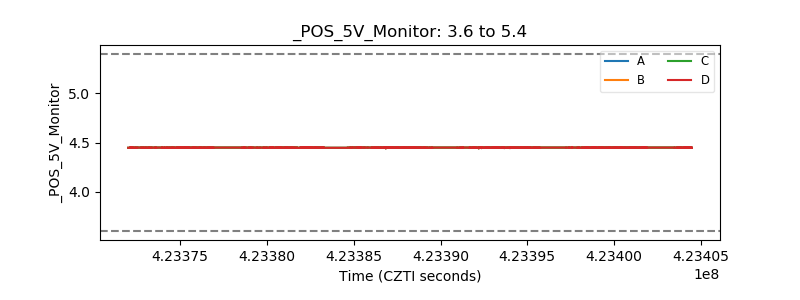 |
| _ROLL_ROT | 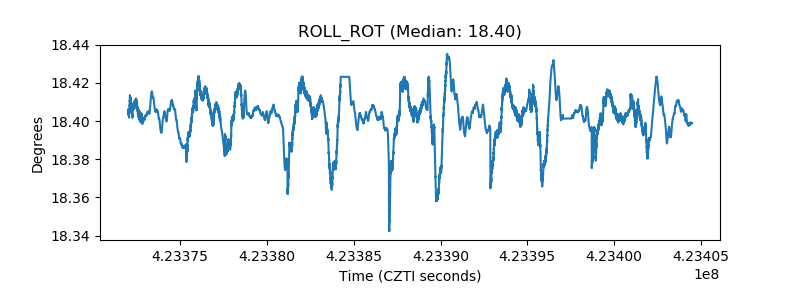 |
| _Roll_DEC | 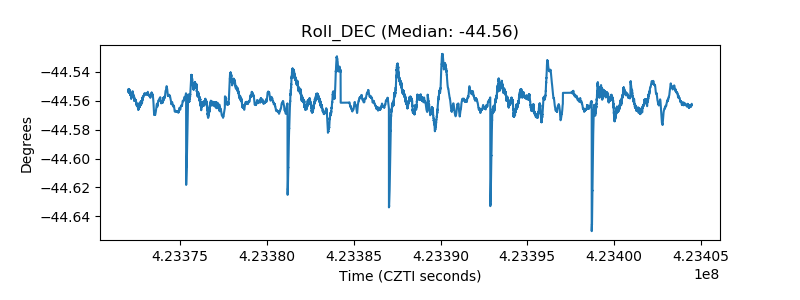 |
| _Roll_RA | 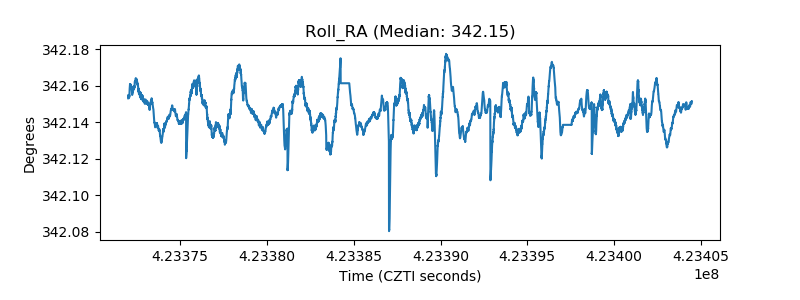 |
| Veto Counter | 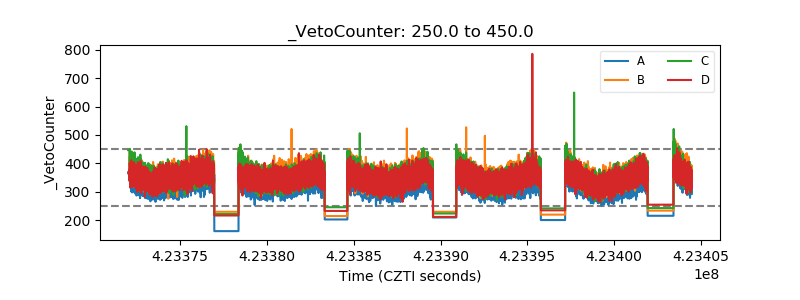 |