| Param | Original file | Final file |
|---|---|---|
| Filename | modeM0/AS1A12_035T02_9000005676_41513cztM0_level2.fits | modeM0/AS1A12_035T02_9000005676_41513cztM0_level2_quad_clean.evt |
| Size (bytes) | 342,552,960 | 90,792,000 |
| Size | 326.7 MB | 86.6 MB |
| Events in quadrant A | 3,004,076 | 614,019 |
| Events in quadrant B | 2,626,517 | 621,074 |
| Events in quadrant C | 3,155,343 | 575,430 |
| Events in quadrant D | 3,460,497 | 549,107 |
| Mode SS | |||
|---|---|---|---|
| Quadrant | BADHDUFLAG | Total packets | Discarded packets |
| A | 0 | 114 | 0 |
| B | 0 | 114 | 0 |
| C | 0 | 114 | 0 |
| D | 0 | 114 | 0 |
| Mode M0 | |||
|---|---|---|---|
| Quadrant | BADHDUFLAG | Total packets | Discarded packets |
| A | 0 | 12284 | 3 |
| B | 0 | 11611 | 2 |
| C | 0 | 12948 | 2 |
| D | 0 | 14193 | 2 |
| Mode M9 | |||
|---|---|---|---|
| Quadrant | BADHDUFLAG | Total packets | Discarded packets |
| A | 0 | 20 | 0 |
| B | 0 | 20 | 0 |
| C | 0 | 20 | 0 |
| D | 0 | 21 | 0 |
| Quadrant | Total seconds | Saturated seconds | Saturation percentage |
|---|---|---|---|
| A | 5566 | 15 | 0.269493% |
| B | 5566 | 13 | 0.233561% |
| C | 5566 | 213 | 3.826806% |
| D | 5566 | 145 | 2.605102% |
Noise dominated data is calculated using 1-second bins in cleaned event files. If a bin has >2000 counts, and if more than 50% of those come from <1% of pixels, then it is considered to be noise-dominated and hence unusable.
| Quadrant | # 1 sec bins | Bins with >0 counts | Bins with >2000 counts | High rate bins dominated by noise | Noise dominated (total time) | Noise dominated (detector-on time) | Marked lightcurve |
|---|---|---|---|---|---|---|---|
| A | 7209 | 5567 | 3 | 3 | 0.04% | 0.05% | 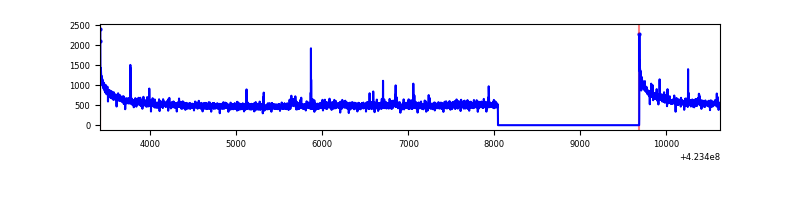 |
| B | 7209 | 5567 | 7 | 7 | 0.10% | 0.13% | 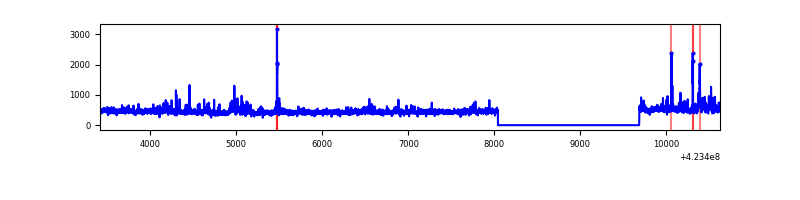 |
| C | 7209 | 5567 | 213 | 213 | 2.95% | 3.83% | 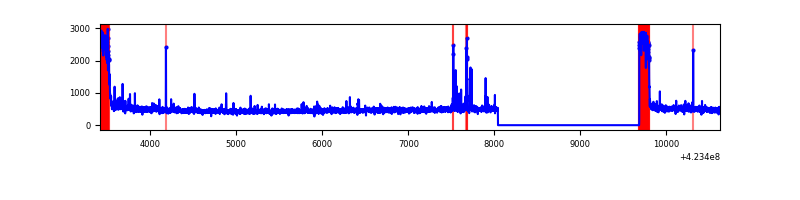 |
| D | 7209 | 5567 | 121 | 121 | 1.68% | 2.17% | 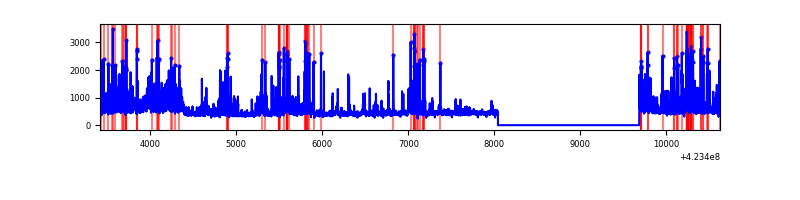 |
Top three noisy pixels from each quadrant. If the there are fewer than three noisy pixels in the level2.evt file, extra rows are filled as -1
| Pixel properties | Quadrant properties | ||||||
|---|---|---|---|---|---|---|---|
| Quadrant | DetID | PixID | Counts | Sigma | Mean | Median | Sigma |
| A | 10 | 83 | 558668 | 4370.27 | 617 | 601 | 127.7 |
| A | 13 | 248 | 17531 | 132.58 | 617 | 601 | 127.7 |
| A | 2 | 79 | 15757 | 118.69 | 617 | 601 | 127.7 |
| B | 0 | 190 | 130525 | 1104.29 | 609 | 593 | 117.7 |
| B | 0 | 245 | 38573 | 322.79 | 609 | 593 | 117.7 |
| B | 0 | 183 | 34228 | 285.86 | 609 | 593 | 117.7 |
| C | 0 | 10 | 538440 | 3934.06 | 582 | 584 | 136.7 |
| C | 15 | 214 | 228853 | 1669.63 | 582 | 584 | 136.7 |
| C | 14 | 254 | 76518 | 555.4 | 582 | 584 | 136.7 |
| D | 1 | 52 | 660286 | 4602.04 | 592 | 576 | 143.4 |
| D | 12 | 233 | 150688 | 1047.16 | 592 | 576 | 143.4 |
| D | 1 | 47 | 83052 | 575.34 | 592 | 576 | 143.4 |
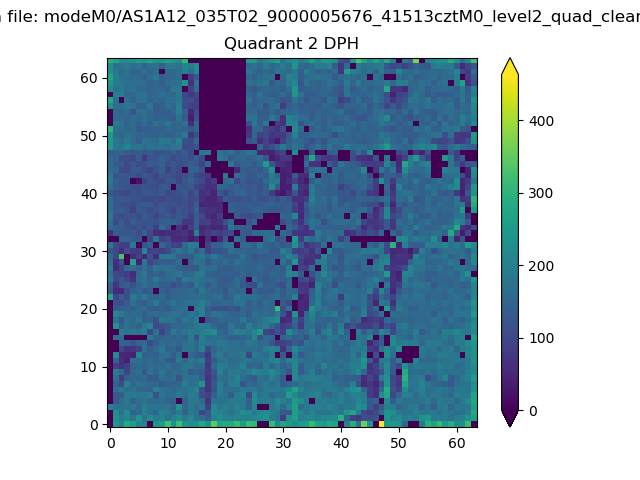
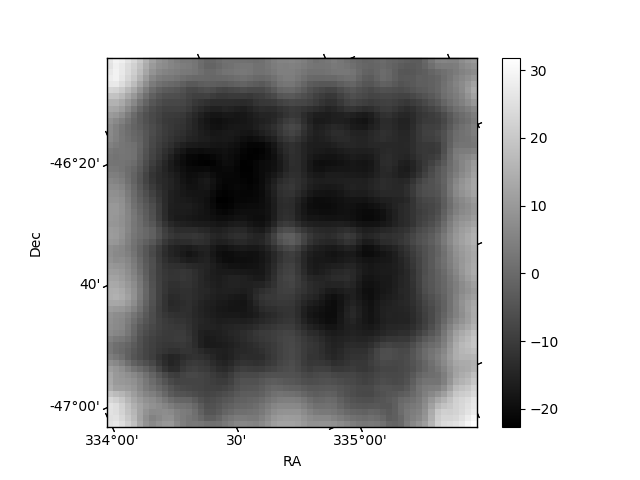
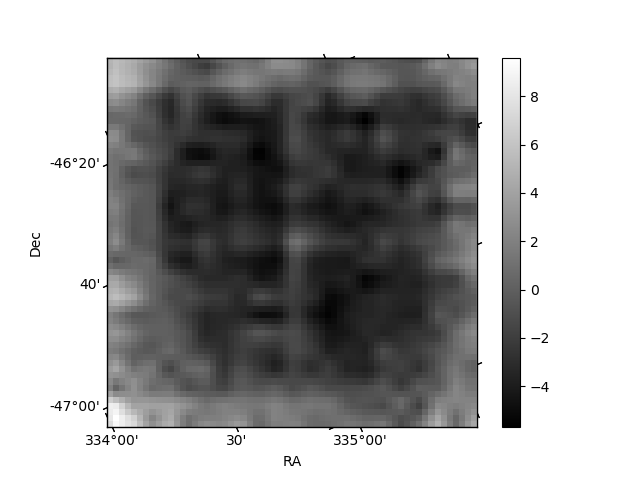
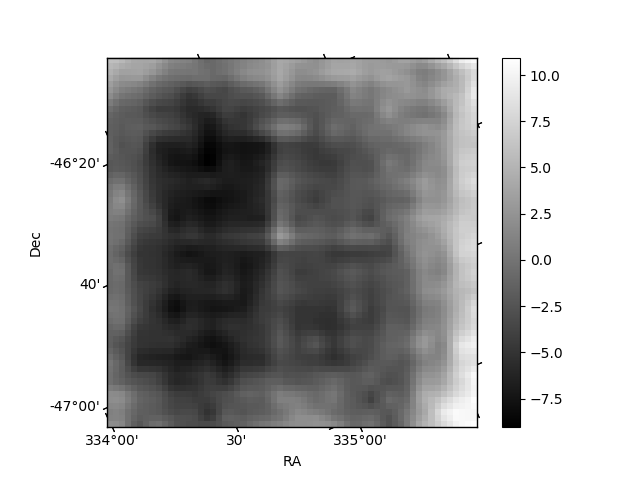
Histogram calculated using DETX and DETY for each event in the final _common_clean file
| Quadrant A | 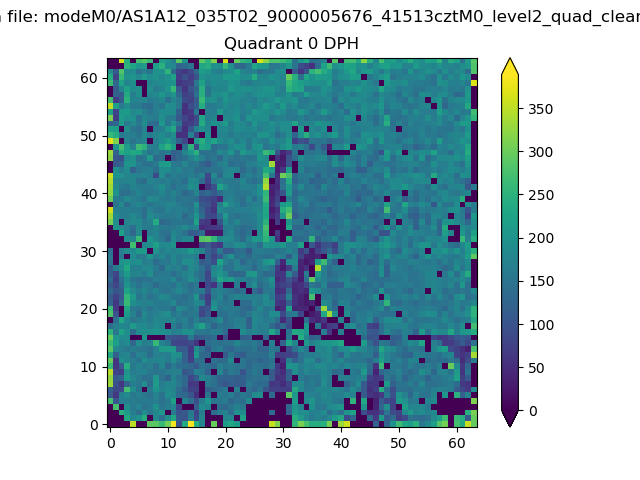 |
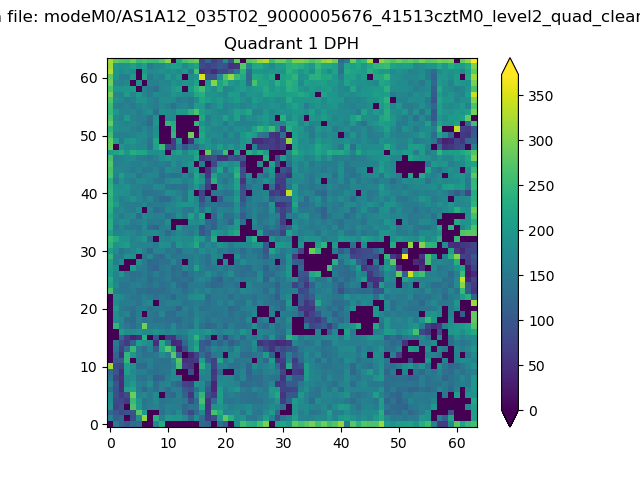 |
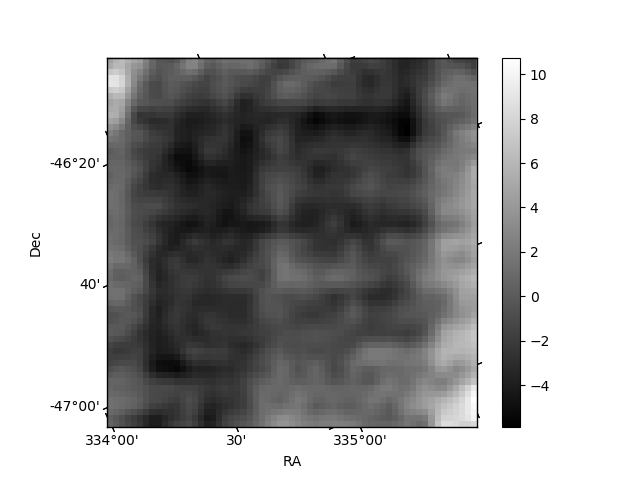
Quadrant B |
|---|---|---|---|
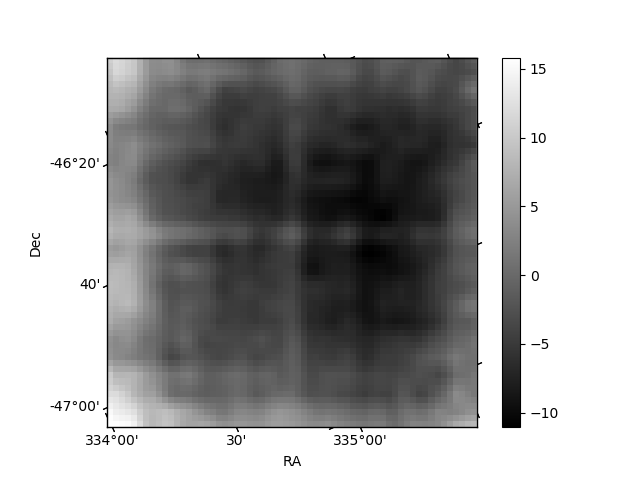
| Quadrant D | 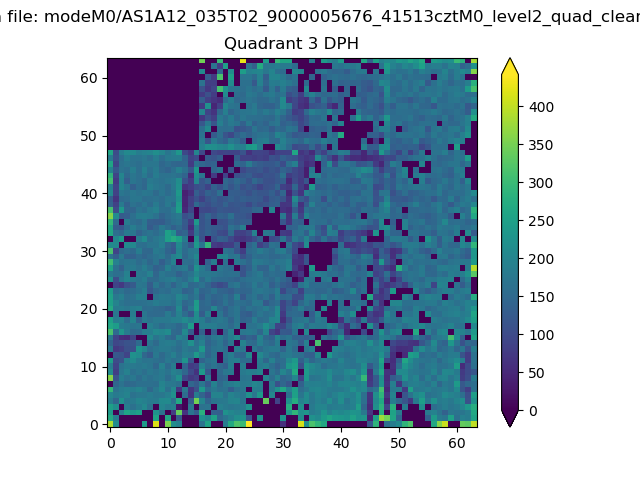 |
 |
Quadrant C |
| Plot type | Count rate plots | Images |
|---|---|---|
| Comparison with Poisson distribution Blue bars denote a histogram of data divided into 1 sec bins. Red curve is a Poisson curve with rate = median count rate of data. |
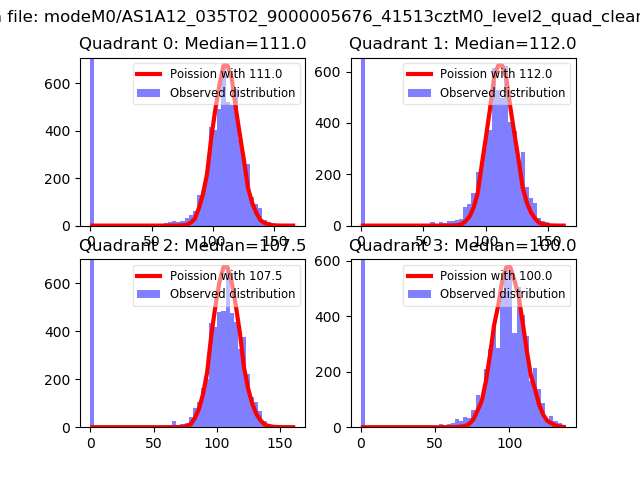 |
 |
| Quadrant-wise count rates Data is divided into 100 sec bins |
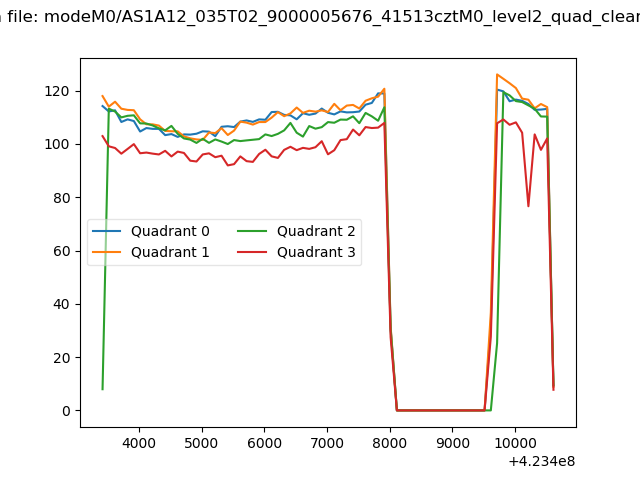 |
|
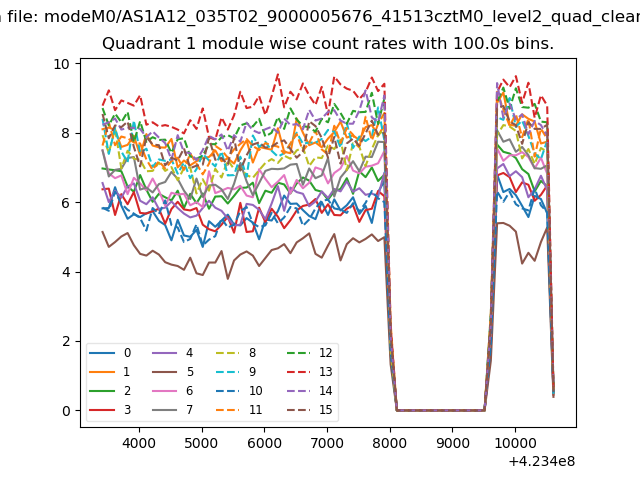
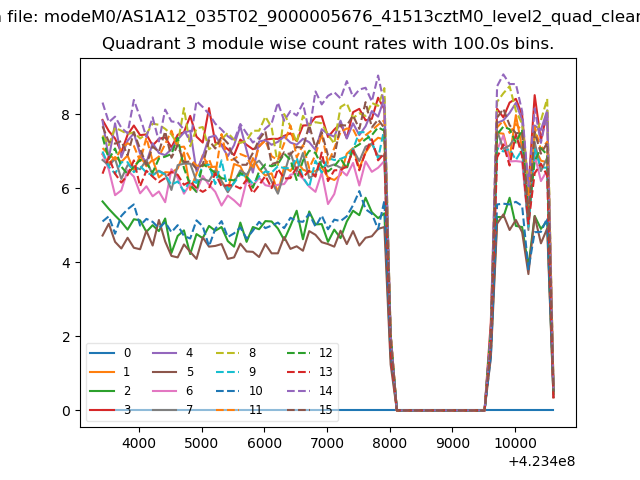
| Module-wise count rates for Quadrant A Data is divided into 100 sec bins |
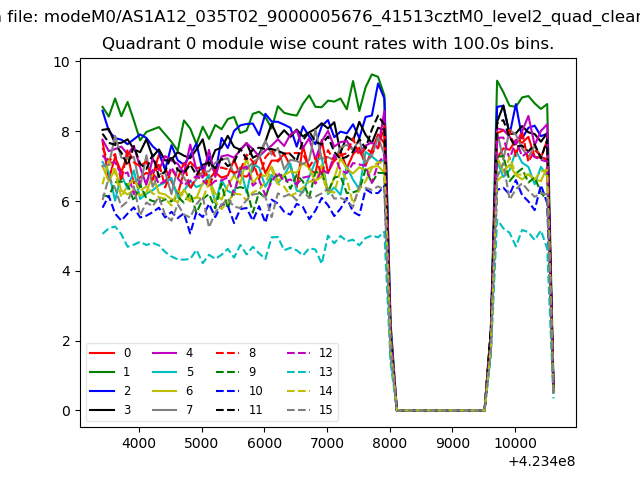 |
 |
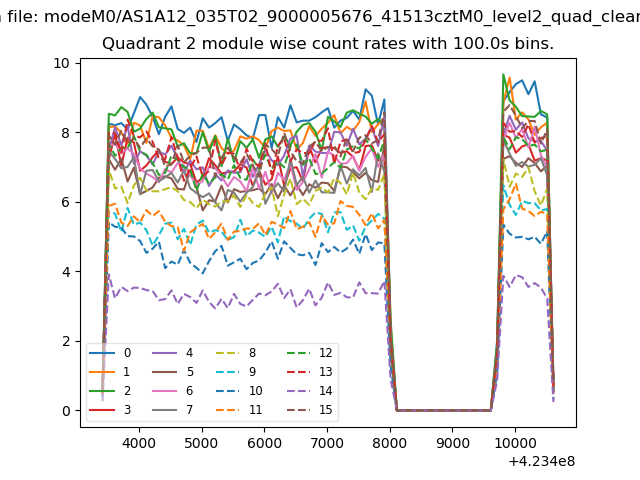
| Module-wise count rates for Quadrant B Data is divided into 100 sec bins |
 |
 |
| Module-wise count rates for Quadrant C Data is divided into 100 sec bins |
 |
 |
| Module-wise count rates for Quadrant D Data is divided into 100 sec bins |
 |
 |
| Parameter | Plot |
|---|---|
| CZT HV Monitor | 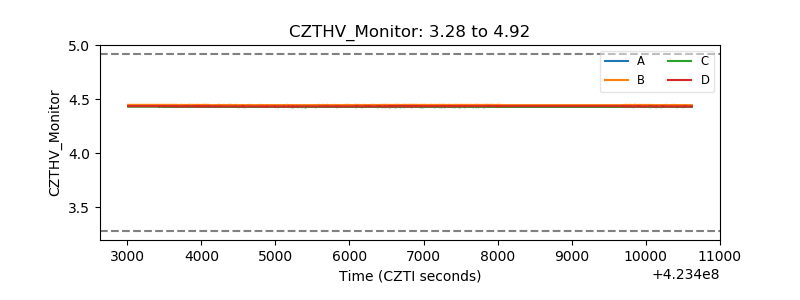 |
| D_VDD | 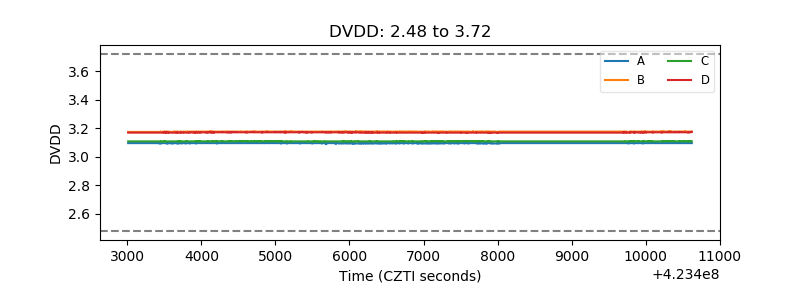 |
| Temperature 1 | 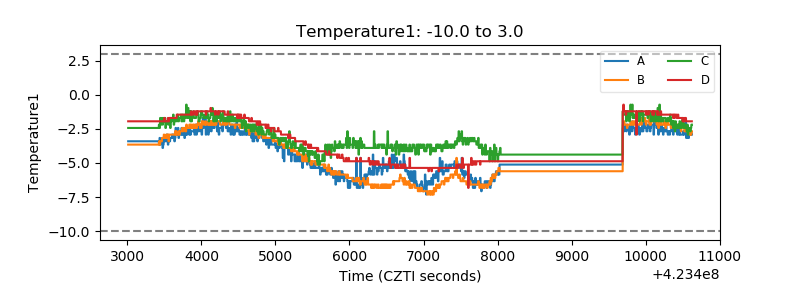 |
| Veto HV Monitor | 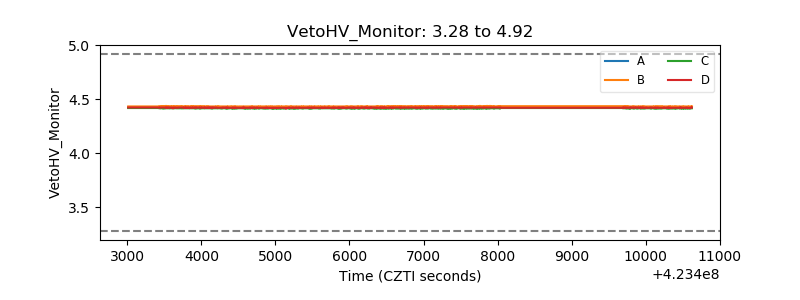 |
| Veto LLD | 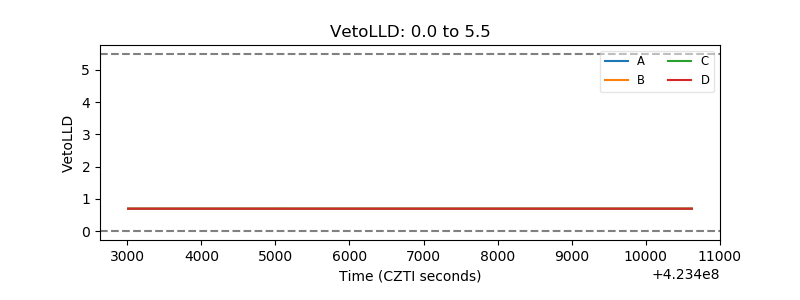 |
| Alpha Counter | 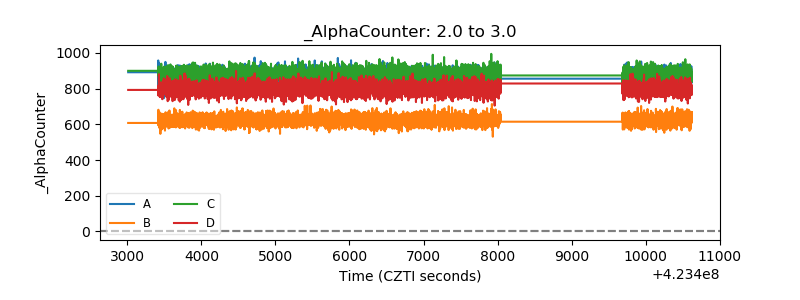 |
| _CPM_Rate | 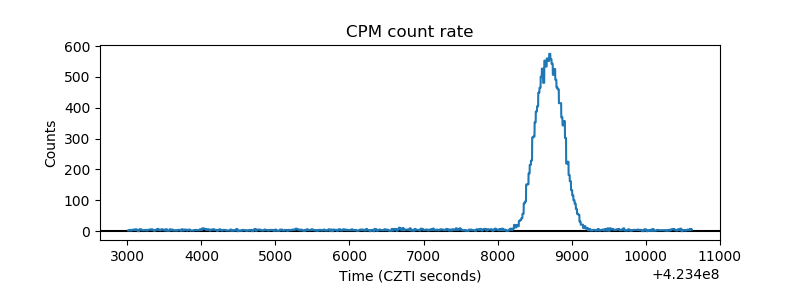 |
| CZT Counter | 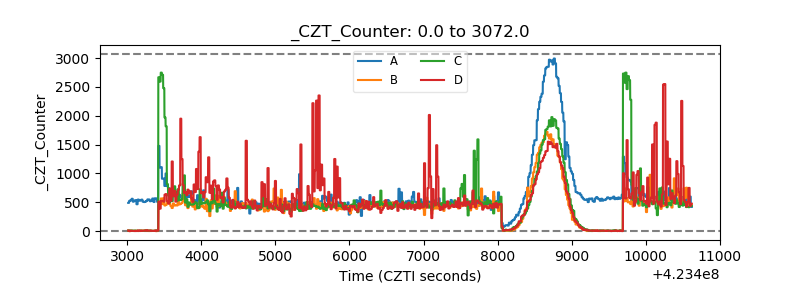 |
| +2.5 Volts monitor | 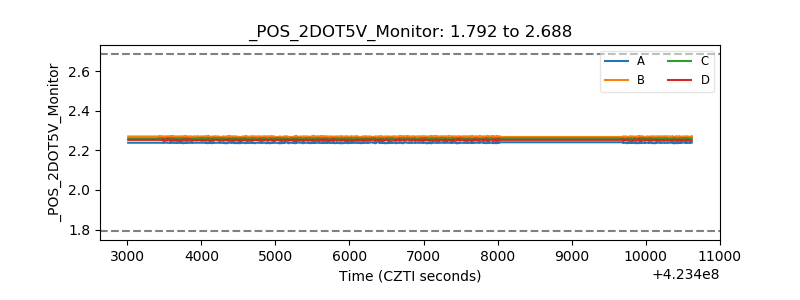 |
| +5 Volts monitor | 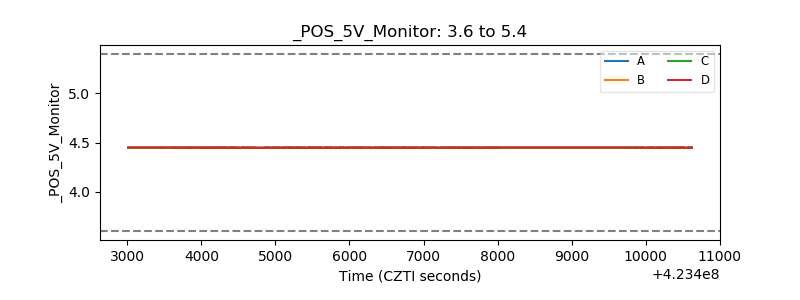 |
| _ROLL_ROT | 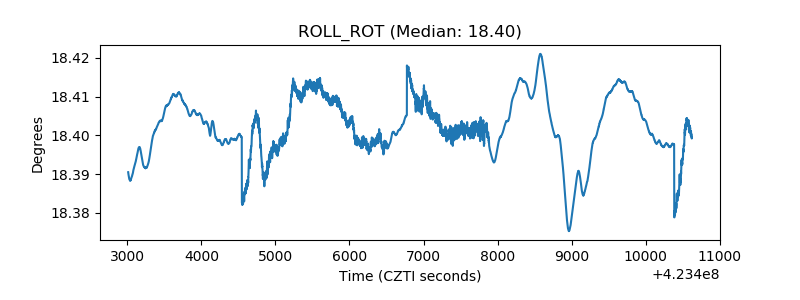 |
| _Roll_DEC | 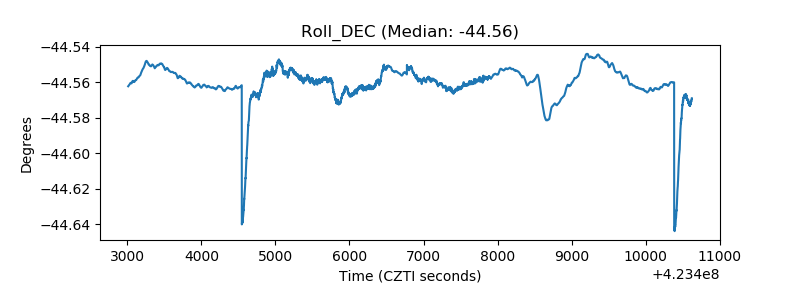 |
| _Roll_RA | 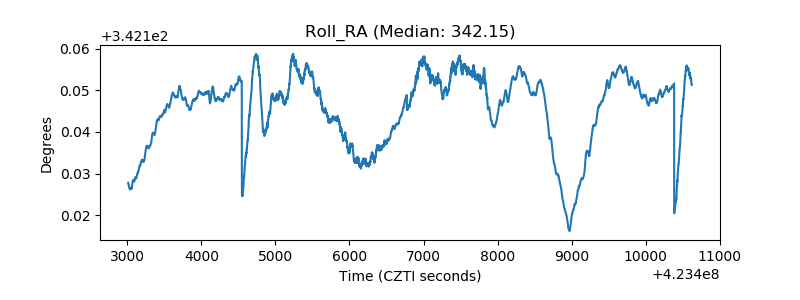 |
| Veto Counter |  |