| Param | Original file | Final file |
|---|---|---|
| Filename | modeM0/AS1A12_035T02_9000005676_41515cztM0_level2.fits | modeM0/AS1A12_035T02_9000005676_41515cztM0_level2_quad_clean.evt |
| Size (bytes) | 338,480,640 | 90,815,040 |
| Size | 322.8 MB | 86.6 MB |
| Events in quadrant A | 3,027,473 | 622,666 |
| Events in quadrant B | 2,788,687 | 624,545 |
| Events in quadrant C | 3,105,947 | 576,014 |
| Events in quadrant D | 3,186,998 | 548,812 |
| Mode SS | |||
|---|---|---|---|
| Quadrant | BADHDUFLAG | Total packets | Discarded packets |
| A | 0 | 110 | 0 |
| B | 0 | 110 | 0 |
| C | 0 | 110 | 0 |
| D | 0 | 110 | 0 |
| Mode M0 | |||
|---|---|---|---|
| Quadrant | BADHDUFLAG | Total packets | Discarded packets |
| A | 0 | 12317 | 3 |
| B | 0 | 11898 | 2 |
| C | 0 | 12575 | 2 |
| D | 0 | 13289 | 2 |
| Mode M9 | |||
|---|---|---|---|
| Quadrant | BADHDUFLAG | Total packets | Discarded packets |
| A | 0 | 22 | 0 |
| B | 0 | 22 | 0 |
| C | 0 | 22 | 0 |
| D | 0 | 23 | 0 |
| Quadrant | Total seconds | Saturated seconds | Saturation percentage |
|---|---|---|---|
| A | 5395 | 25 | 0.463392% |
| B | 5395 | 77 | 1.427247% |
| C | 5395 | 218 | 4.040778% |
| D | 5395 | 164 | 3.039852% |
Noise dominated data is calculated using 1-second bins in cleaned event files. If a bin has >2000 counts, and if more than 50% of those come from <1% of pixels, then it is considered to be noise-dominated and hence unusable.
| Quadrant | # 1 sec bins | Bins with >0 counts | Bins with >2000 counts | High rate bins dominated by noise | Noise dominated (total time) | Noise dominated (detector-on time) | Marked lightcurve |
|---|---|---|---|---|---|---|---|
| A | 7157 | 5396 | 12 | 12 | 0.17% | 0.22% | 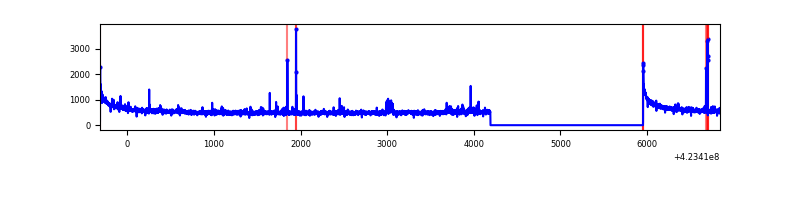 |
| B | 7157 | 5396 | 58 | 58 | 0.81% | 1.07% | 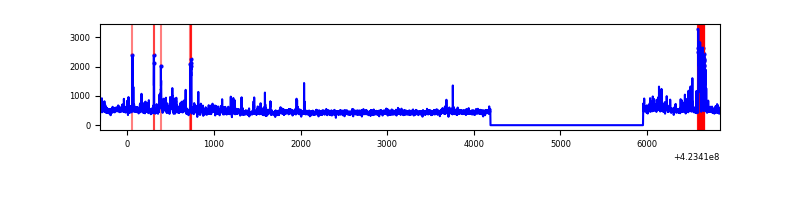 |
| C | 7157 | 5396 | 222 | 222 | 3.10% | 4.11% | 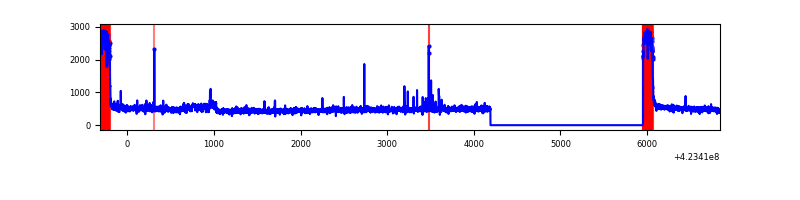 |
| D | 7157 | 5396 | 152 | 152 | 2.12% | 2.82% | 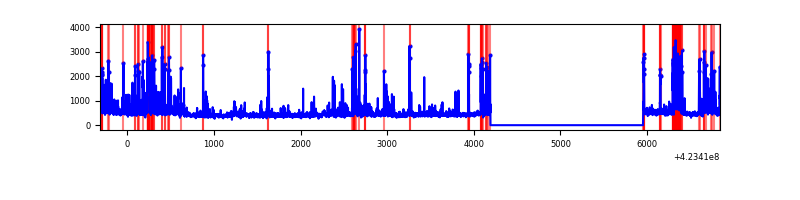 |
Top three noisy pixels from each quadrant. If the there are fewer than three noisy pixels in the level2.evt file, extra rows are filled as -1
| Pixel properties | Quadrant properties | ||||||
|---|---|---|---|---|---|---|---|
| Quadrant | DetID | PixID | Counts | Sigma | Mean | Median | Sigma |
| A | 10 | 83 | 549285 | 4442.07 | 606 | 592 | 123.5 |
| A | 2 | 79 | 51911 | 415.46 | 606 | 592 | 123.5 |
| A | 14 | 235 | 42271 | 337.42 | 606 | 592 | 123.5 |
| B | 0 | 190 | 133242 | 1164.81 | 597 | 580 | 113.9 |
| B | 0 | 186 | 128794 | 1125.75 | 597 | 580 | 113.9 |
| B | 0 | 245 | 127480 | 1114.22 | 597 | 580 | 113.9 |
| C | 0 | 10 | 572564 | 4311.09 | 569 | 573 | 132.7 |
| C | 15 | 214 | 221579 | 1665.72 | 569 | 573 | 132.7 |
| C | 7 | 220 | 50896 | 379.28 | 569 | 573 | 132.7 |
| D | 2 | 249 | 259807 | 1797.73 | 582 | 566 | 144.2 |
| D | 12 | 233 | 173780 | 1201.17 | 582 | 566 | 144.2 |
| D | 1 | 52 | 133968 | 925.09 | 582 | 566 | 144.2 |
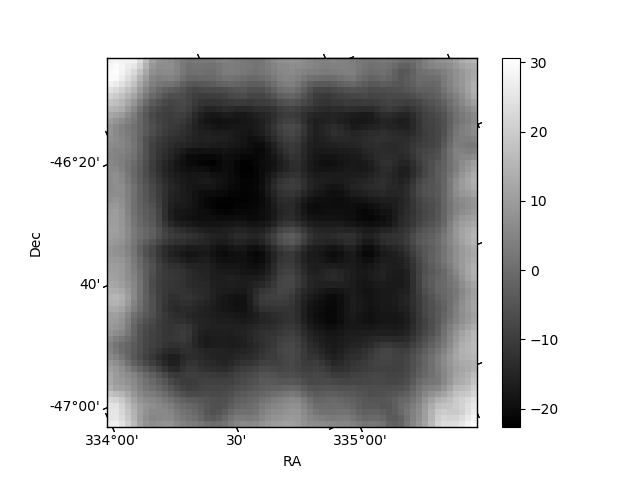
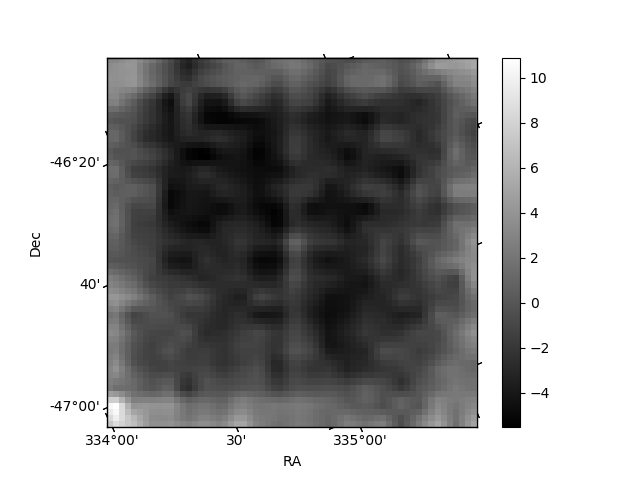
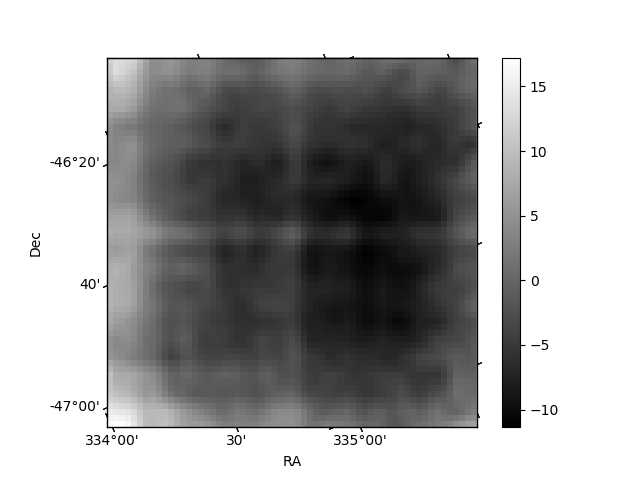
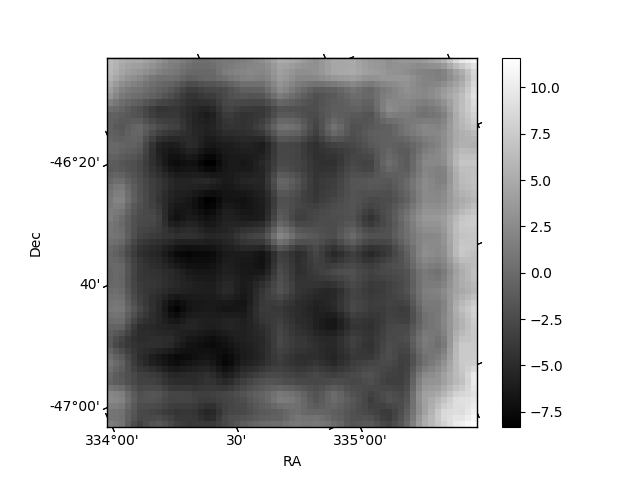
Histogram calculated using DETX and DETY for each event in the final _common_clean file
| Quadrant A | 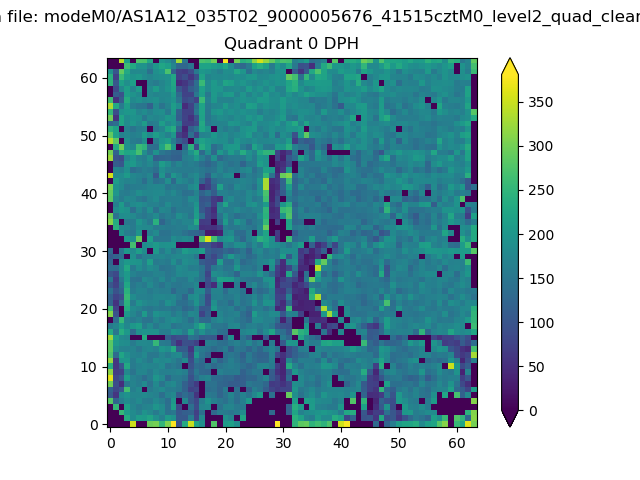 |
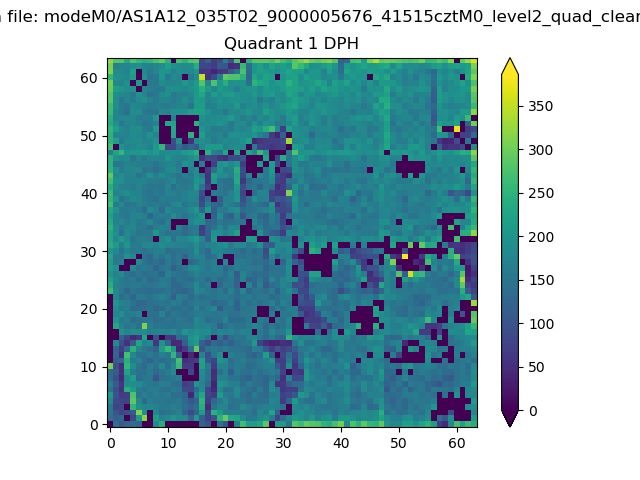 |
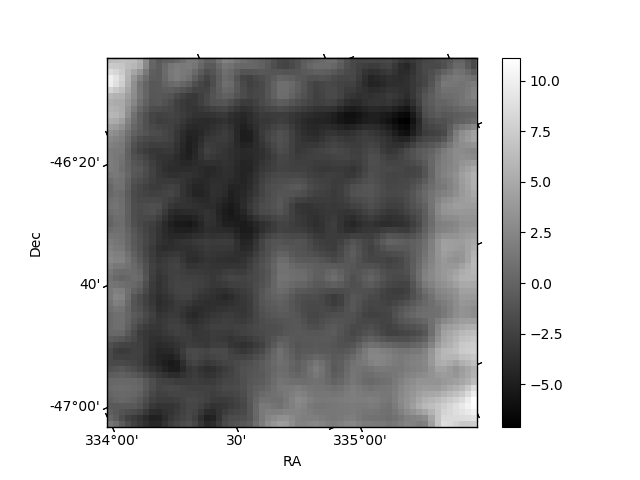
Quadrant B |
|---|---|---|---|
| Quadrant D | 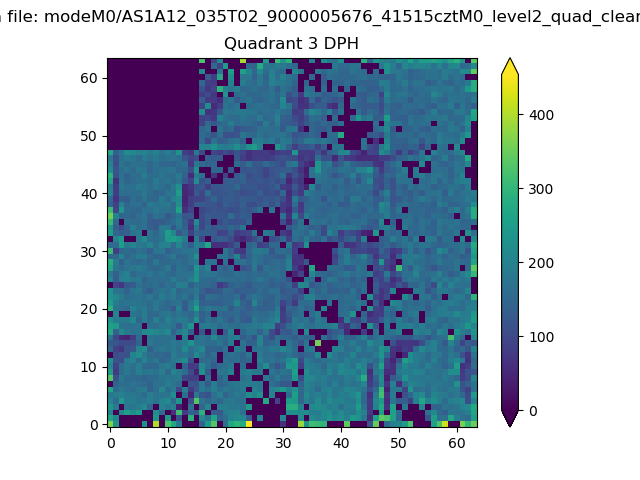 |
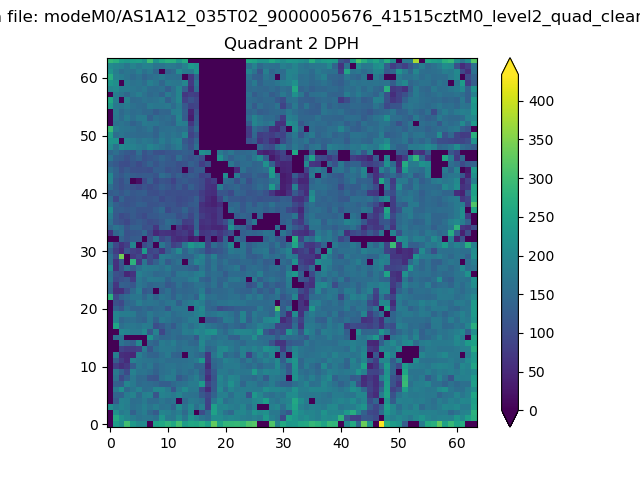 |
Quadrant C |
| Plot type | Count rate plots | Images |
|---|---|---|
| Comparison with Poisson distribution Blue bars denote a histogram of data divided into 1 sec bins. Red curve is a Poisson curve with rate = median count rate of data. |
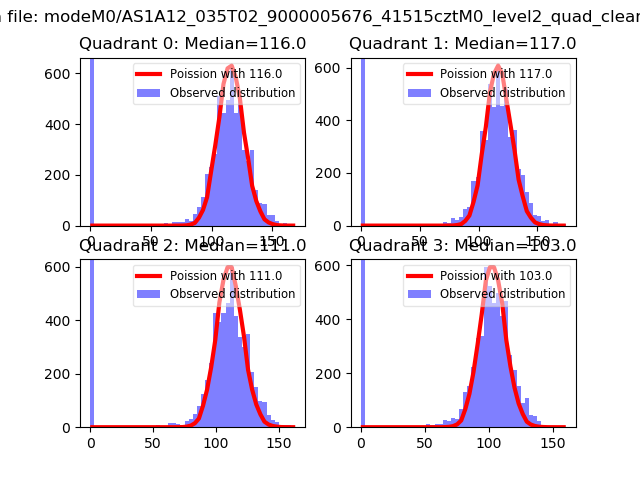 |
 |
| Quadrant-wise count rates Data is divided into 100 sec bins |
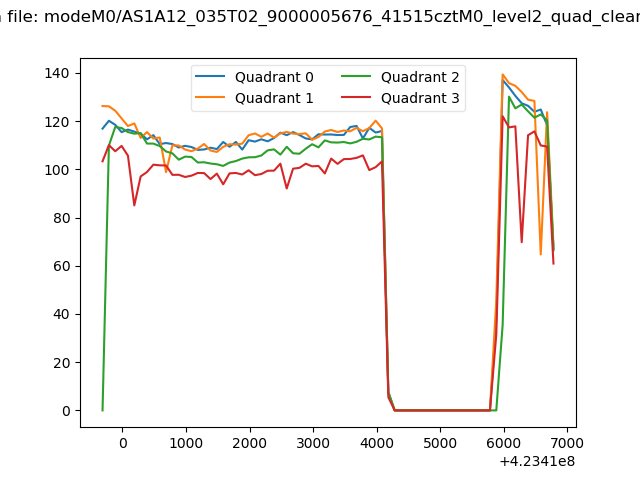 |
|
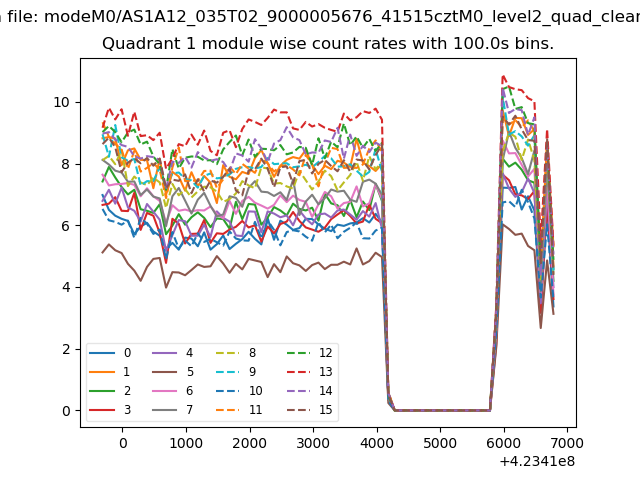
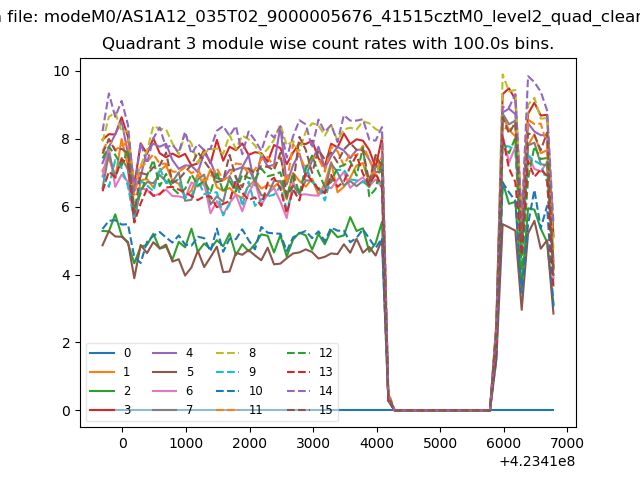
| Module-wise count rates for Quadrant A Data is divided into 100 sec bins |
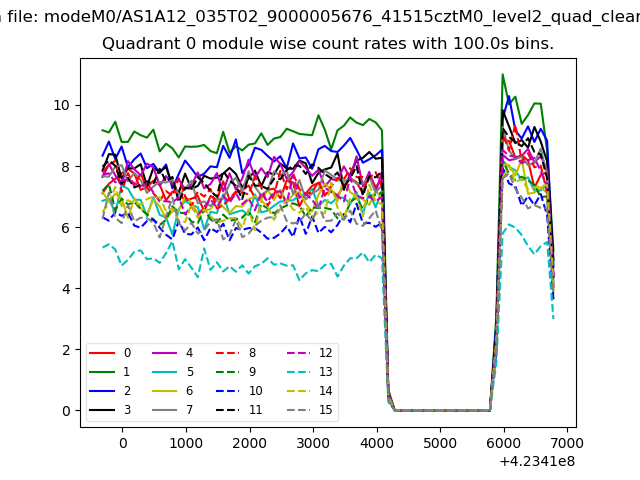 |
 |
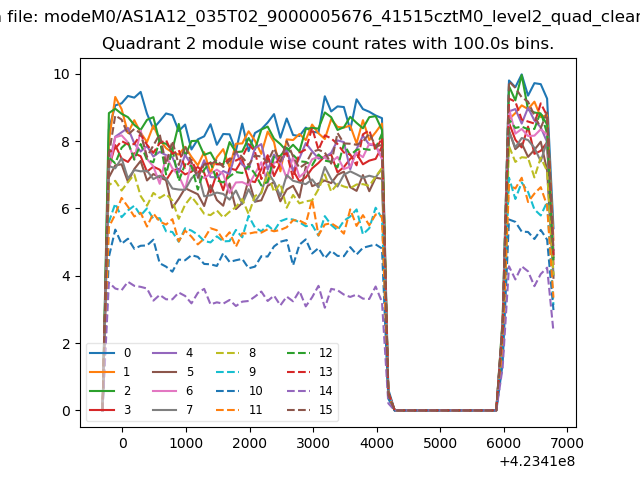
| Module-wise count rates for Quadrant B Data is divided into 100 sec bins |
 |
 |
| Module-wise count rates for Quadrant C Data is divided into 100 sec bins |
 |
 |
| Module-wise count rates for Quadrant D Data is divided into 100 sec bins |
 |
 |
| Parameter | Plot |
|---|---|
| CZT HV Monitor | 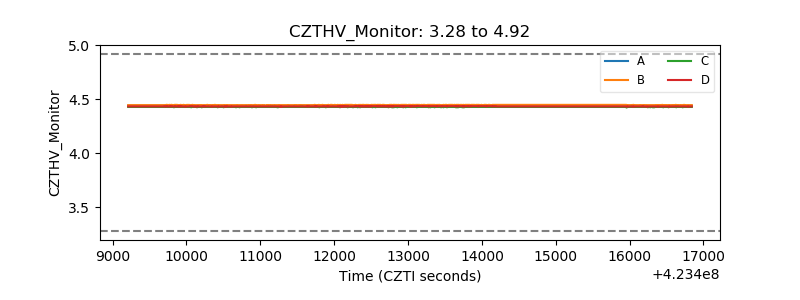 |
| D_VDD | 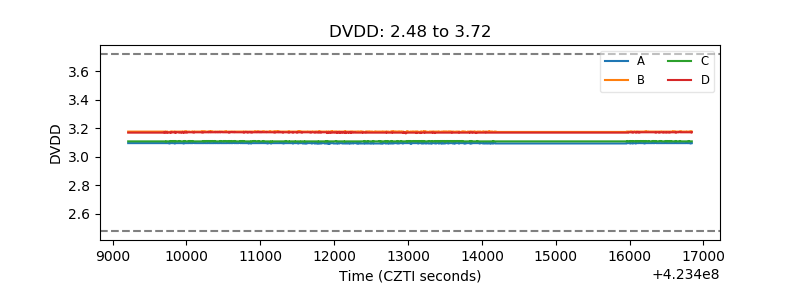 |
| Temperature 1 | 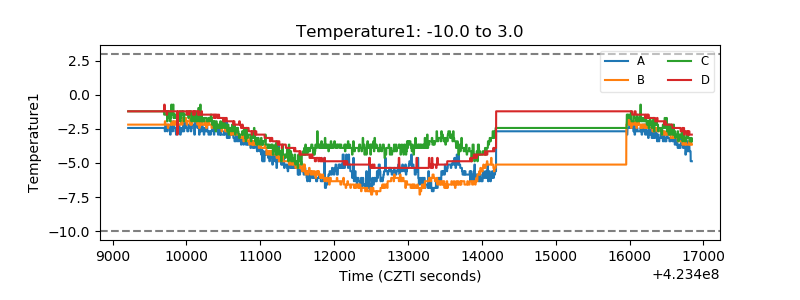 |
| Veto HV Monitor | 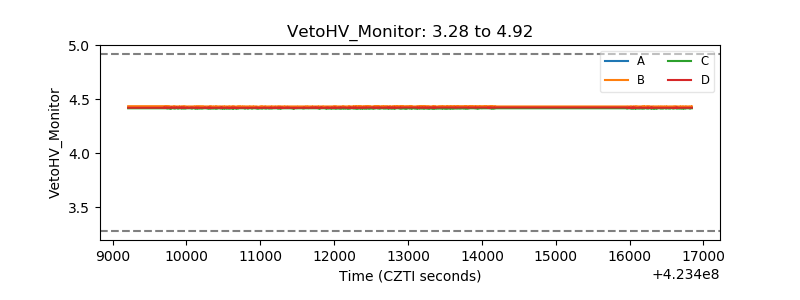 |
| Veto LLD | 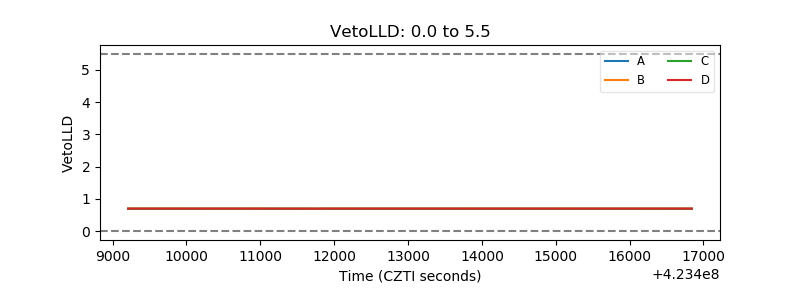 |
| Alpha Counter | 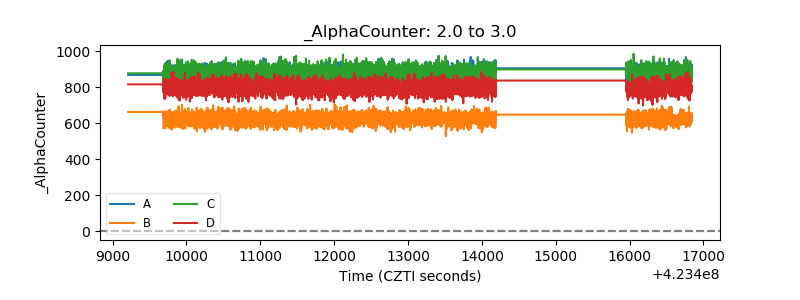 |
| _CPM_Rate | 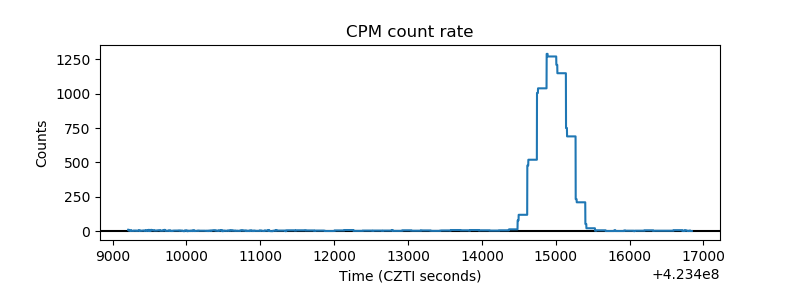 |
| CZT Counter | 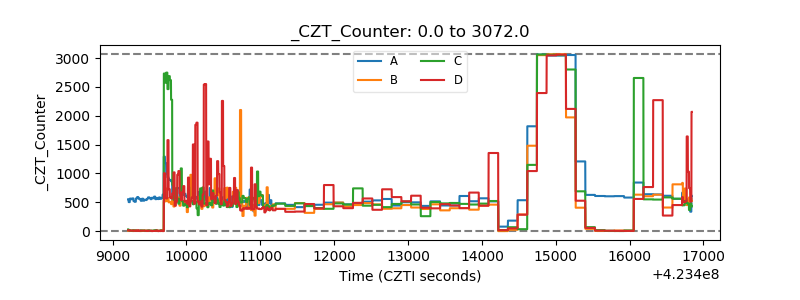 |
| +2.5 Volts monitor | 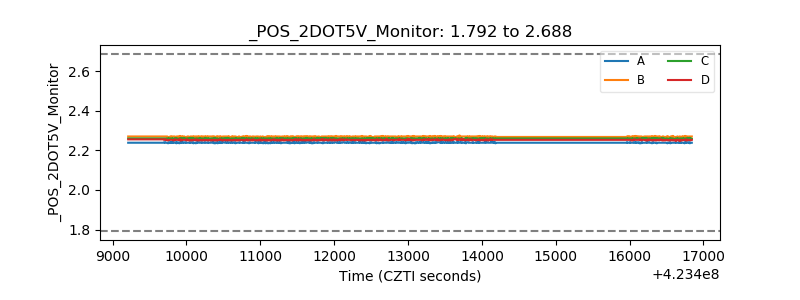 |
| +5 Volts monitor | 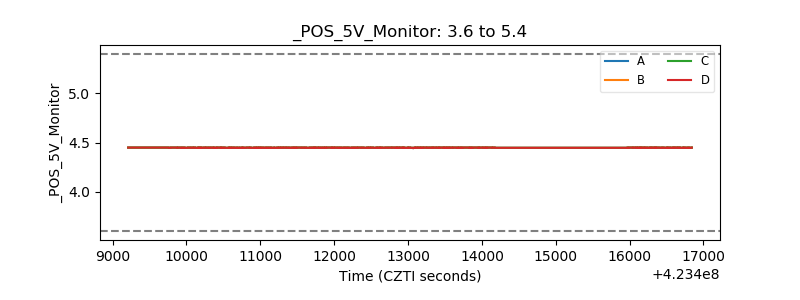 |
| _ROLL_ROT | 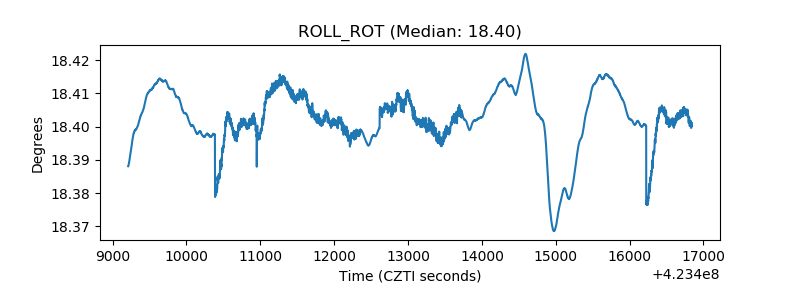 |
| _Roll_DEC | 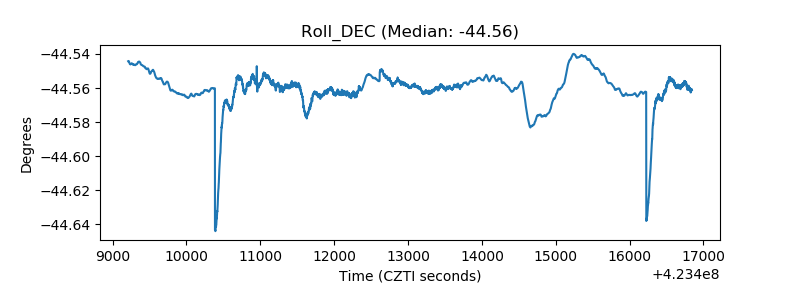 |
| _Roll_RA | 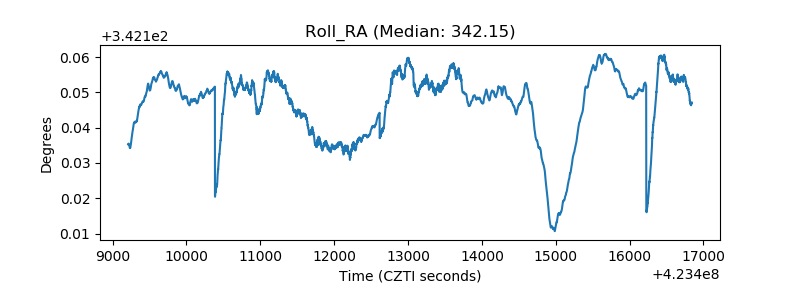 |
| Veto Counter | 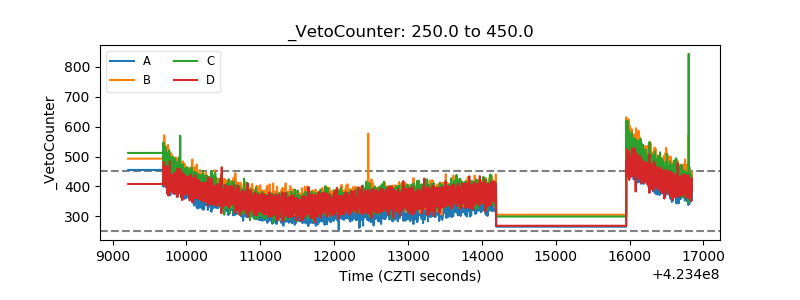 |