| Param | Original file | Final file |
|---|---|---|
| Filename | modeM0/AS1A12_035T02_9000005676_41516cztM0_level2.fits | modeM0/AS1A12_035T02_9000005676_41516cztM0_level2_quad_clean.evt |
| Size (bytes) | 355,852,800 | 91,261,440 |
| Size | 339.4 MB | 87.0 MB |
| Events in quadrant A | 3,197,092 | 636,349 |
| Events in quadrant B | 3,146,455 | 616,097 |
| Events in quadrant C | 3,080,852 | 585,857 |
| Events in quadrant D | 3,340,266 | 558,575 |
| Mode SS | |||
|---|---|---|---|
| Quadrant | BADHDUFLAG | Total packets | Discarded packets |
| A | 0 | 106 | 0 |
| B | 0 | 106 | 0 |
| C | 0 | 106 | 0 |
| D | 0 | 106 | 0 |
| Mode M0 | |||
|---|---|---|---|
| Quadrant | BADHDUFLAG | Total packets | Discarded packets |
| A | 0 | 12703 | 3 |
| B | 0 | 12755 | 2 |
| C | 0 | 12326 | 2 |
| D | 0 | 13370 | 2 |
| Mode M9 | |||
|---|---|---|---|
| Quadrant | BADHDUFLAG | Total packets | Discarded packets |
| A | 0 | 23 | 0 |
| B | 0 | 23 | 0 |
| C | 0 | 23 | 0 |
| D | 0 | 24 | 0 |
| Quadrant | Total seconds | Saturated seconds | Saturation percentage |
|---|---|---|---|
| A | 5238 | 103 | 1.966399% |
| B | 5238 | 296 | 5.651012% |
| C | 5238 | 220 | 4.200076% |
| D | 5238 | 178 | 3.398244% |
Noise dominated data is calculated using 1-second bins in cleaned event files. If a bin has >2000 counts, and if more than 50% of those come from <1% of pixels, then it is considered to be noise-dominated and hence unusable.
| Quadrant | # 1 sec bins | Bins with >0 counts | Bins with >2000 counts | High rate bins dominated by noise | Noise dominated (total time) | Noise dominated (detector-on time) | Marked lightcurve |
|---|---|---|---|---|---|---|---|
| A | 7151 | 5239 | 91 | 91 | 1.27% | 1.74% | 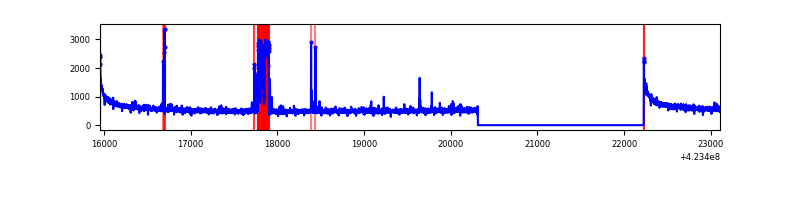 |
| B | 7151 | 5239 | 240 | 240 | 3.36% | 4.58% | 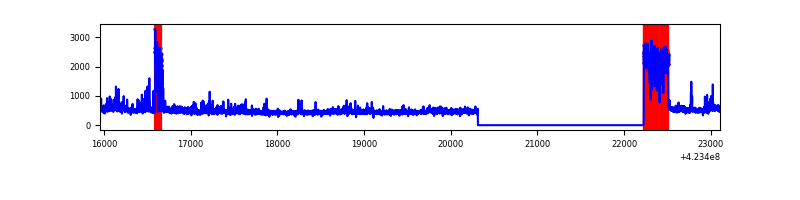 |
| C | 7151 | 5239 | 221 | 221 | 3.09% | 4.22% |  |
| D | 7151 | 5239 | 178 | 178 | 2.49% | 3.40% | 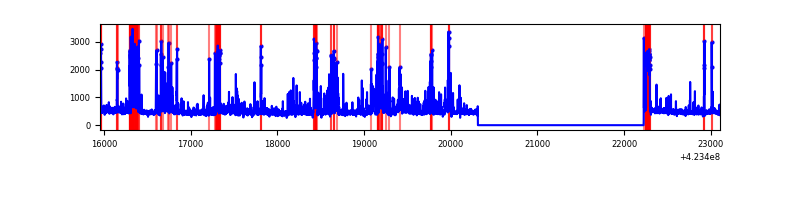 |
Top three noisy pixels from each quadrant. If the there are fewer than three noisy pixels in the level2.evt file, extra rows are filled as -1
| Pixel properties | Quadrant properties | ||||||
|---|---|---|---|---|---|---|---|
| Quadrant | DetID | PixID | Counts | Sigma | Mean | Median | Sigma |
| A | 10 | 83 | 528082 | 4335.05 | 601 | 589 | 121.7 |
| A | 15 | 190 | 212305 | 1739.93 | 601 | 589 | 121.7 |
| A | 2 | 79 | 86128 | 702.98 | 601 | 589 | 121.7 |
| B | 0 | 186 | 583276 | 5204.39 | 590 | 576 | 112.0 |
| B | 0 | 190 | 103280 | 917.3 | 590 | 576 | 112.0 |
| B | 0 | 245 | 89434 | 793.64 | 590 | 576 | 112.0 |
| C | 0 | 10 | 564903 | 4274.83 | 567 | 570 | 132.0 |
| C | 15 | 214 | 214012 | 1616.83 | 567 | 570 | 132.0 |
| C | 14 | 254 | 69639 | 523.2 | 567 | 570 | 132.0 |
| D | 2 | 249 | 285896 | 2024.29 | 580 | 565 | 141.0 |
| D | 1 | 47 | 211500 | 1496.48 | 580 | 565 | 141.0 |
| D | 1 | 52 | 209079 | 1479.31 | 580 | 565 | 141.0 |
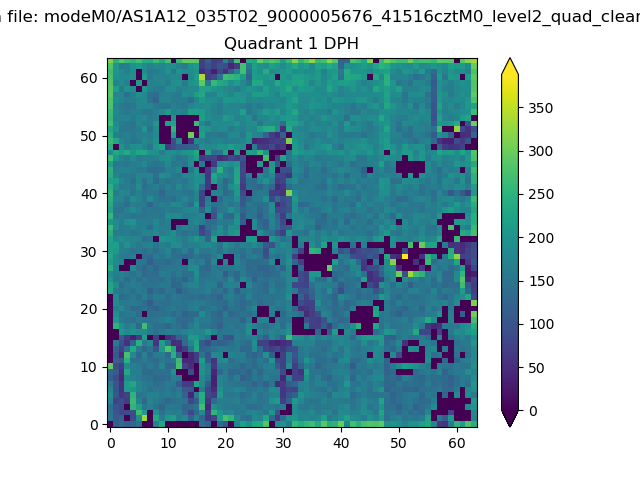
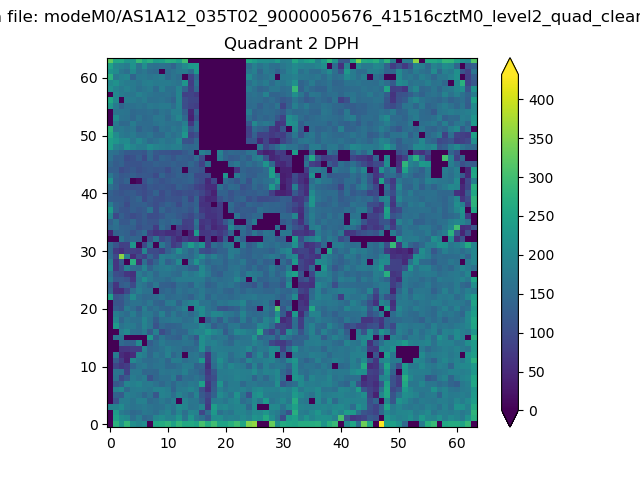
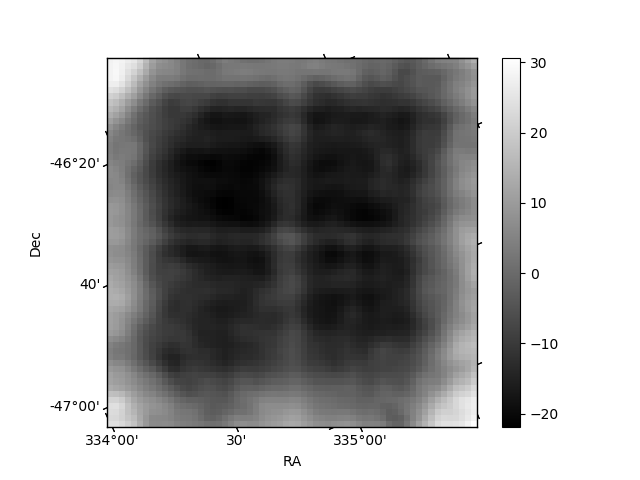
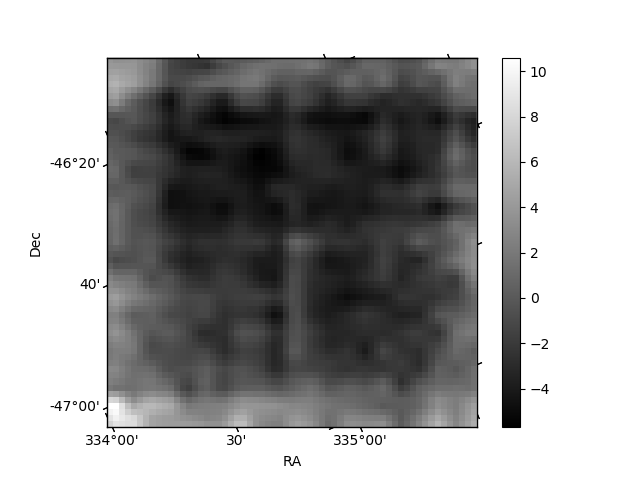
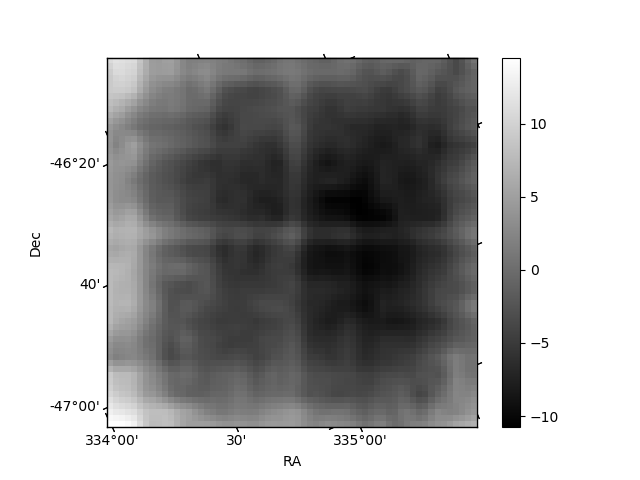
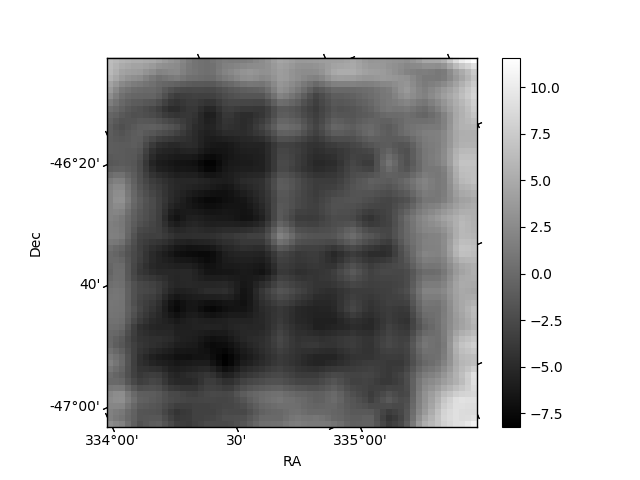
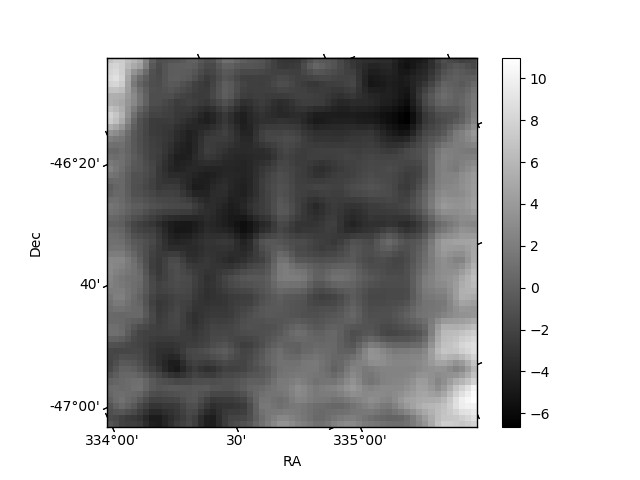
Histogram calculated using DETX and DETY for each event in the final _common_clean file
| Quadrant A | 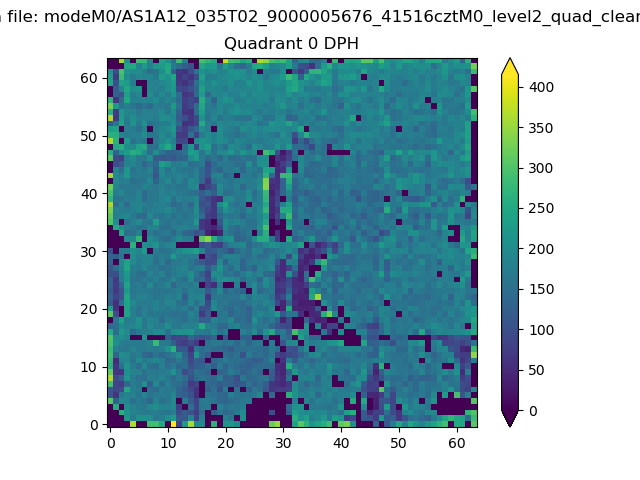 |
 |
Quadrant B |
|---|---|---|---|
| Quadrant D | 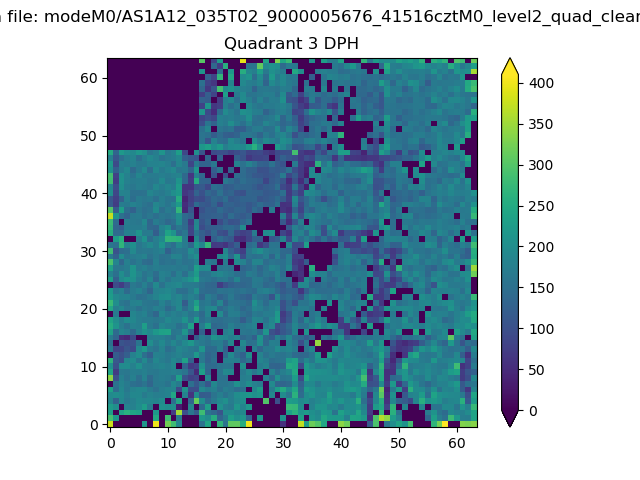 |
 |
Quadrant C |
| Plot type | Count rate plots | Images |
|---|---|---|
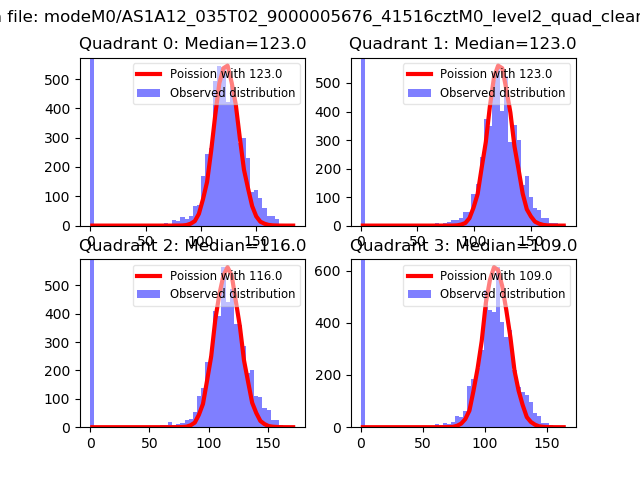
| Comparison with Poisson distribution Blue bars denote a histogram of data divided into 1 sec bins. Red curve is a Poisson curve with rate = median count rate of data. |
 |
 |
| Quadrant-wise count rates Data is divided into 100 sec bins |
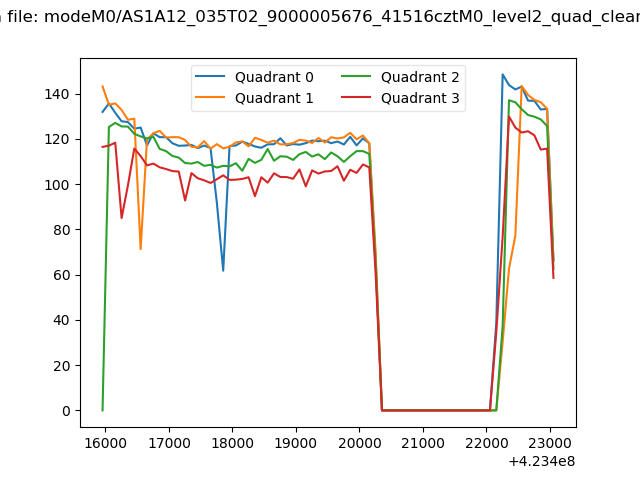 |
|
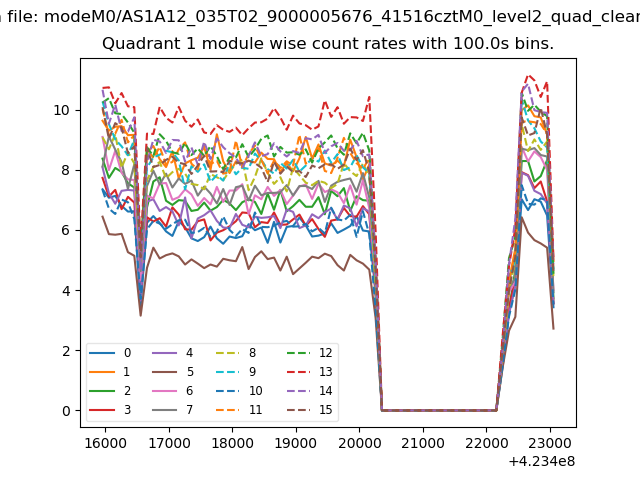
| Module-wise count rates for Quadrant A Data is divided into 100 sec bins |
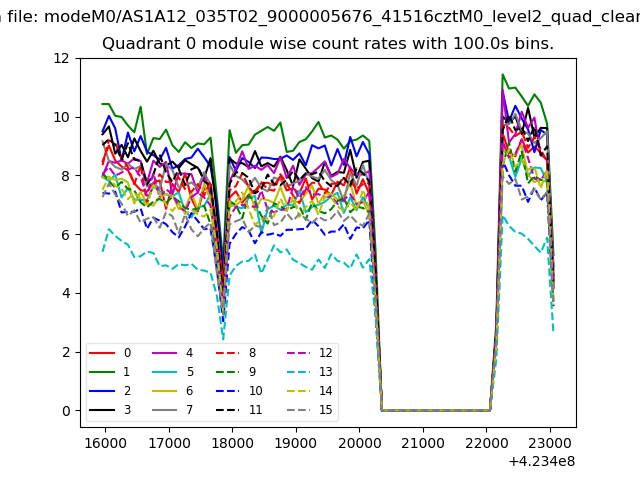 |
 |
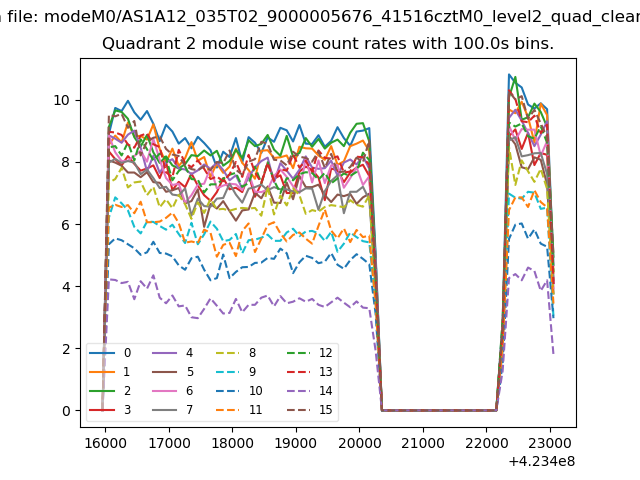
| Module-wise count rates for Quadrant B Data is divided into 100 sec bins |
 |
 |
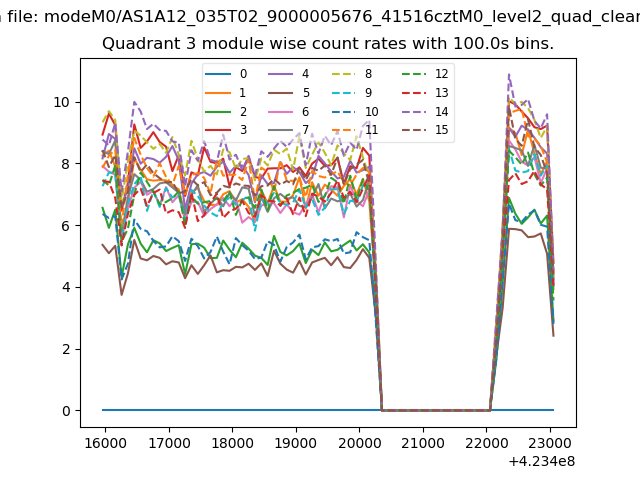
| Module-wise count rates for Quadrant C Data is divided into 100 sec bins |
 |
 |
| Module-wise count rates for Quadrant D Data is divided into 100 sec bins |
 |
 |
| Parameter | Plot |
|---|---|
| CZT HV Monitor | 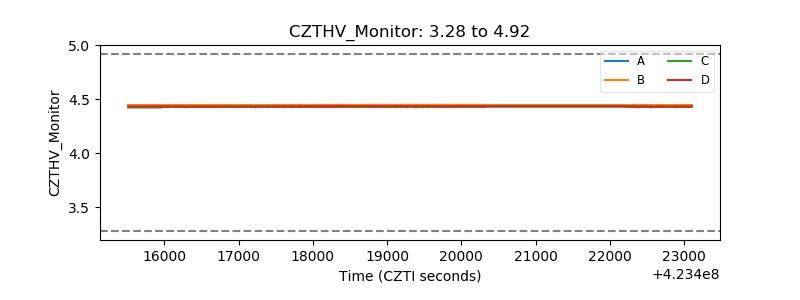 |
| D_VDD | 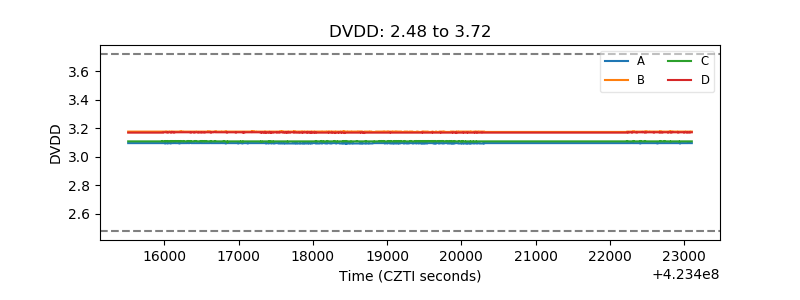 |
| Temperature 1 | 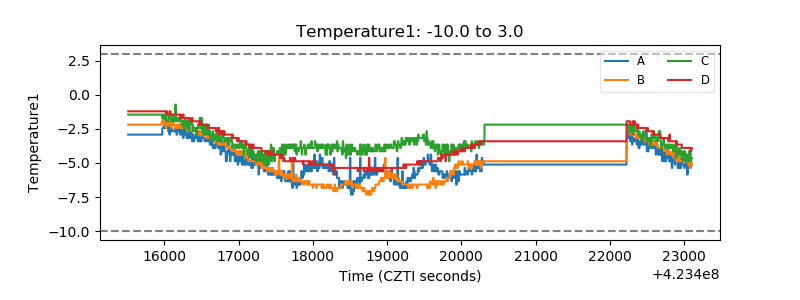 |
| Veto HV Monitor | 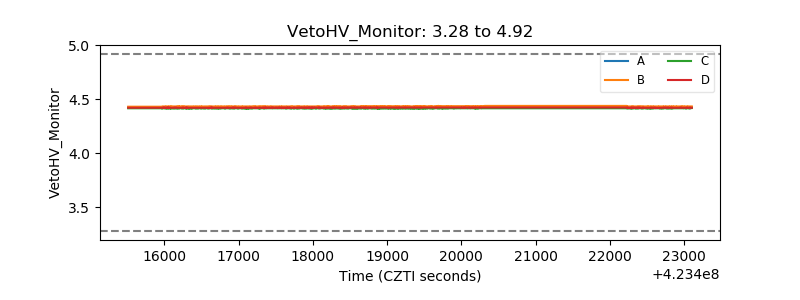 |
| Veto LLD | 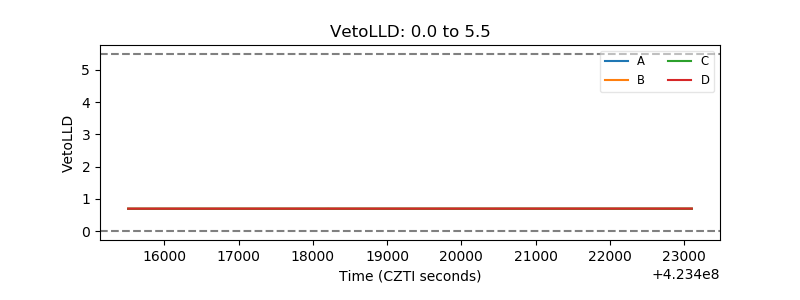 |
| Alpha Counter | 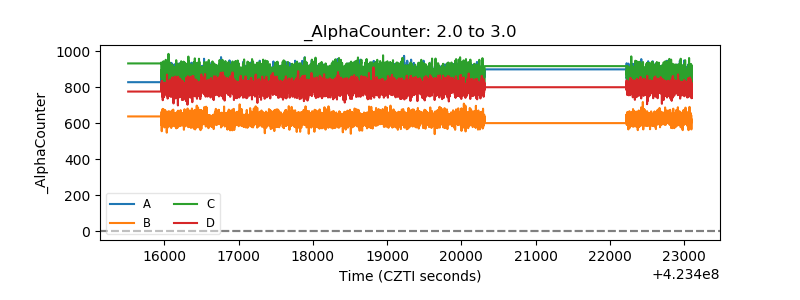 |
| _CPM_Rate | 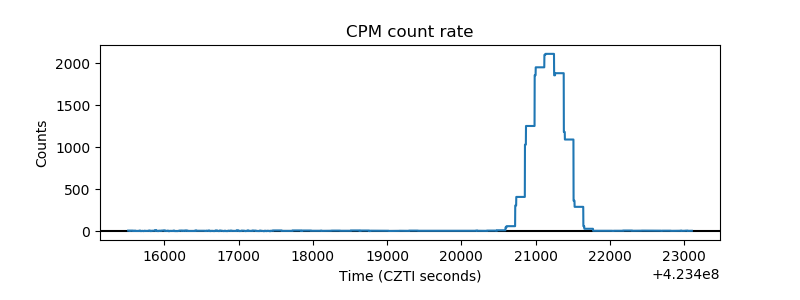 |
| CZT Counter | 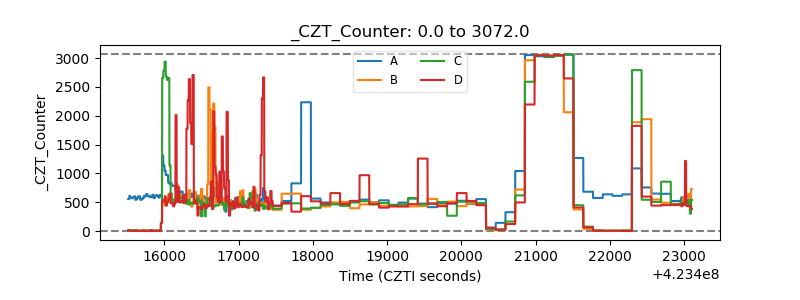 |
| +2.5 Volts monitor | 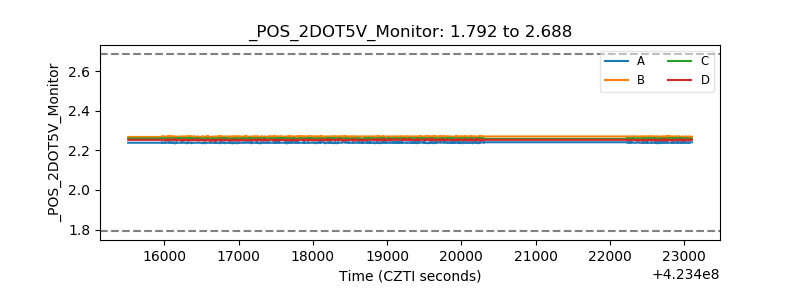 |
| +5 Volts monitor | 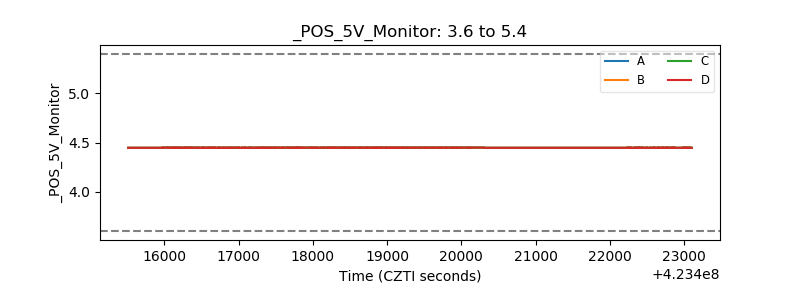 |
| _ROLL_ROT | 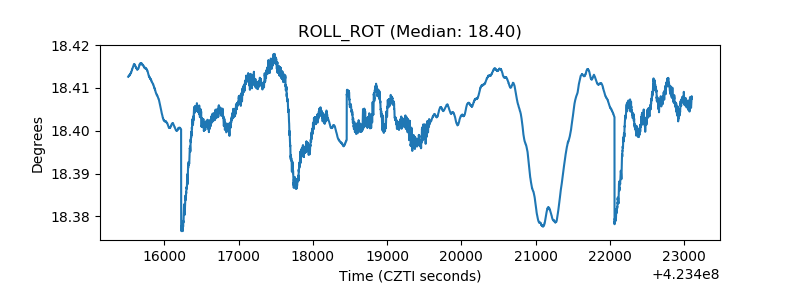 |
| _Roll_DEC | 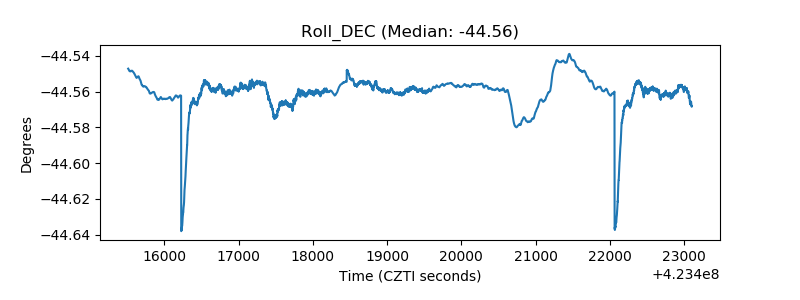 |
| _Roll_RA | 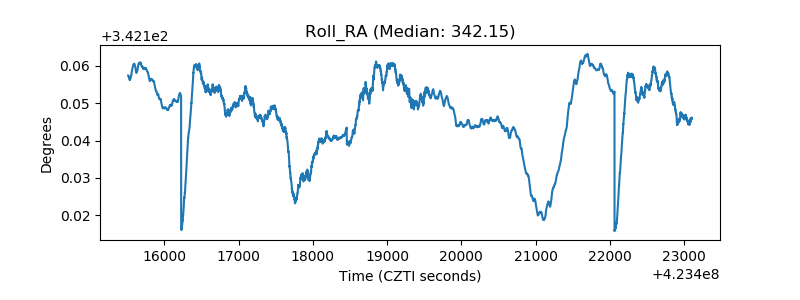 |
| Veto Counter | 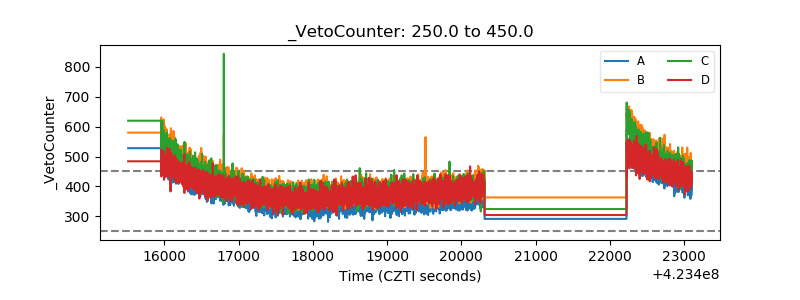 |