| Param | Original file | Final file |
|---|---|---|
| Filename | modeM0/AS1A12_035T02_9000005676_41517cztM0_level2.fits | modeM0/AS1A12_035T02_9000005676_41517cztM0_level2_quad_clean.evt |
| Size (bytes) | 318,654,720 | 90,262,080 |
| Size | 303.9 MB | 86.1 MB |
| Events in quadrant A | 2,814,882 | 635,218 |
| Events in quadrant B | 2,954,882 | 617,349 |
| Events in quadrant C | 2,978,214 | 575,919 |
| Events in quadrant D | 2,661,061 | 557,019 |
| Mode SS | |||
|---|---|---|---|
| Quadrant | BADHDUFLAG | Total packets | Discarded packets |
| A | 0 | 102 | 0 |
| B | 0 | 102 | 0 |
| C | 0 | 102 | 0 |
| D | 0 | 102 | 0 |
| Mode M0 | |||
|---|---|---|---|
| Quadrant | BADHDUFLAG | Total packets | Discarded packets |
| A | 0 | 11372 | 3 |
| B | 0 | 11983 | 2 |
| C | 0 | 11723 | 2 |
| D | 0 | 11195 | 2 |
| Mode M9 | |||
|---|---|---|---|
| Quadrant | BADHDUFLAG | Total packets | Discarded packets |
| A | 0 | 33 | 0 |
| B | 0 | 33 | 0 |
| C | 0 | 33 | 0 |
| D | 0 | 34 | 0 |
| Quadrant | Total seconds | Saturated seconds | Saturation percentage |
|---|---|---|---|
| A | 4957 | 21 | 0.423643% |
| B | 4957 | 240 | 4.841638% |
| C | 4957 | 221 | 4.458342% |
| D | 4957 | 84 | 1.694573% |
Noise dominated data is calculated using 1-second bins in cleaned event files. If a bin has >2000 counts, and if more than 50% of those come from <1% of pixels, then it is considered to be noise-dominated and hence unusable.
| Quadrant | # 1 sec bins | Bins with >0 counts | Bins with >2000 counts | High rate bins dominated by noise | Noise dominated (total time) | Noise dominated (detector-on time) | Marked lightcurve |
|---|---|---|---|---|---|---|---|
| A | 6990 | 4958 | 8 | 8 | 0.11% | 0.16% | 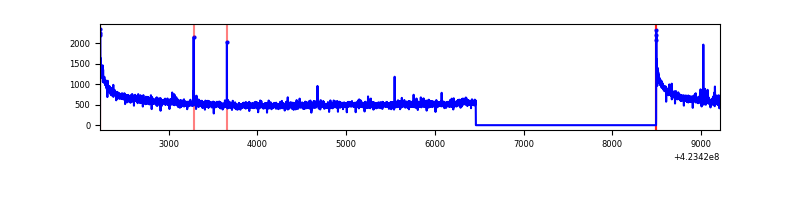 |
| B | 6990 | 4958 | 191 | 191 | 2.73% | 3.85% | 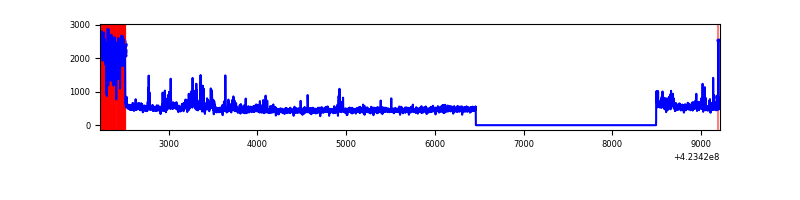 |
| C | 6990 | 4958 | 218 | 218 | 3.12% | 4.40% | 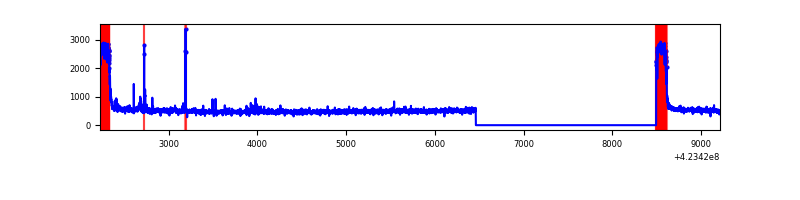 |
| D | 6990 | 4958 | 76 | 76 | 1.09% | 1.53% | 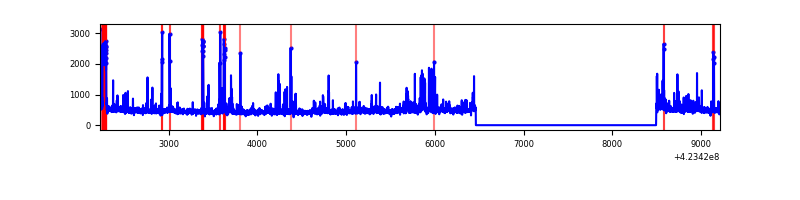 |
Top three noisy pixels from each quadrant. If the there are fewer than three noisy pixels in the level2.evt file, extra rows are filled as -1
| Pixel properties | Quadrant properties | ||||||
|---|---|---|---|---|---|---|---|
| Quadrant | DetID | PixID | Counts | Sigma | Mean | Median | Sigma |
| A | 10 | 83 | 498194 | 4115.8 | 589 | 577 | 120.9 |
| A | 13 | 248 | 14630 | 116.23 | 589 | 577 | 120.9 |
| A | 2 | 79 | 13547 | 107.28 | 589 | 577 | 120.9 |
| B | 0 | 186 | 455048 | 4192.73 | 575 | 560 | 108.4 |
| B | 0 | 190 | 94481 | 866.44 | 575 | 560 | 108.4 |
| B | 0 | 245 | 78232 | 716.54 | 575 | 560 | 108.4 |
| C | 0 | 10 | 574810 | 4521.32 | 550 | 555 | 127.0 |
| C | 15 | 214 | 200438 | 1573.75 | 550 | 555 | 127.0 |
| C | 14 | 254 | 31806 | 246.05 | 550 | 555 | 127.0 |
| D | 1 | 47 | 141216 | 1014.82 | 567 | 552 | 138.6 |
| D | 12 | 233 | 96485 | 692.11 | 567 | 552 | 138.6 |
| D | 2 | 249 | 63380 | 453.27 | 567 | 552 | 138.6 |
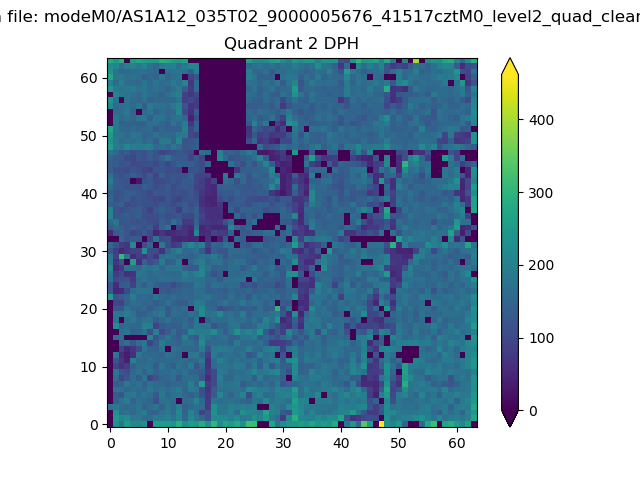
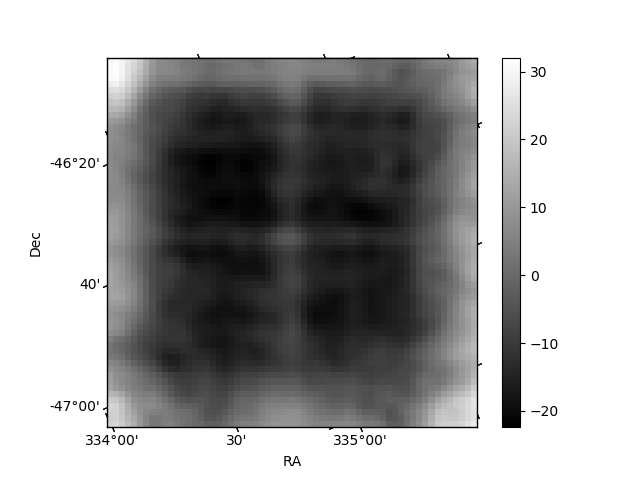
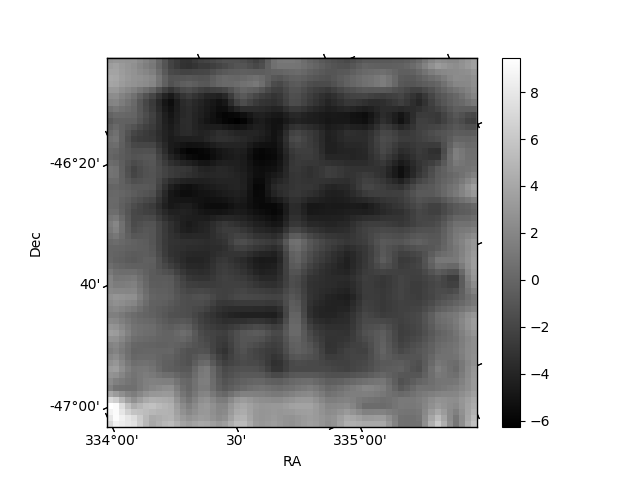
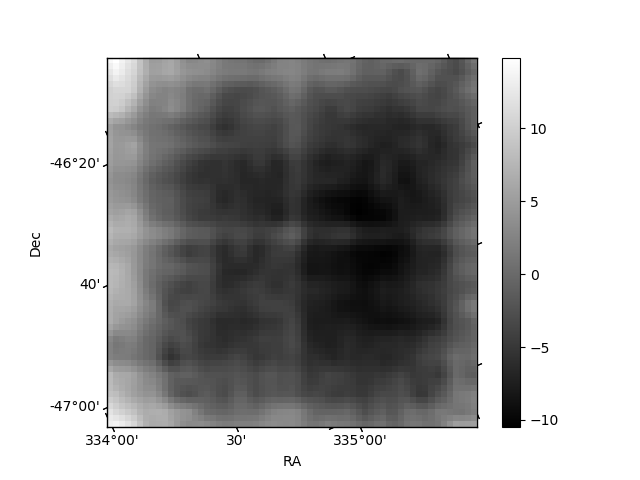
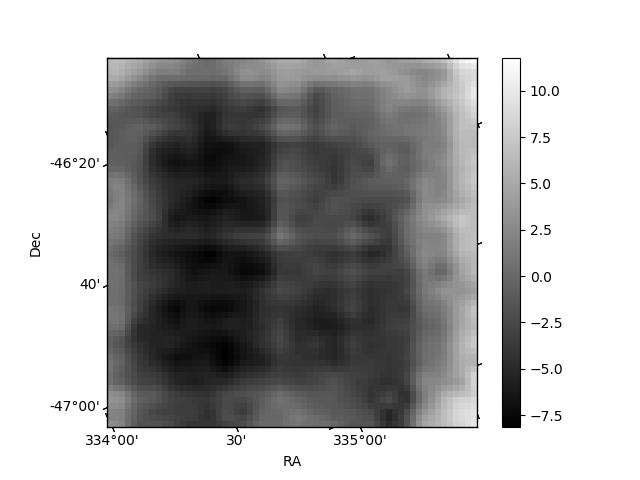
Histogram calculated using DETX and DETY for each event in the final _common_clean file
| Quadrant A | 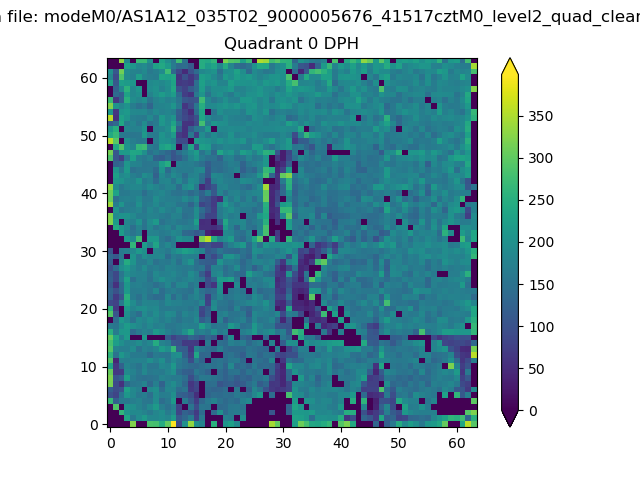 |
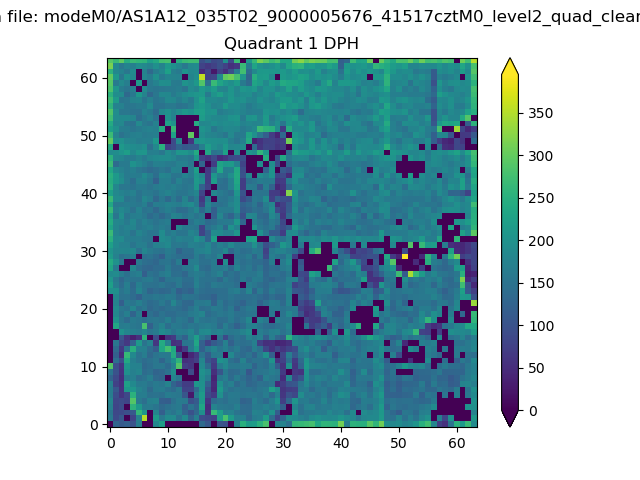 |
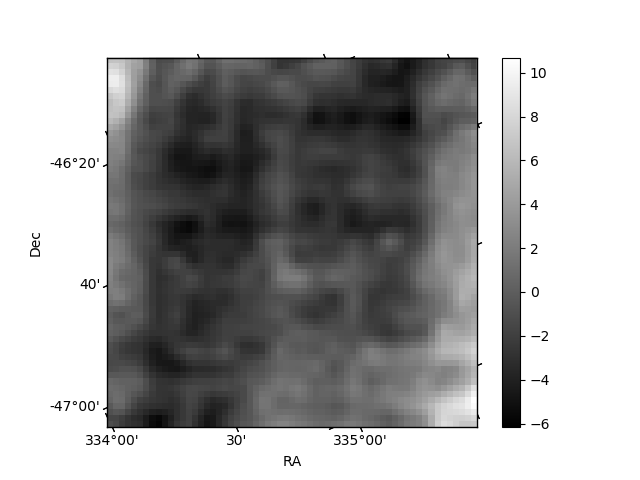
Quadrant B |
|---|---|---|---|
| Quadrant D | 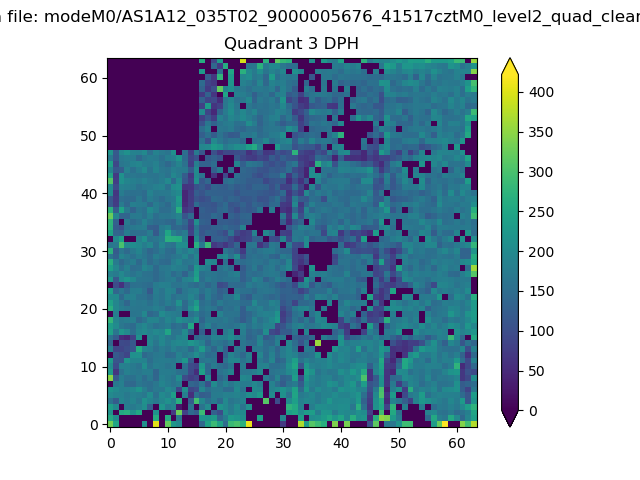 |
 |
Quadrant C |
| Plot type | Count rate plots | Images |
|---|---|---|
| Comparison with Poisson distribution Blue bars denote a histogram of data divided into 1 sec bins. Red curve is a Poisson curve with rate = median count rate of data. |
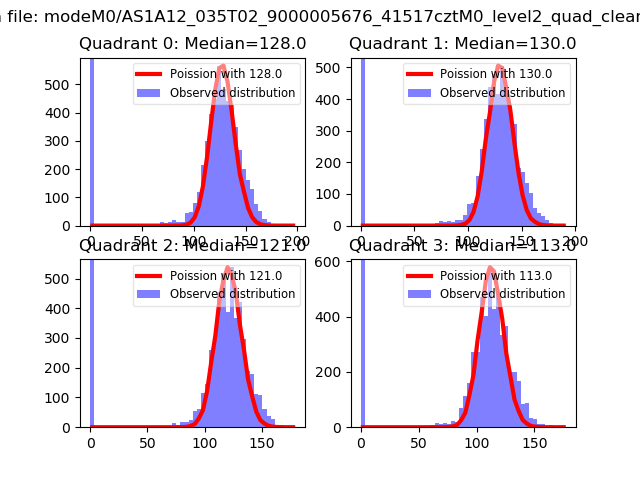 |
 |
| Quadrant-wise count rates Data is divided into 100 sec bins |
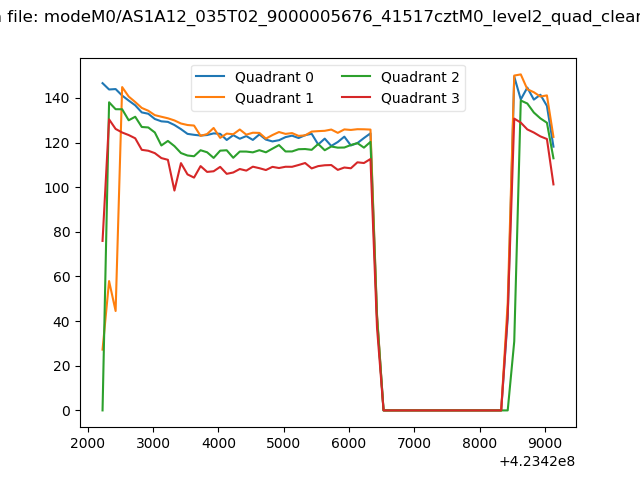 |
|
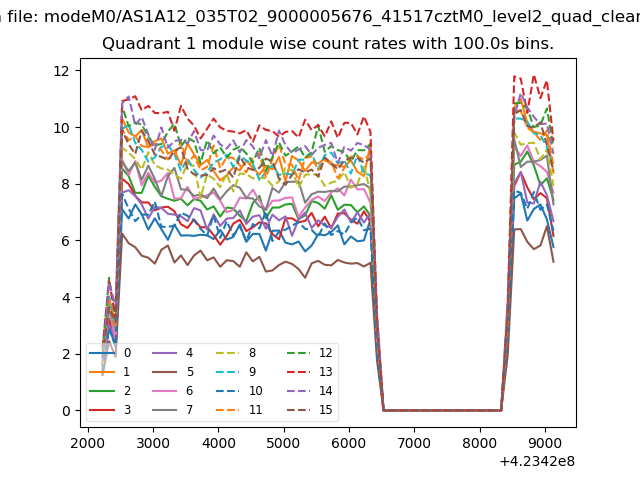
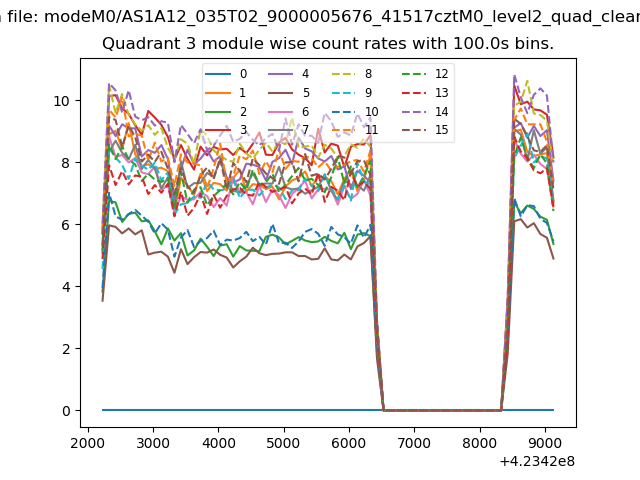
| Module-wise count rates for Quadrant A Data is divided into 100 sec bins |
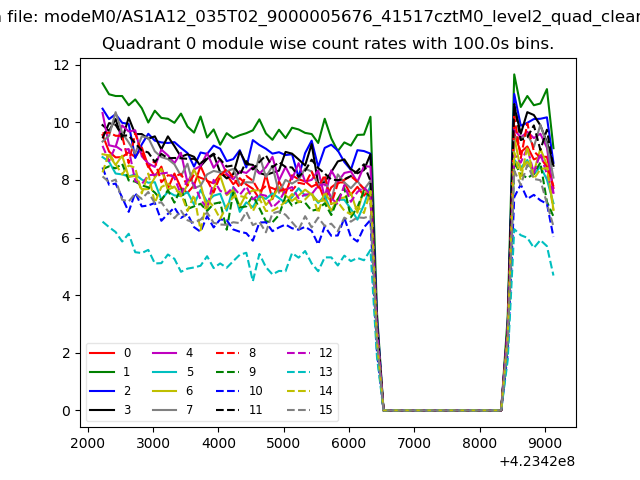 |
 |
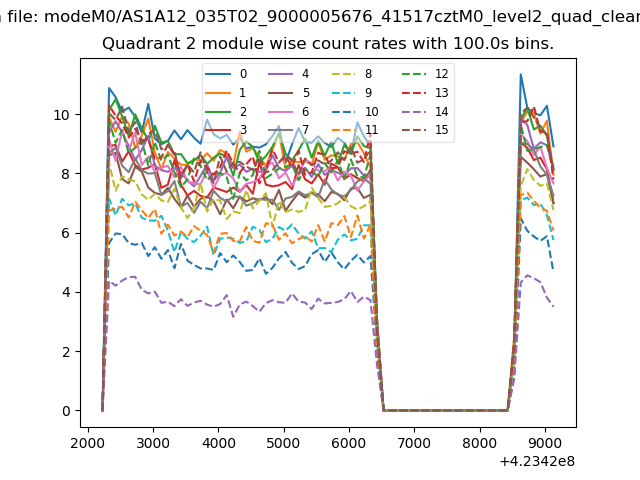
| Module-wise count rates for Quadrant B Data is divided into 100 sec bins |
 |
 |
| Module-wise count rates for Quadrant C Data is divided into 100 sec bins |
 |
 |
| Module-wise count rates for Quadrant D Data is divided into 100 sec bins |
 |
 |
| Parameter | Plot |
|---|---|
| CZT HV Monitor | 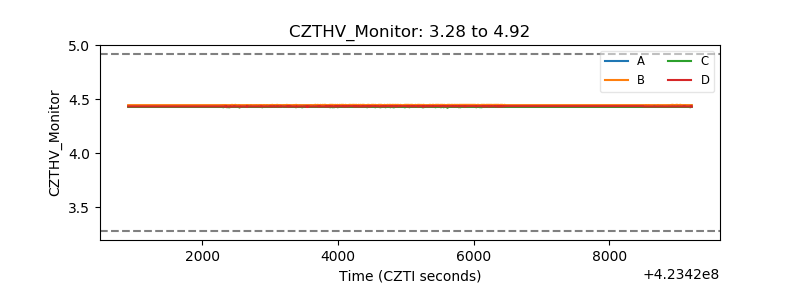 |
| D_VDD | 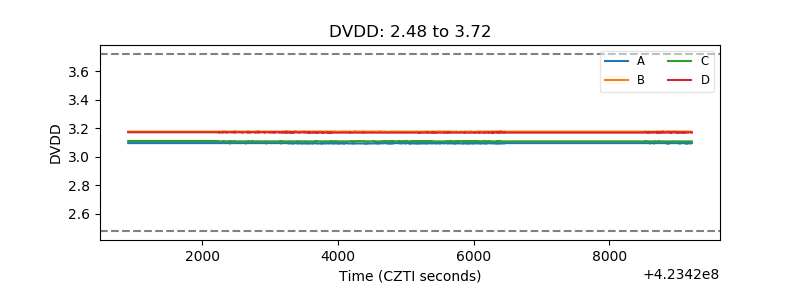 |
| Temperature 1 | 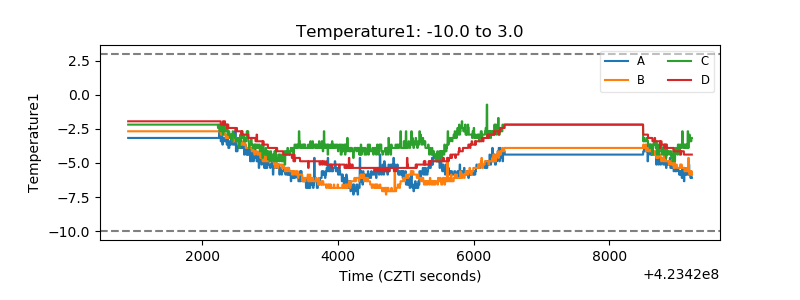 |
| Veto HV Monitor | 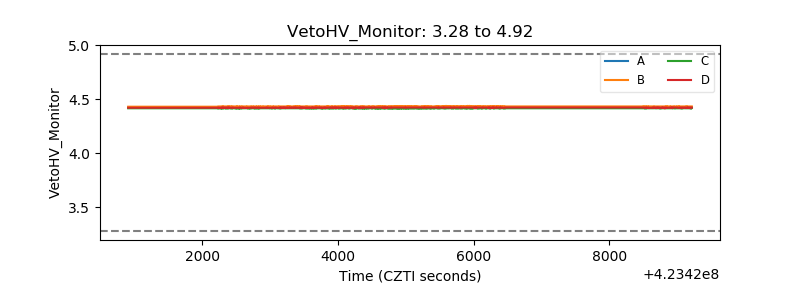 |
| Veto LLD | 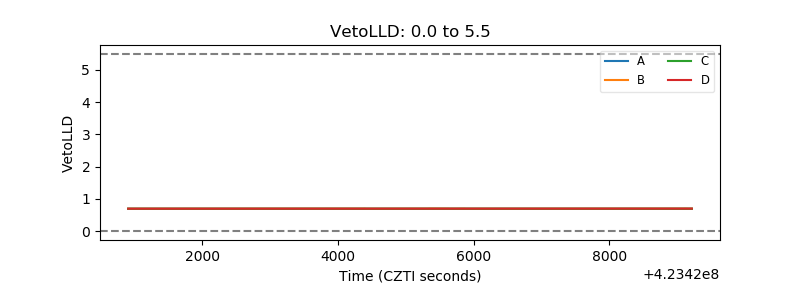 |
| Alpha Counter | 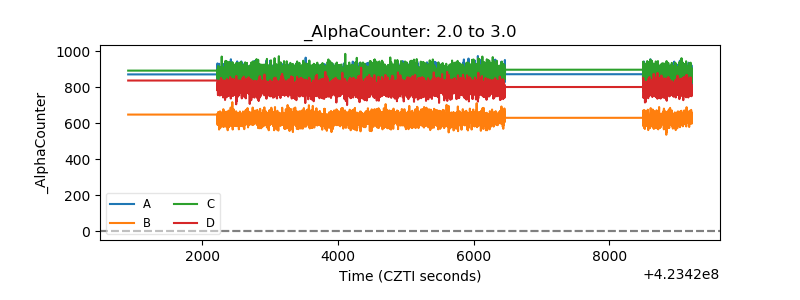 |
| _CPM_Rate | 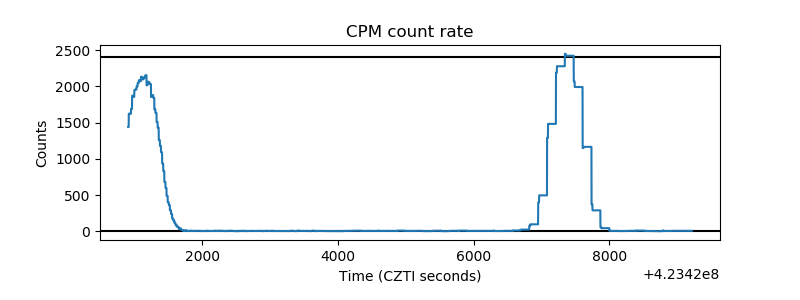 |
| CZT Counter | 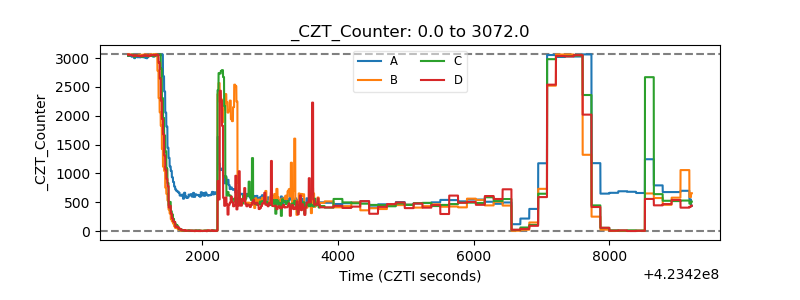 |
| +2.5 Volts monitor | 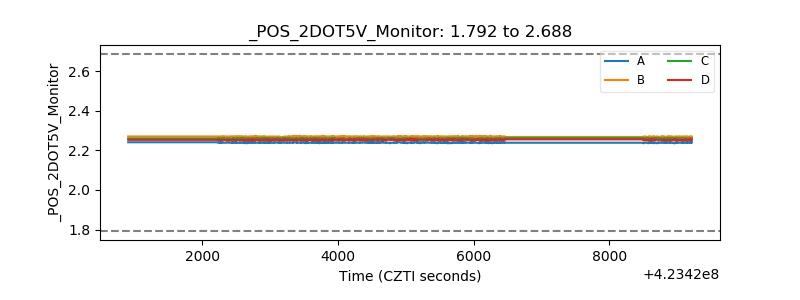 |
| +5 Volts monitor | 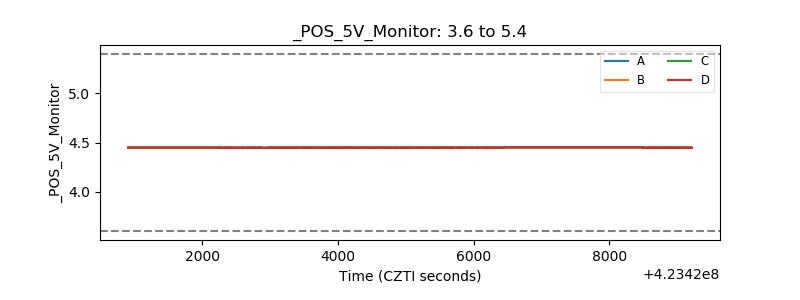 |
| _ROLL_ROT | 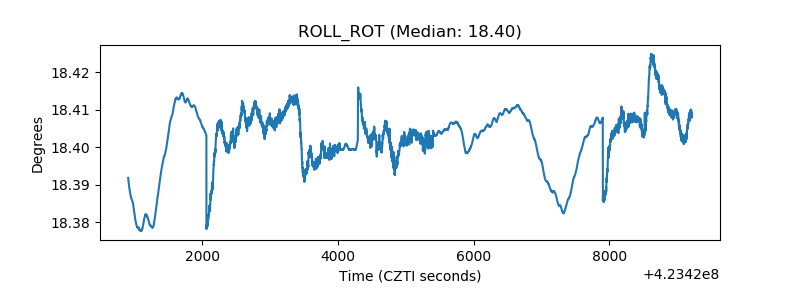 |
| _Roll_DEC | 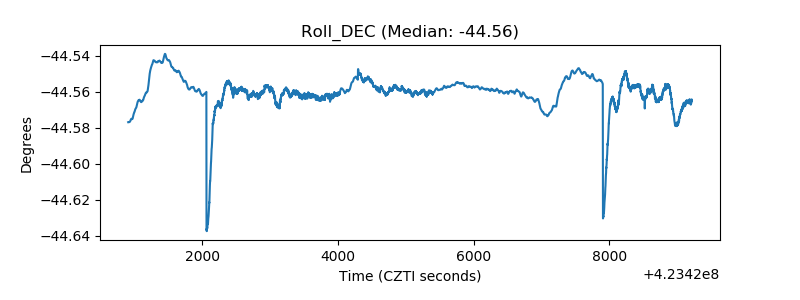 |
| _Roll_RA | 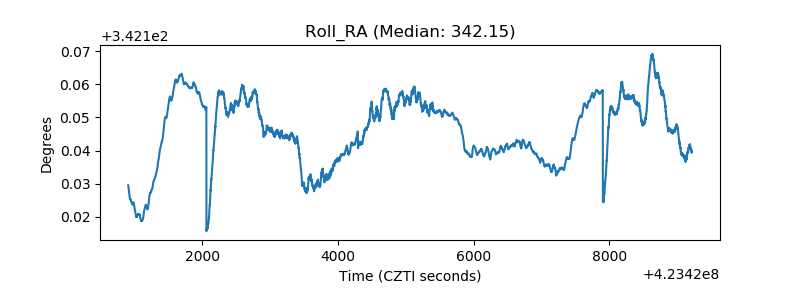 |
| Veto Counter | 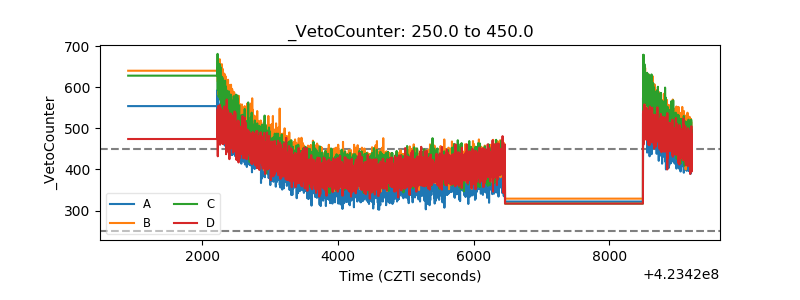 |