| Param | Original file | Final file |
|---|---|---|
| Filename | modeM0/AS1A12_035T02_9000005676_41518cztM0_level2.fits | modeM0/AS1A12_035T02_9000005676_41518cztM0_level2_quad_clean.evt |
| Size (bytes) | 306,653,760 | 90,210,240 |
| Size | 292.4 MB | 86.0 MB |
| Events in quadrant A | 2,744,125 | 627,365 |
| Events in quadrant B | 2,454,927 | 640,858 |
| Events in quadrant C | 3,028,108 | 570,167 |
| Events in quadrant D | 2,744,534 | 551,679 |
| Mode SS | |||
|---|---|---|---|
| Quadrant | BADHDUFLAG | Total packets | Discarded packets |
| A | 0 | 100 | 0 |
| B | 0 | 100 | 0 |
| C | 0 | 100 | 0 |
| D | 0 | 100 | 0 |
| Mode M0 | |||
|---|---|---|---|
| Quadrant | BADHDUFLAG | Total packets | Discarded packets |
| A | 0 | 11030 | 3 |
| B | 0 | 10432 | 2 |
| C | 0 | 11803 | 2 |
| D | 0 | 11355 | 2 |
| Mode M9 | |||
|---|---|---|---|
| Quadrant | BADHDUFLAG | Total packets | Discarded packets |
| A | 0 | 26 | 0 |
| B | 0 | 26 | 0 |
| C | 0 | 26 | 0 |
| D | 0 | 27 | 0 |
| Quadrant | Total seconds | Saturated seconds | Saturation percentage |
|---|---|---|---|
| A | 4869 | 15 | 0.308071% |
| B | 4869 | 14 | 0.287533% |
| C | 4869 | 243 | 4.990758% |
| D | 4869 | 58 | 1.191210% |
Noise dominated data is calculated using 1-second bins in cleaned event files. If a bin has >2000 counts, and if more than 50% of those come from <1% of pixels, then it is considered to be noise-dominated and hence unusable.
| Quadrant | # 1 sec bins | Bins with >0 counts | Bins with >2000 counts | High rate bins dominated by noise | Noise dominated (total time) | Noise dominated (detector-on time) | Marked lightcurve |
|---|---|---|---|---|---|---|---|
| A | 6992 | 4870 | 5 | 5 | 0.07% | 0.10% | 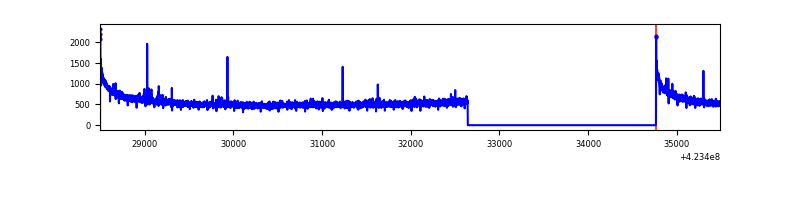 |
| B | 6992 | 4870 | 7 | 7 | 0.10% | 0.14% | 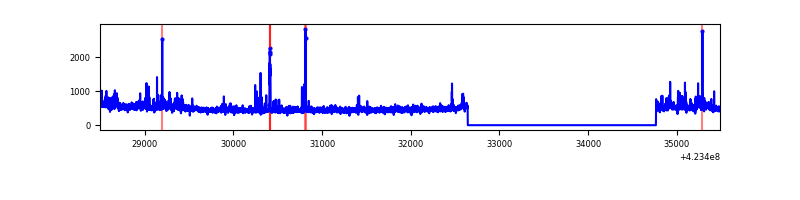 |
| C | 6992 | 4870 | 244 | 244 | 3.49% | 5.01% | 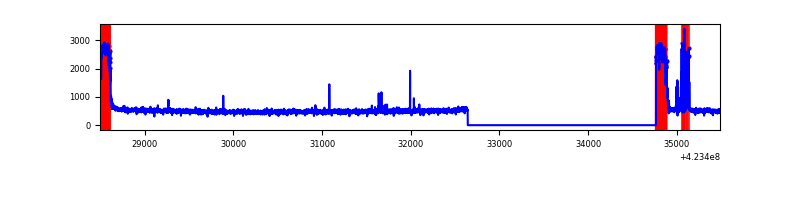 |
| D | 6992 | 4870 | 53 | 53 | 0.76% | 1.09% | 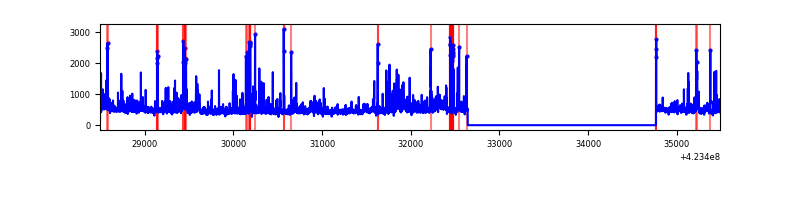 |
Top three noisy pixels from each quadrant. If the there are fewer than three noisy pixels in the level2.evt file, extra rows are filled as -1
| Pixel properties | Quadrant properties | ||||||
|---|---|---|---|---|---|---|---|
| Quadrant | DetID | PixID | Counts | Sigma | Mean | Median | Sigma |
| A | 10 | 83 | 485919 | 4114.99 | 577 | 567 | 117.9 |
| A | 13 | 248 | 17809 | 146.18 | 577 | 567 | 117.9 |
| A | 13 | 6 | 9095 | 72.3 | 577 | 567 | 117.9 |
| B | 0 | 245 | 79582 | 725.95 | 574 | 559 | 108.9 |
| B | 5 | 255 | 50646 | 460.13 | 574 | 559 | 108.9 |
| B | 0 | 190 | 42724 | 387.35 | 574 | 559 | 108.9 |
| C | 0 | 10 | 578899 | 4602.25 | 545 | 550 | 125.7 |
| C | 15 | 214 | 197247 | 1565.23 | 545 | 550 | 125.7 |
| C | 14 | 254 | 123870 | 981.33 | 545 | 550 | 125.7 |
| D | 1 | 52 | 223059 | 1657.5 | 559 | 545 | 134.2 |
| D | 1 | 47 | 179428 | 1332.5 | 559 | 545 | 134.2 |
| D | 12 | 6 | 57616 | 425.12 | 559 | 545 | 134.2 |
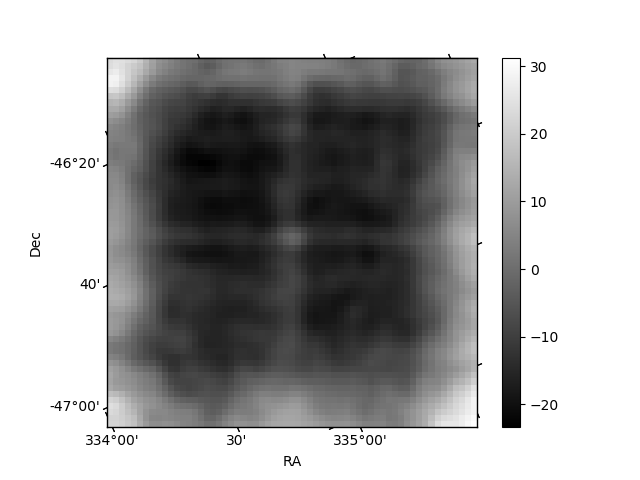
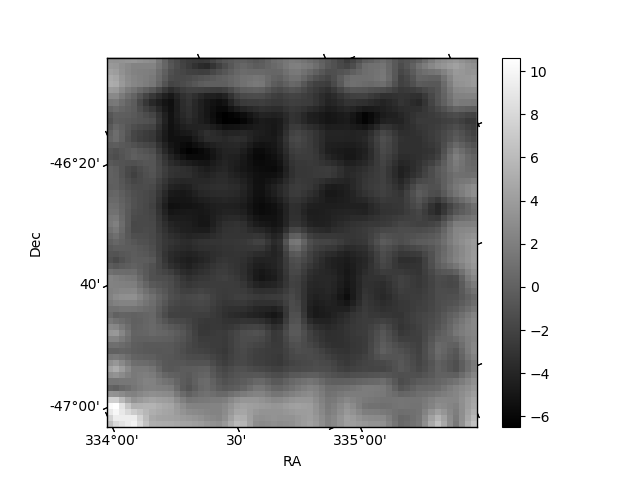
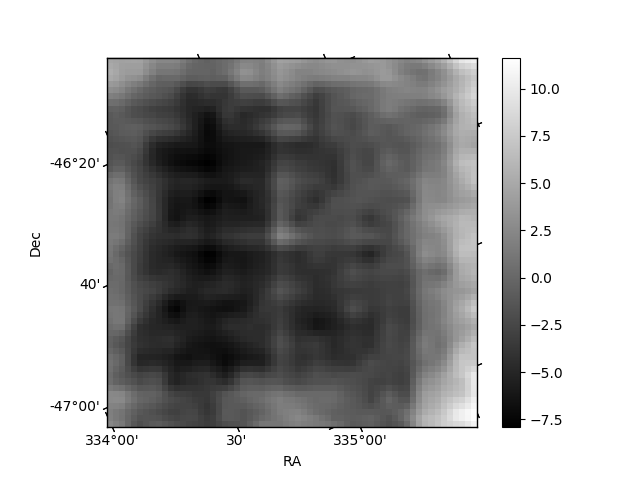
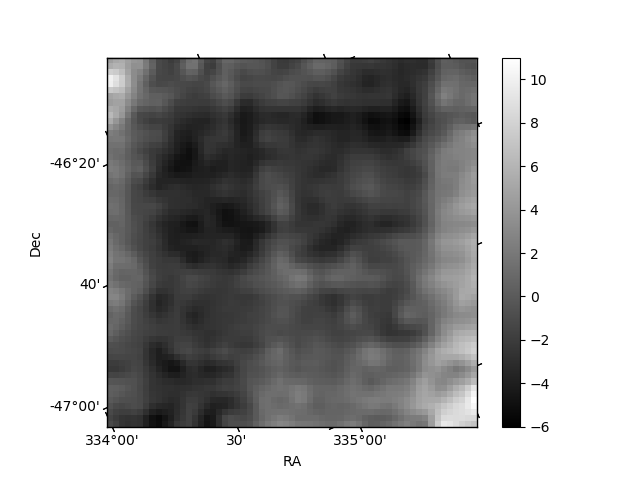
Histogram calculated using DETX and DETY for each event in the final _common_clean file
| Quadrant A | 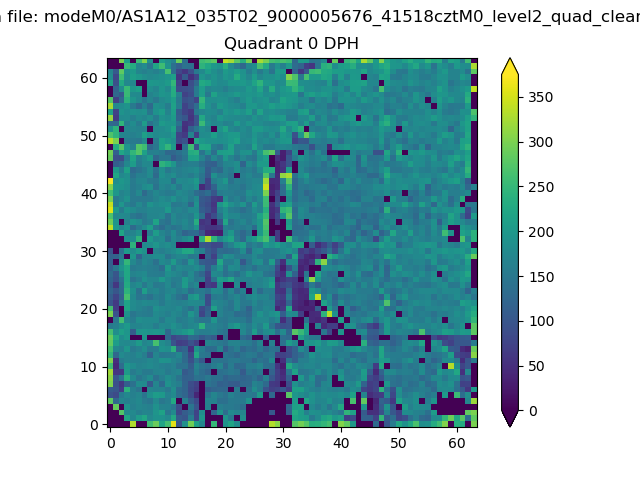 |
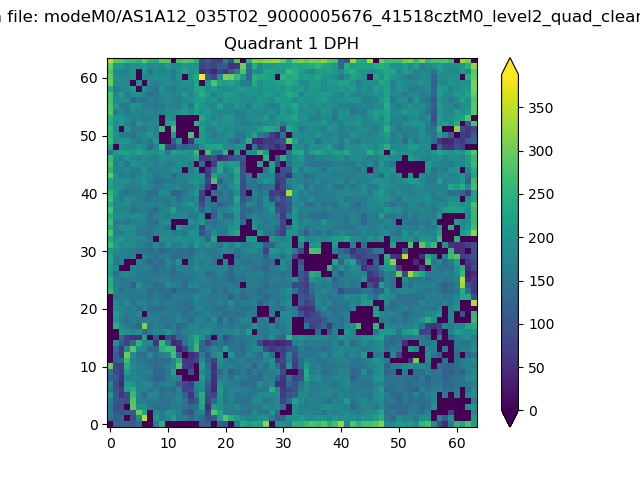 |
Quadrant B |
|---|---|---|---|
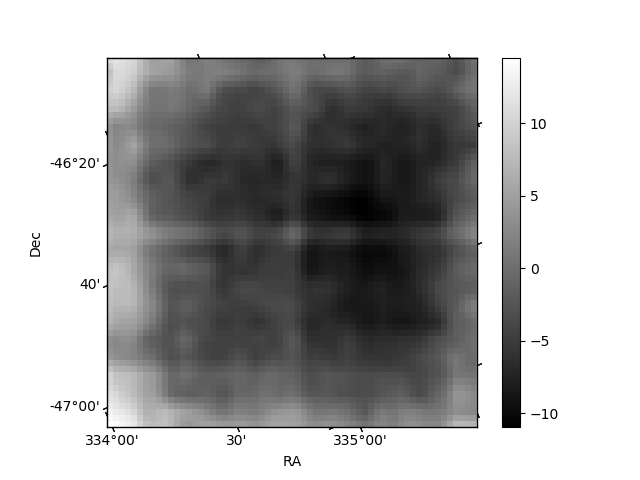
| Quadrant D | 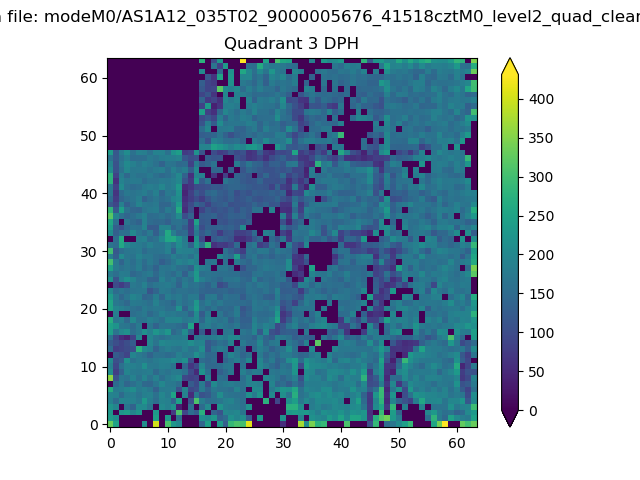 |
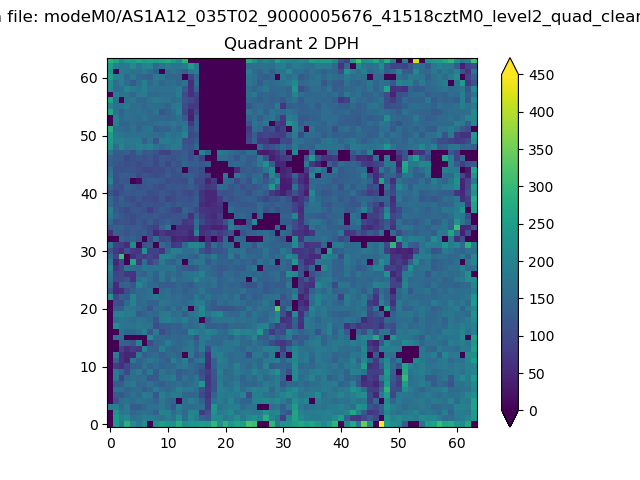 |
Quadrant C |
| Plot type | Count rate plots | Images |
|---|---|---|
| Comparison with Poisson distribution Blue bars denote a histogram of data divided into 1 sec bins. Red curve is a Poisson curve with rate = median count rate of data. |
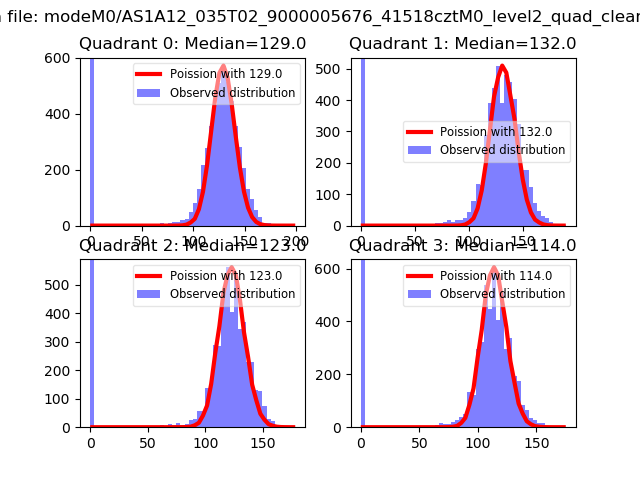 |
 |
| Quadrant-wise count rates Data is divided into 100 sec bins |
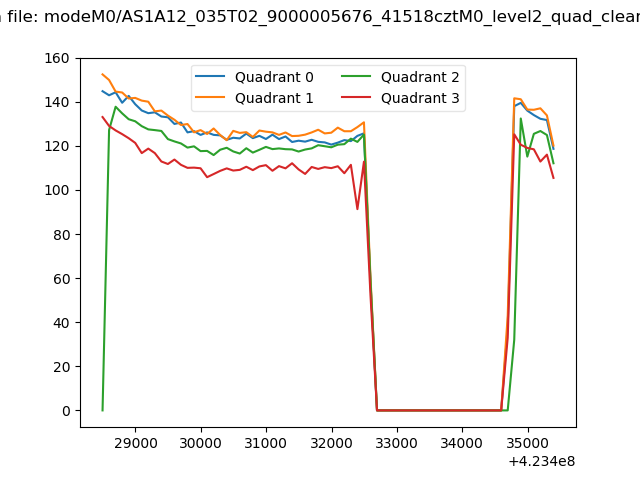 |
|
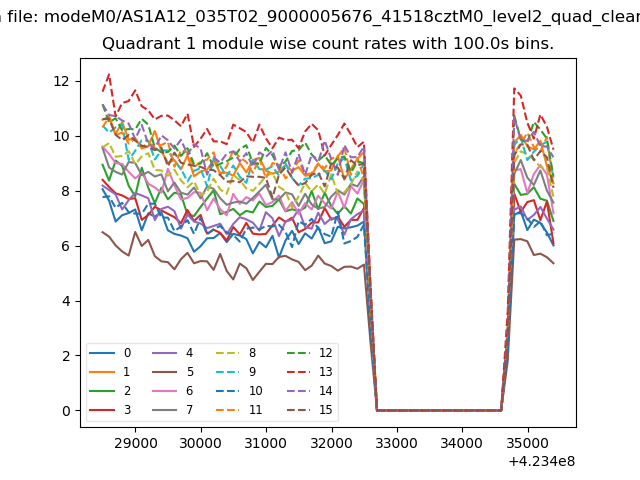
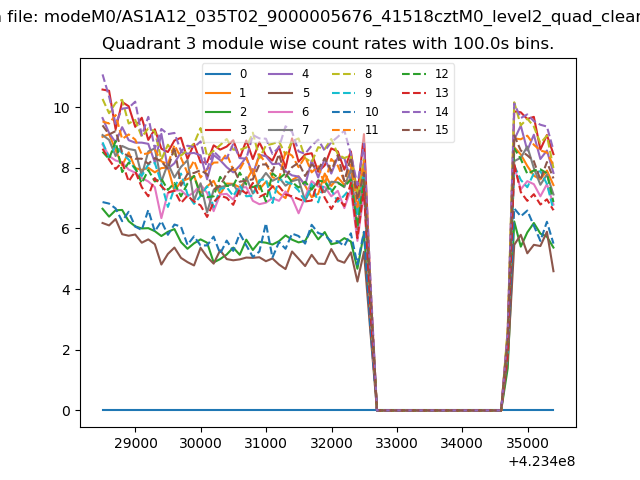
| Module-wise count rates for Quadrant A Data is divided into 100 sec bins |
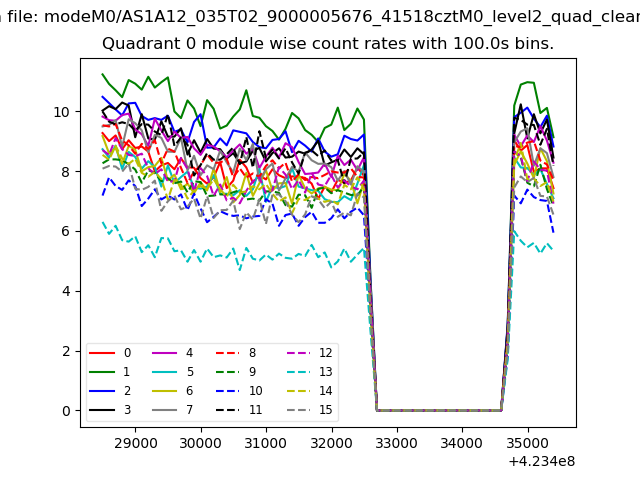 |
 |
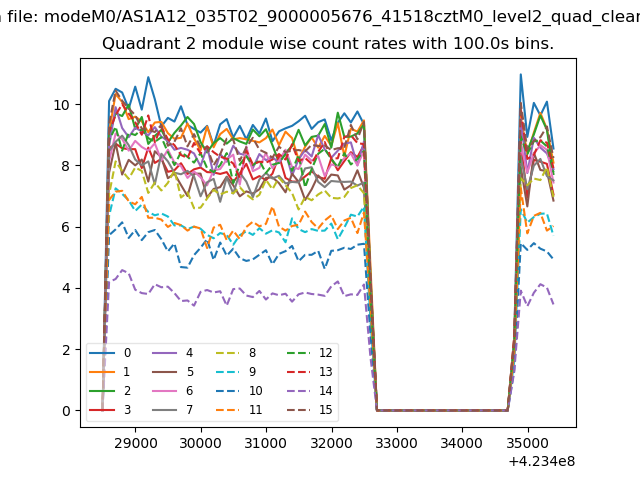
| Module-wise count rates for Quadrant B Data is divided into 100 sec bins |
 |
 |
| Module-wise count rates for Quadrant C Data is divided into 100 sec bins |
 |
 |
| Module-wise count rates for Quadrant D Data is divided into 100 sec bins |
 |
 |
| Parameter | Plot |
|---|---|
| CZT HV Monitor | 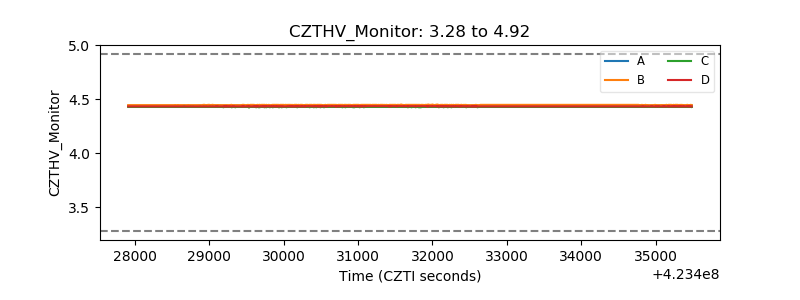 |
| D_VDD | 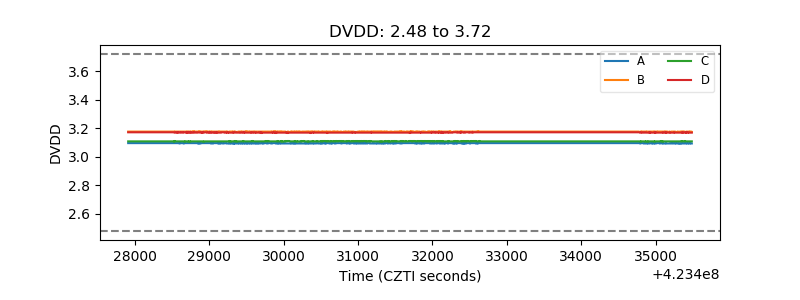 |
| Temperature 1 | 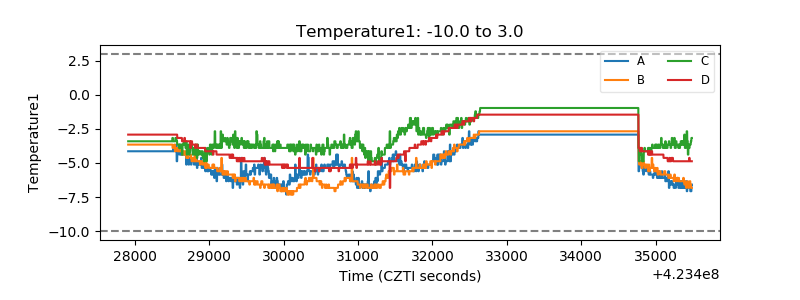 |
| Veto HV Monitor | 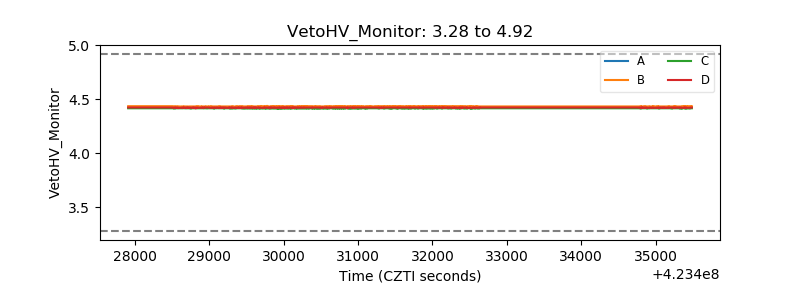 |
| Veto LLD | 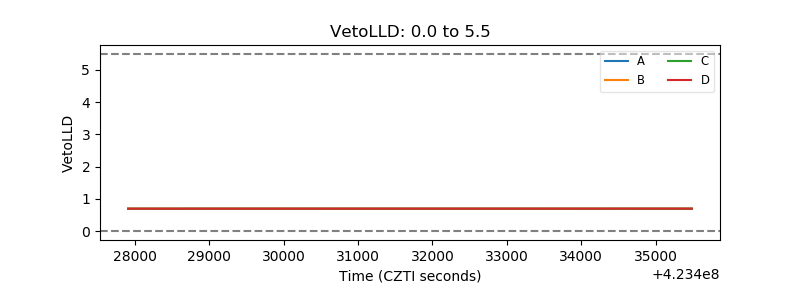 |
| Alpha Counter | 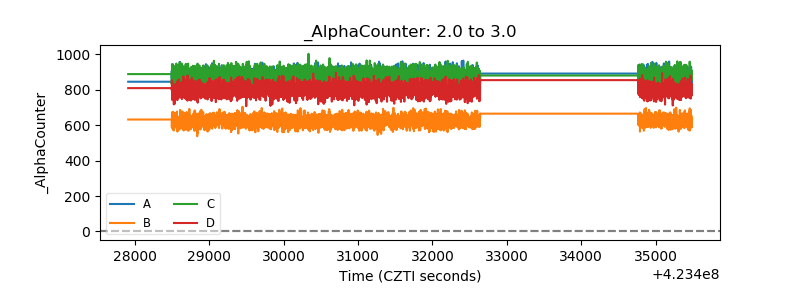 |
| _CPM_Rate | 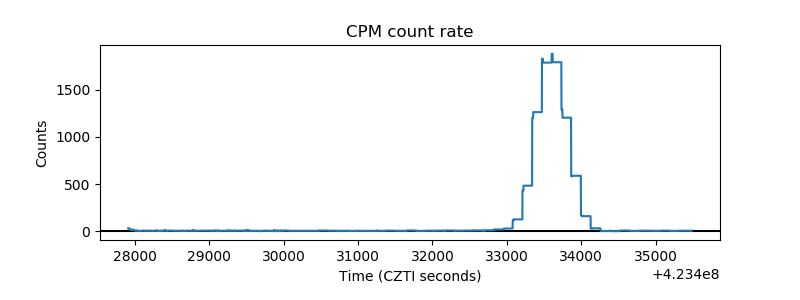 |
| CZT Counter | 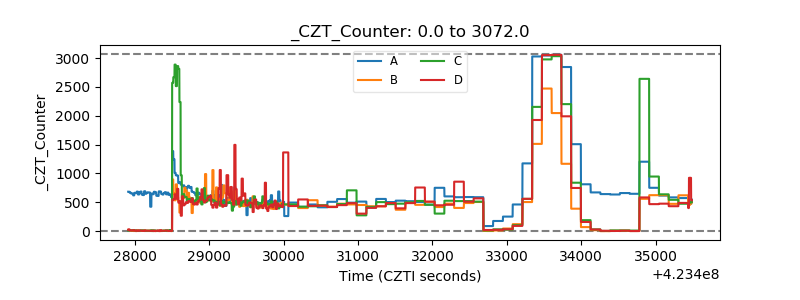 |
| +2.5 Volts monitor | 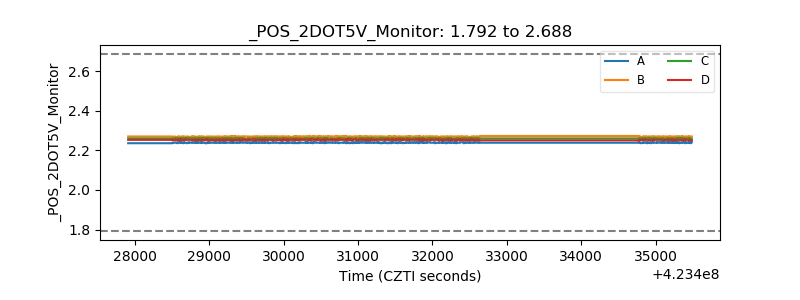 |
| +5 Volts monitor | 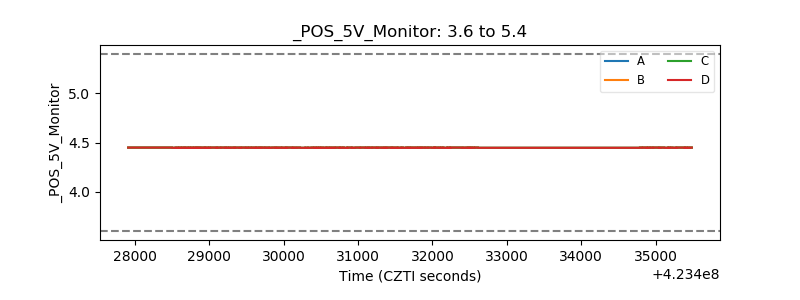 |
| _ROLL_ROT | 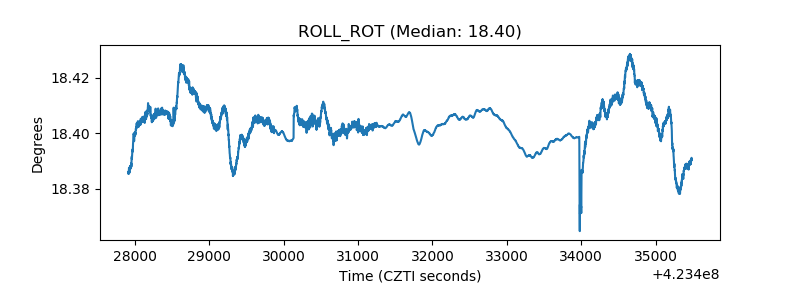 |
| _Roll_DEC | 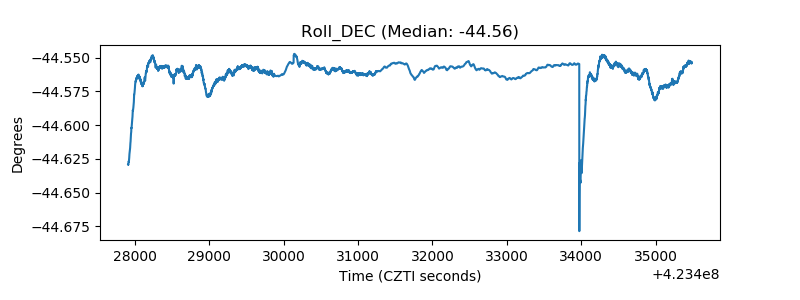 |
| _Roll_RA | 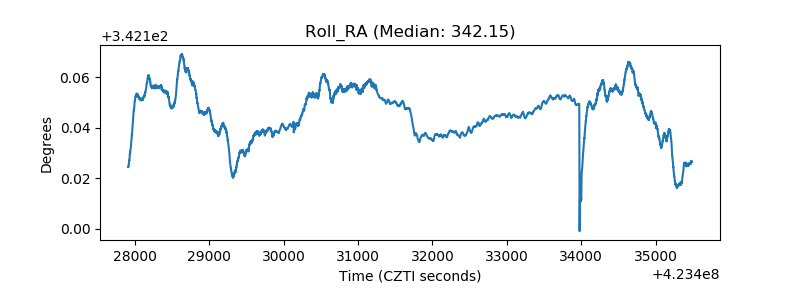 |
| Veto Counter | 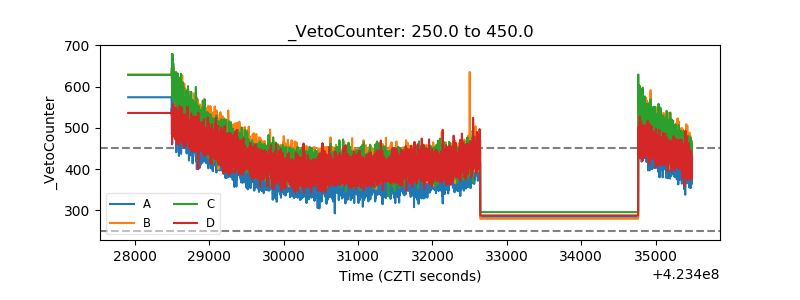 |