| Param | Original file | Final file |
|---|---|---|
| Filename | modeM0/AS1A12_035T02_9000005676_41519cztM0_level2.fits | modeM0/AS1A12_035T02_9000005676_41519cztM0_level2_quad_clean.evt |
| Size (bytes) | 315,541,440 | 88,318,080 |
| Size | 300.9 MB | 84.2 MB |
| Events in quadrant A | 2,681,969 | 610,763 |
| Events in quadrant B | 2,436,218 | 624,593 |
| Events in quadrant C | 3,148,366 | 557,405 |
| Events in quadrant D | 3,028,688 | 535,097 |
| Mode SS | |||
|---|---|---|---|
| Quadrant | BADHDUFLAG | Total packets | Discarded packets |
| A | 0 | 102 | 0 |
| B | 0 | 102 | 0 |
| C | 0 | 102 | 0 |
| D | 0 | 102 | 0 |
| Mode M0 | |||
|---|---|---|---|
| Quadrant | BADHDUFLAG | Total packets | Discarded packets |
| A | 0 | 10887 | 3 |
| B | 0 | 10413 | 2 |
| C | 0 | 12284 | 2 |
| D | 0 | 12330 | 2 |
| Mode M9 | |||
|---|---|---|---|
| Quadrant | BADHDUFLAG | Total packets | Discarded packets |
| A | 0 | 39 | 0 |
| B | 0 | 39 | 0 |
| C | 0 | 39 | 0 |
| D | 0 | 40 | 0 |
| Quadrant | Total seconds | Saturated seconds | Saturation percentage |
|---|---|---|---|
| A | 4940 | 12 | 0.242915% |
| B | 4940 | 9 | 0.182186% |
| C | 4940 | 271 | 5.485830% |
| D | 4940 | 158 | 3.198381% |
Noise dominated data is calculated using 1-second bins in cleaned event files. If a bin has >2000 counts, and if more than 50% of those come from <1% of pixels, then it is considered to be noise-dominated and hence unusable.
| Quadrant | # 1 sec bins | Bins with >0 counts | Bins with >2000 counts | High rate bins dominated by noise | Noise dominated (total time) | Noise dominated (detector-on time) | Marked lightcurve |
|---|---|---|---|---|---|---|---|
| A | 7063 | 4941 | 4 | 4 | 0.06% | 0.08% | 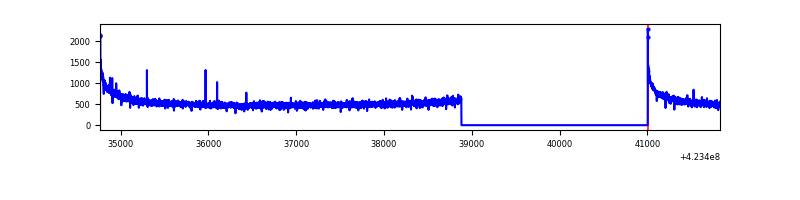 |
| B | 7063 | 4941 | 2 | 2 | 0.03% | 0.04% | 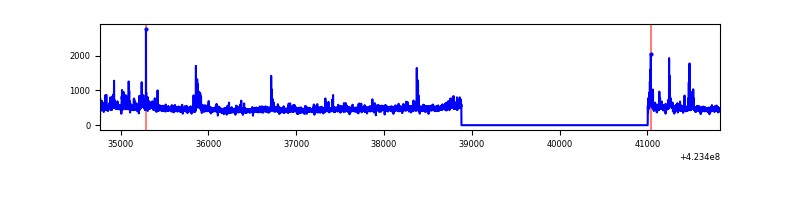 |
| C | 7063 | 4941 | 273 | 273 | 3.87% | 5.53% | 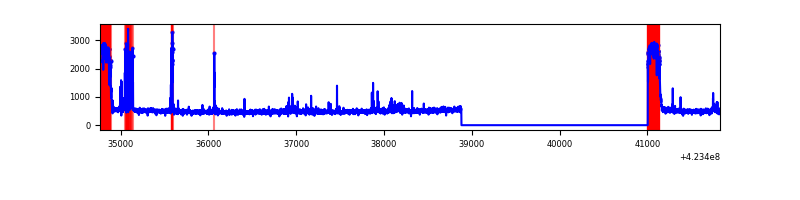 |
| D | 7063 | 4941 | 140 | 140 | 1.98% | 2.83% | 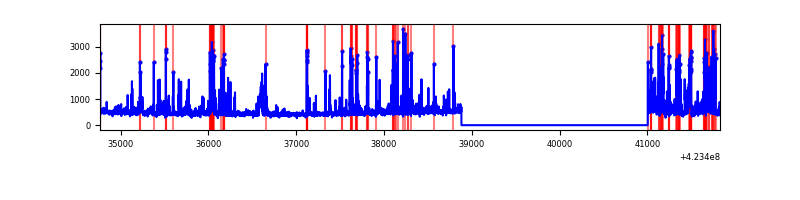 |
Top three noisy pixels from each quadrant. If the there are fewer than three noisy pixels in the level2.evt file, extra rows are filled as -1
| Pixel properties | Quadrant properties | ||||||
|---|---|---|---|---|---|---|---|
| Quadrant | DetID | PixID | Counts | Sigma | Mean | Median | Sigma |
| A | 10 | 83 | 478686 | 4132.86 | 566 | 555 | 115.7 |
| A | 13 | 254 | 7882 | 63.33 | 566 | 555 | 115.7 |
| A | 13 | 6 | 7315 | 58.43 | 566 | 555 | 115.7 |
| B | 0 | 245 | 60878 | 562.14 | 565 | 550 | 107.3 |
| B | 0 | 183 | 59489 | 549.2 | 565 | 550 | 107.3 |
| B | 0 | 190 | 53444 | 492.87 | 565 | 550 | 107.3 |
| C | 0 | 10 | 638336 | 5149.1 | 538 | 542 | 123.9 |
| C | 14 | 254 | 201066 | 1618.89 | 538 | 542 | 123.9 |
| C | 15 | 214 | 197370 | 1589.05 | 538 | 542 | 123.9 |
| D | 1 | 52 | 438080 | 3248.41 | 549 | 535 | 134.7 |
| D | 1 | 47 | 159997 | 1183.87 | 549 | 535 | 134.7 |
| D | 13 | 249 | 108173 | 799.12 | 549 | 535 | 134.7 |
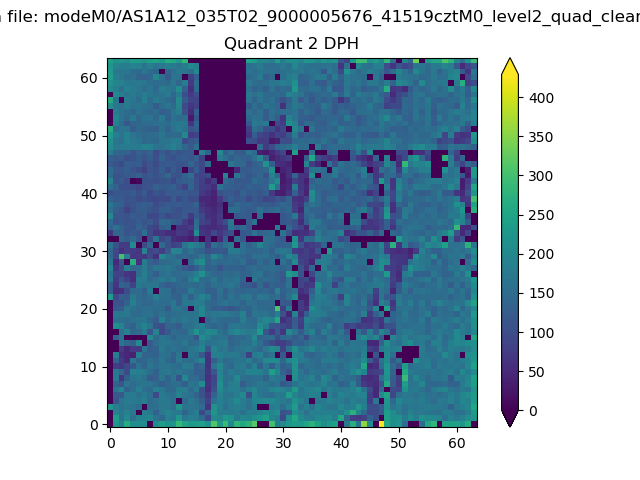
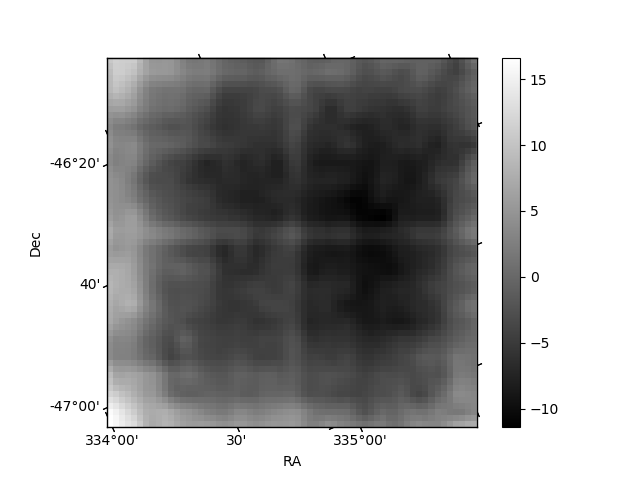
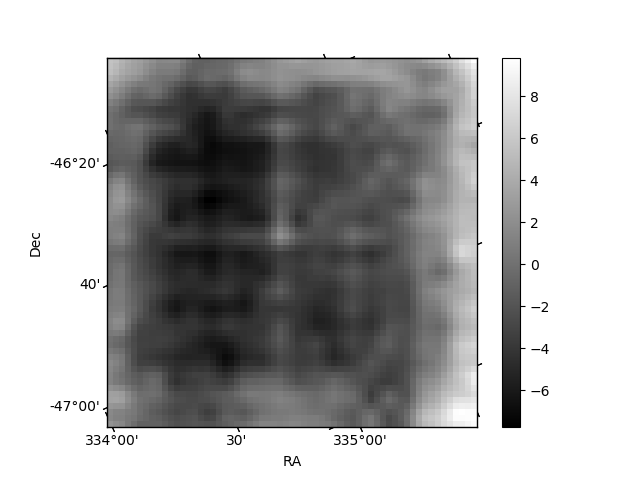
Histogram calculated using DETX and DETY for each event in the final _common_clean file
| Quadrant A | 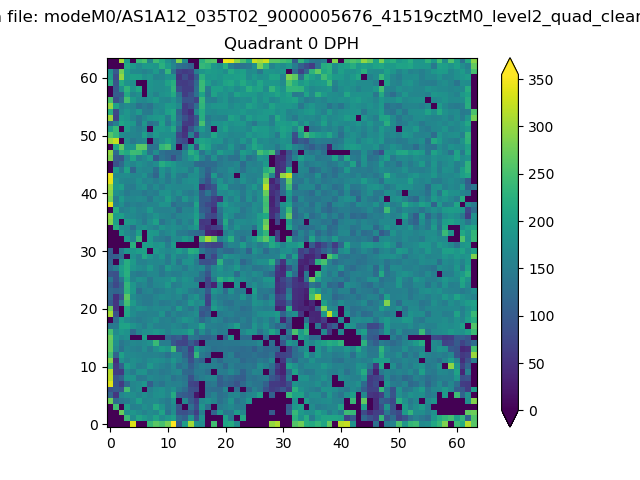 |
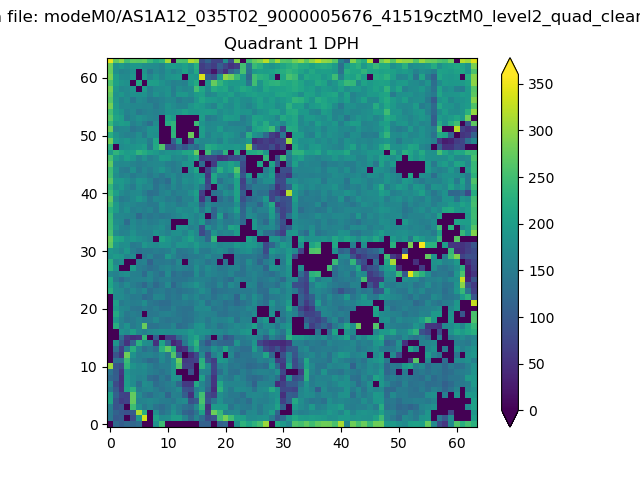 |
Quadrant B |
|---|---|---|---|
| Quadrant D | 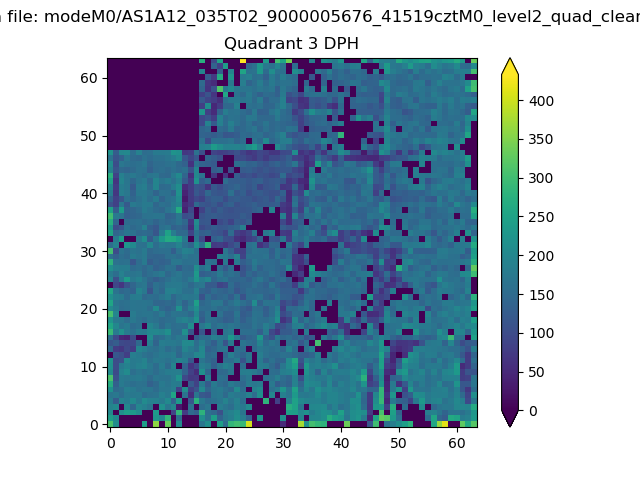 |
 |
Quadrant C |
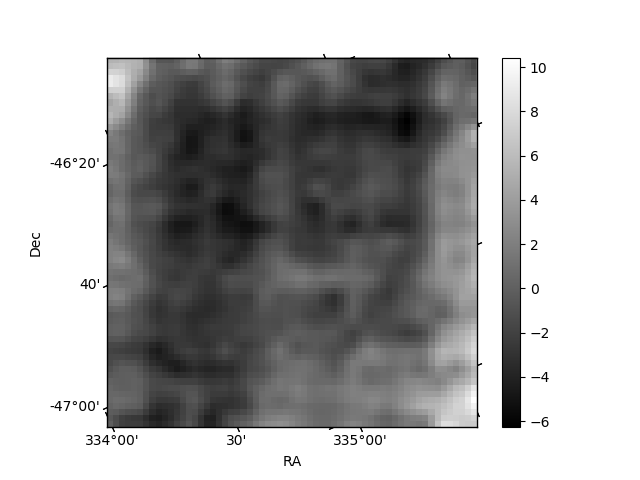
| Plot type | Count rate plots | Images |
|---|---|---|
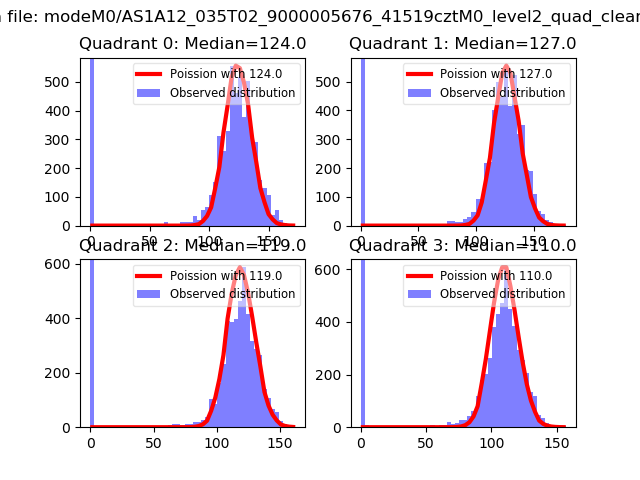
| Comparison with Poisson distribution Blue bars denote a histogram of data divided into 1 sec bins. Red curve is a Poisson curve with rate = median count rate of data. |
 |
 |
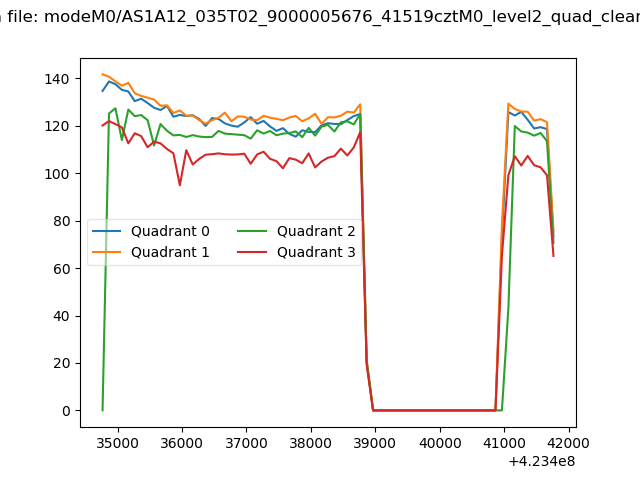
| Quadrant-wise count rates Data is divided into 100 sec bins |
 |
|
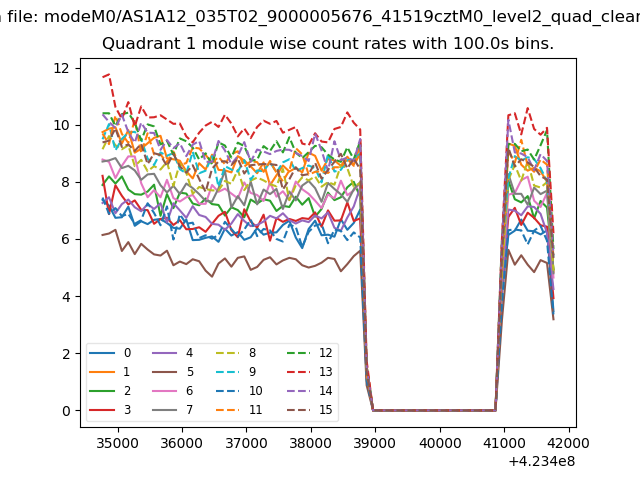
| Module-wise count rates for Quadrant A Data is divided into 100 sec bins |
 |
 |
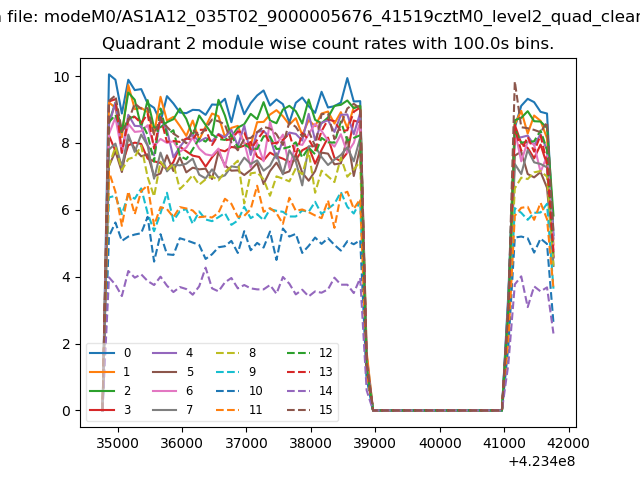
| Module-wise count rates for Quadrant B Data is divided into 100 sec bins |
 |
 |
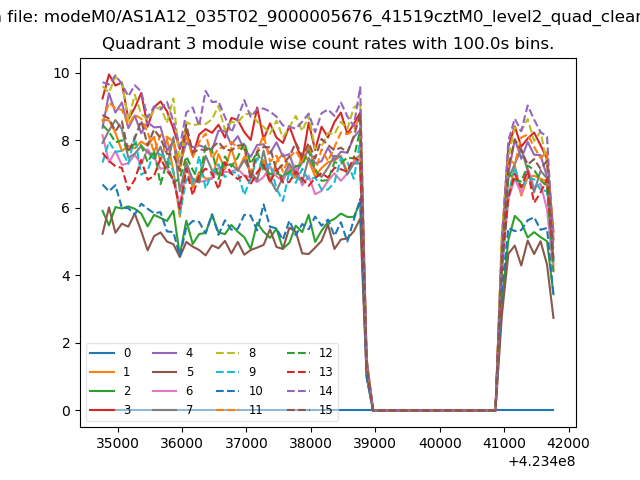
| Module-wise count rates for Quadrant C Data is divided into 100 sec bins |
 |
 |
| Module-wise count rates for Quadrant D Data is divided into 100 sec bins |
 |
 |
| Parameter | Plot |
|---|---|
| CZT HV Monitor | 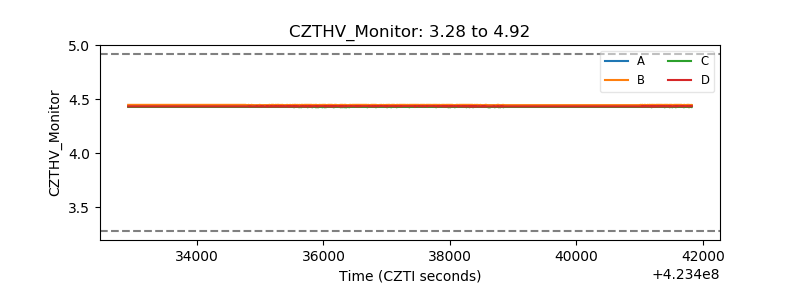 |
| D_VDD | 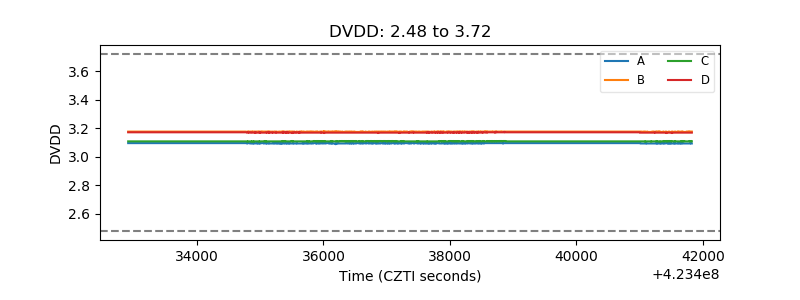 |
| Temperature 1 | 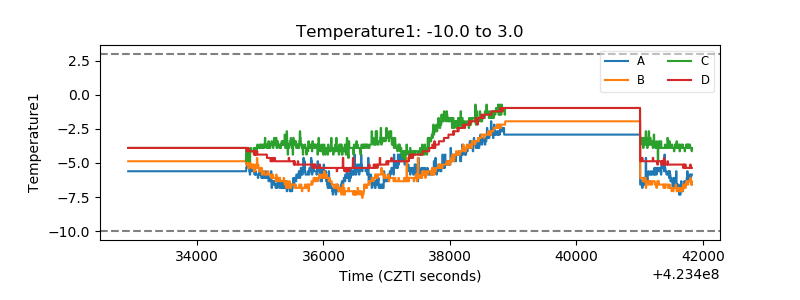 |
| Veto HV Monitor | 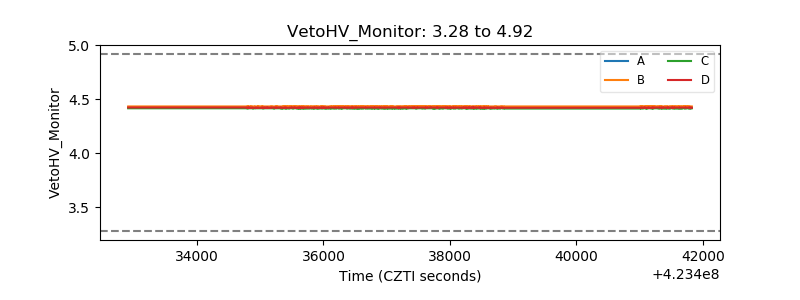 |
| Veto LLD | 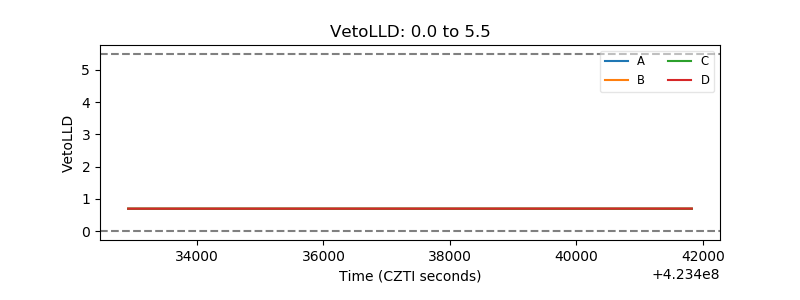 |
| Alpha Counter | 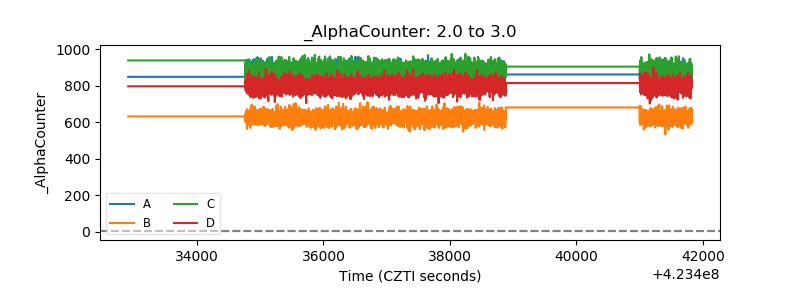 |
| _CPM_Rate | 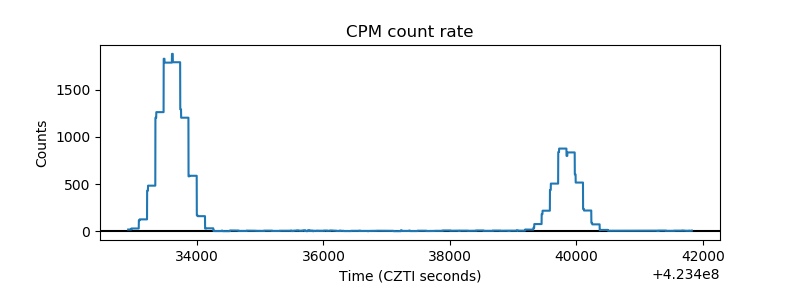 |
| CZT Counter | 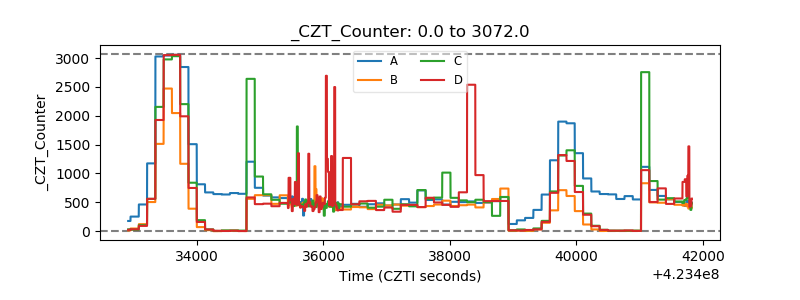 |
| +2.5 Volts monitor | 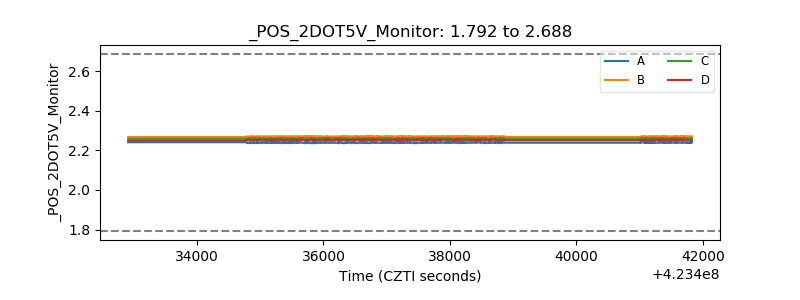 |
| +5 Volts monitor | 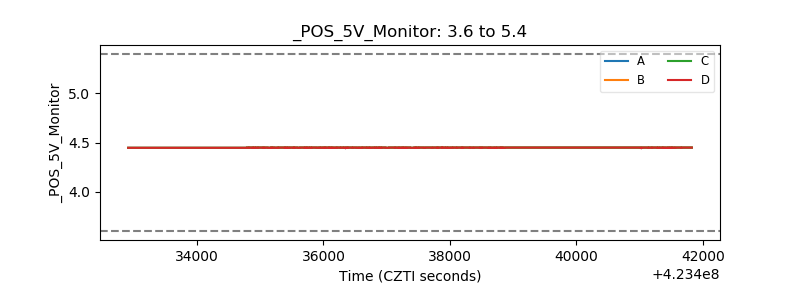 |
| _ROLL_ROT | 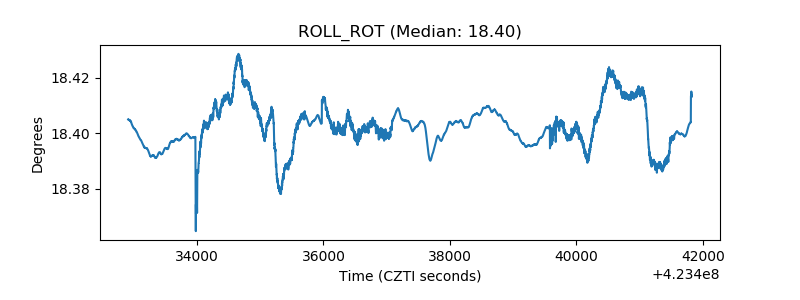 |
| _Roll_DEC | 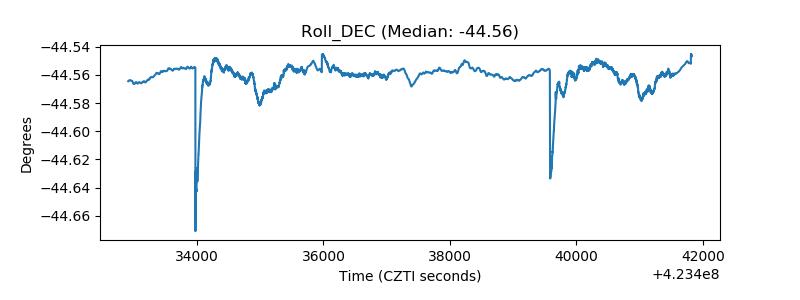 |
| _Roll_RA | 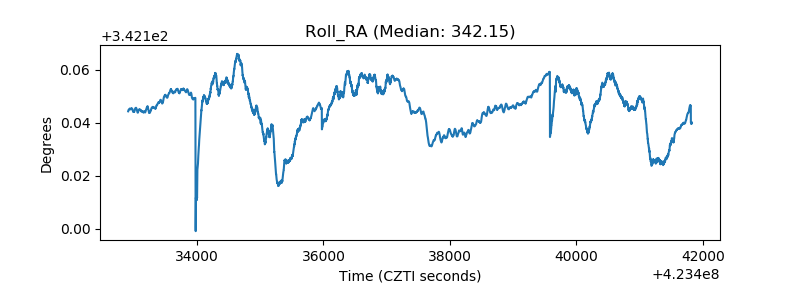 |
| Veto Counter | 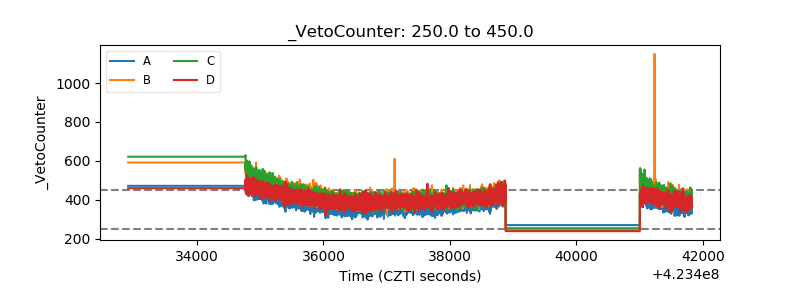 |