| Param | Original file | Final file |
|---|---|---|
| Filename | modeM0/AS1A12_035T02_9000005676_41520cztM0_level2.fits | modeM0/AS1A12_035T02_9000005676_41520cztM0_level2_quad_clean.evt |
| Size (bytes) | 315,944,640 | 84,732,480 |
| Size | 301.3 MB | 80.8 MB |
| Events in quadrant A | 2,643,640 | 583,552 |
| Events in quadrant B | 2,731,332 | 571,625 |
| Events in quadrant C | 2,968,948 | 544,811 |
| Events in quadrant D | 2,960,922 | 514,588 |
| Mode SS | |||
|---|---|---|---|
| Quadrant | BADHDUFLAG | Total packets | Discarded packets |
| A | 0 | 104 | 0 |
| B | 0 | 104 | 0 |
| C | 0 | 104 | 0 |
| D | 0 | 104 | 0 |
| Mode M0 | |||
|---|---|---|---|
| Quadrant | BADHDUFLAG | Total packets | Discarded packets |
| A | 0 | 10890 | 3 |
| B | 0 | 11570 | 2 |
| C | 0 | 11880 | 2 |
| D | 0 | 12375 | 2 |
| Mode M9 | |||
|---|---|---|---|
| Quadrant | BADHDUFLAG | Total packets | Discarded packets |
| A | 0 | 31 | 0 |
| B | 0 | 31 | 0 |
| C | 0 | 31 | 0 |
| D | 0 | 32 | 0 |
| Quadrant | Total seconds | Saturated seconds | Saturation percentage |
|---|---|---|---|
| A | 5004 | 9 | 0.179856% |
| B | 5004 | 227 | 4.536371% |
| C | 5004 | 236 | 4.716227% |
| D | 5004 | 187 | 3.737010% |
Noise dominated data is calculated using 1-second bins in cleaned event files. If a bin has >2000 counts, and if more than 50% of those come from <1% of pixels, then it is considered to be noise-dominated and hence unusable.
| Quadrant | # 1 sec bins | Bins with >0 counts | Bins with >2000 counts | High rate bins dominated by noise | Noise dominated (total time) | Noise dominated (detector-on time) | Marked lightcurve |
|---|---|---|---|---|---|---|---|
| A | 7067 | 5005 | 5 | 5 | 0.07% | 0.10% | 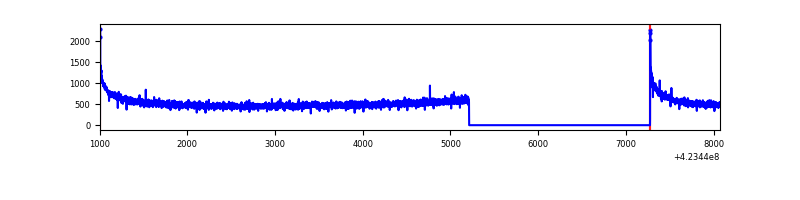 |
| B | 7067 | 5005 | 183 | 183 | 2.59% | 3.66% | 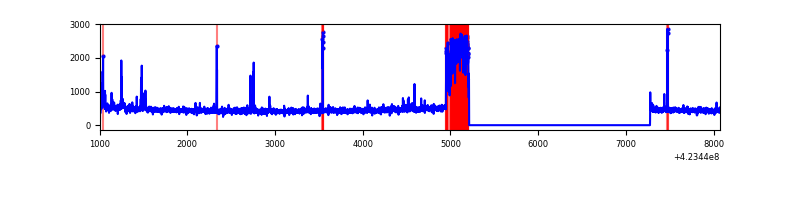 |
| C | 7067 | 5005 | 233 | 233 | 3.30% | 4.66% | 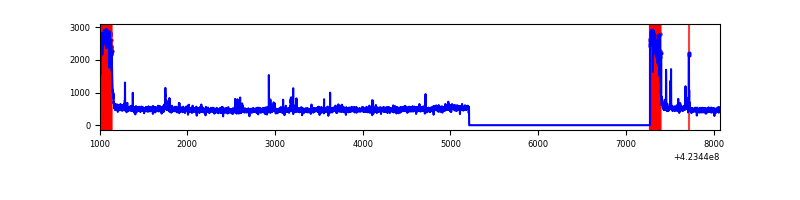 |
| D | 7067 | 5005 | 168 | 168 | 2.38% | 3.36% | 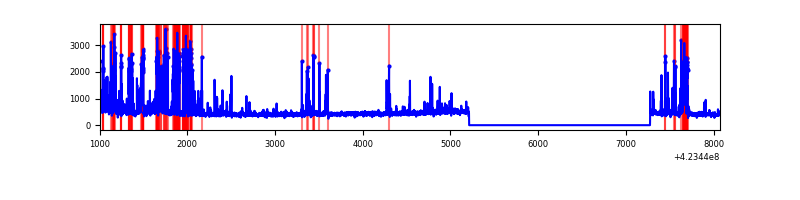 |
Top three noisy pixels from each quadrant. If the there are fewer than three noisy pixels in the level2.evt file, extra rows are filled as -1
| Pixel properties | Quadrant properties | ||||||
|---|---|---|---|---|---|---|---|
| Quadrant | DetID | PixID | Counts | Sigma | Mean | Median | Sigma |
| A | 10 | 83 | 488549 | 4261.37 | 555 | 543 | 114.5 |
| A | 13 | 254 | 8094 | 65.94 | 555 | 543 | 114.5 |
| A | 3 | 137 | 5981 | 47.49 | 555 | 543 | 114.5 |
| B | 0 | 186 | 442782 | 4296.0 | 543 | 528 | 102.9 |
| B | 0 | 190 | 43208 | 414.59 | 543 | 528 | 102.9 |
| B | 5 | 255 | 39427 | 377.86 | 543 | 528 | 102.9 |
| C | 0 | 10 | 606994 | 4924.31 | 533 | 537 | 123.2 |
| C | 15 | 214 | 201209 | 1629.42 | 533 | 537 | 123.2 |
| C | 14 | 254 | 65883 | 530.6 | 533 | 537 | 123.2 |
| D | 1 | 52 | 518096 | 3927.84 | 541 | 526 | 131.8 |
| D | 13 | 249 | 117336 | 886.47 | 541 | 526 | 131.8 |
| D | 1 | 47 | 100919 | 761.88 | 541 | 526 | 131.8 |
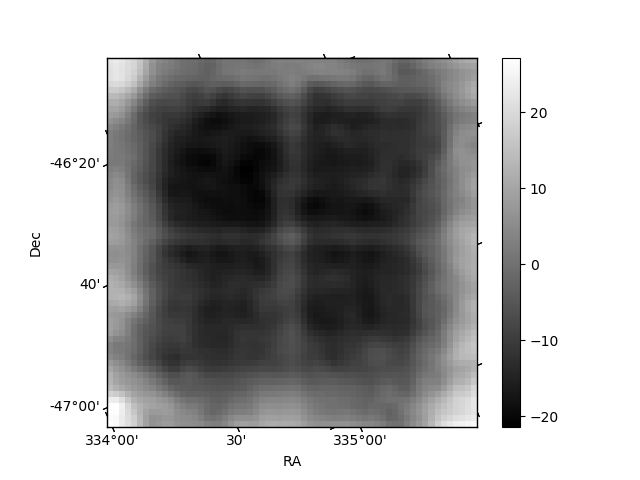
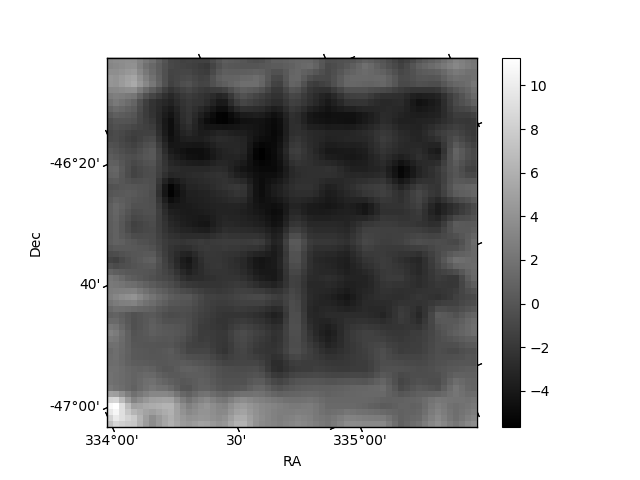
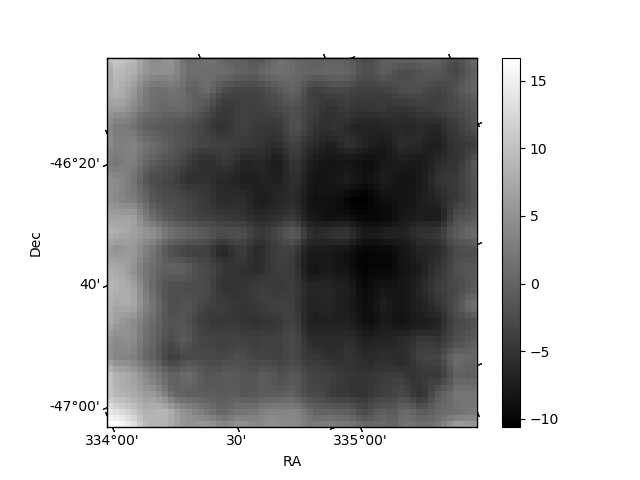
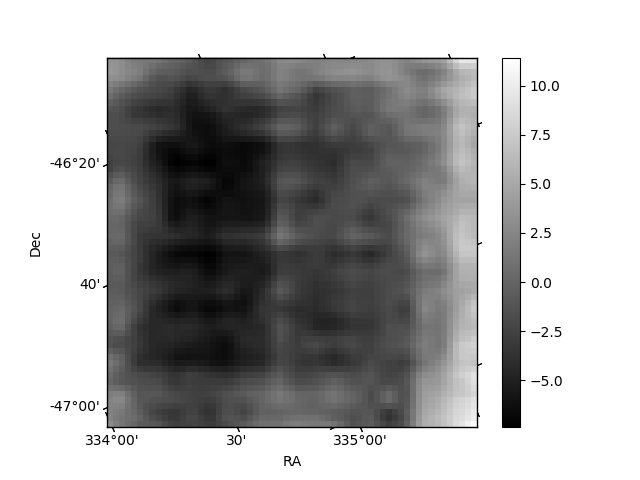
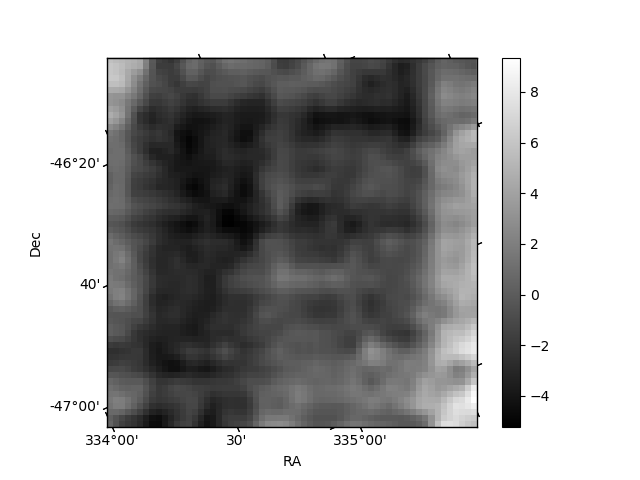
Histogram calculated using DETX and DETY for each event in the final _common_clean file
| Quadrant A | 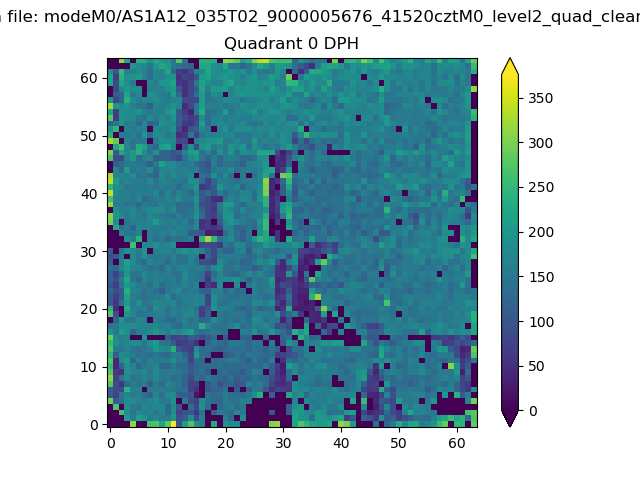 |
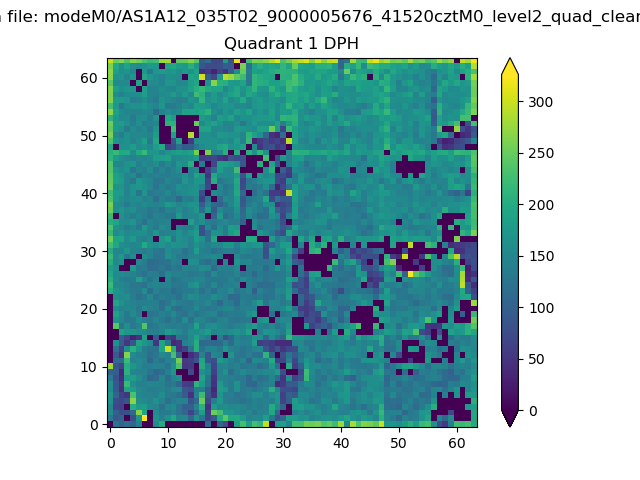 |
Quadrant B |
|---|---|---|---|
| Quadrant D | 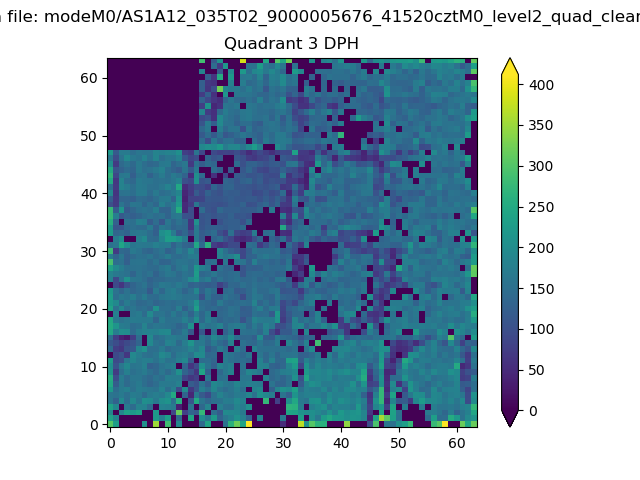 |
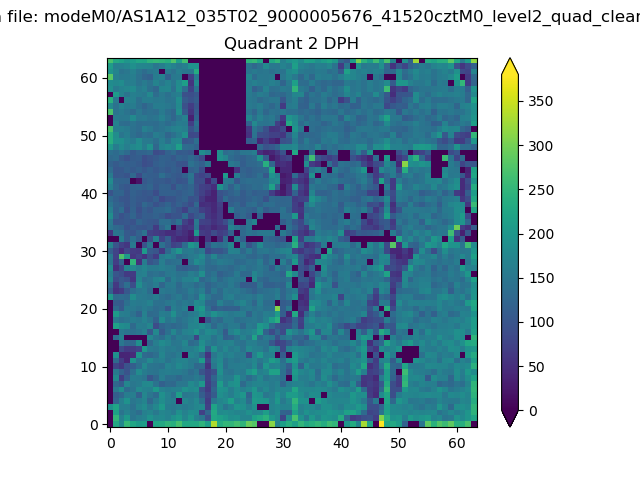 |
Quadrant C |
| Plot type | Count rate plots | Images |
|---|---|---|
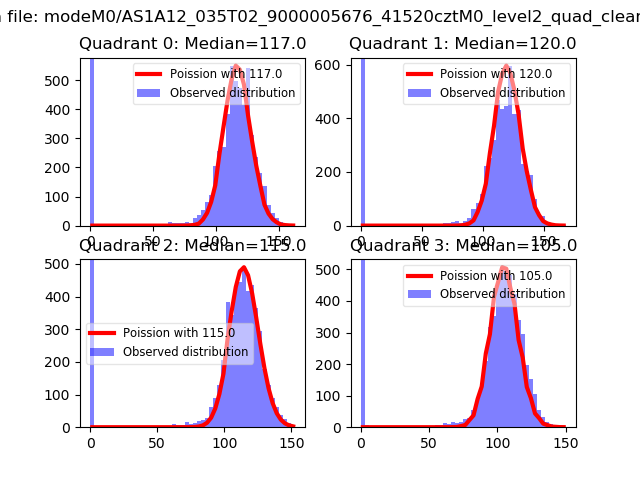
| Comparison with Poisson distribution Blue bars denote a histogram of data divided into 1 sec bins. Red curve is a Poisson curve with rate = median count rate of data. |
 |
 |
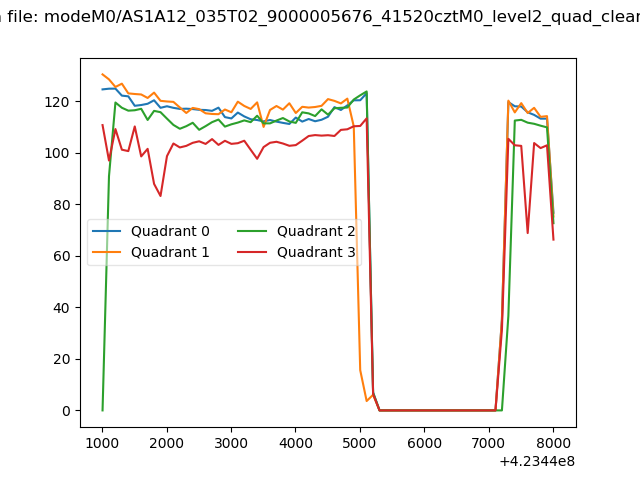
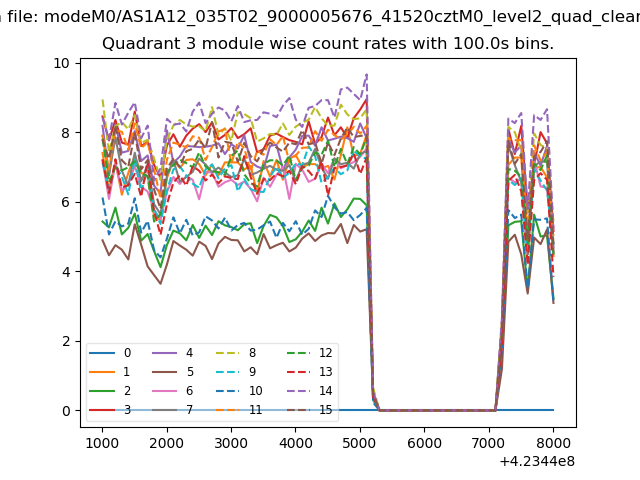
| Quadrant-wise count rates Data is divided into 100 sec bins |
 |
|
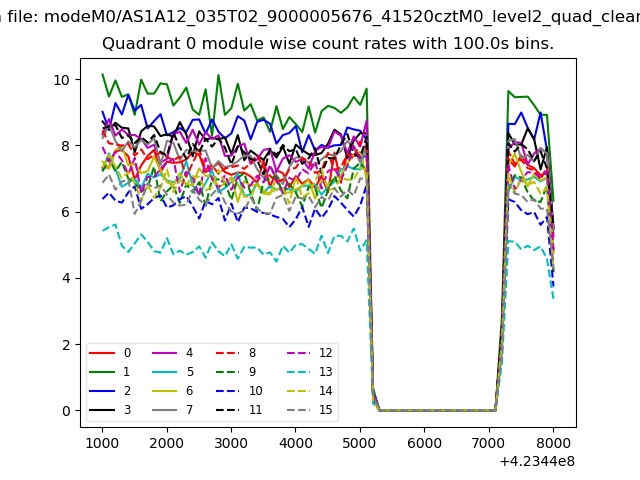
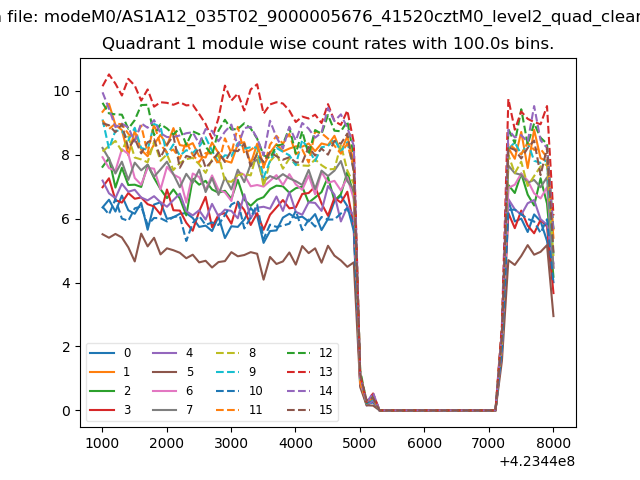
| Module-wise count rates for Quadrant A Data is divided into 100 sec bins |
 |
 |
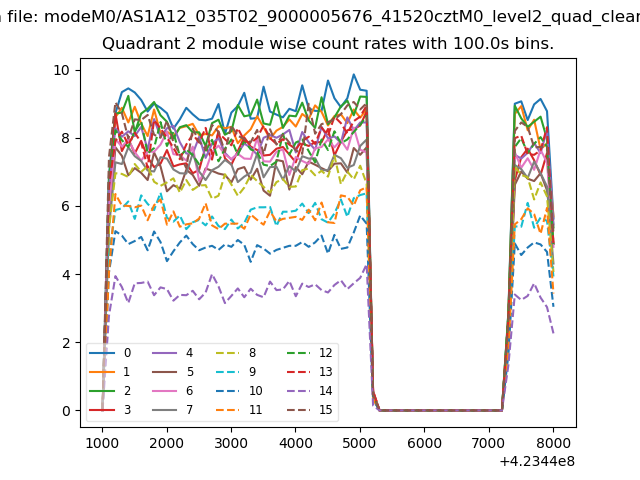
| Module-wise count rates for Quadrant B Data is divided into 100 sec bins |
 |
 |
| Module-wise count rates for Quadrant C Data is divided into 100 sec bins |
 |
 |
| Module-wise count rates for Quadrant D Data is divided into 100 sec bins |
 |
 |
| Parameter | Plot |
|---|---|
| CZT HV Monitor | 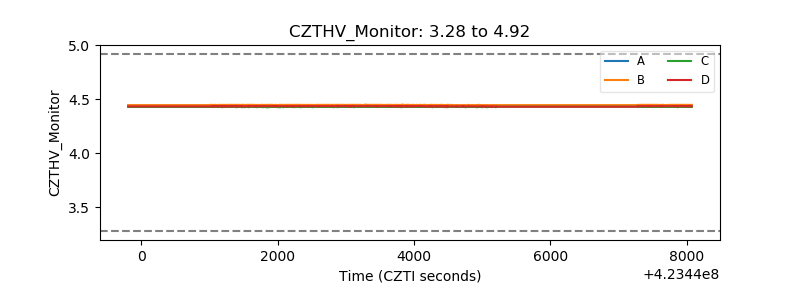 |
| D_VDD | 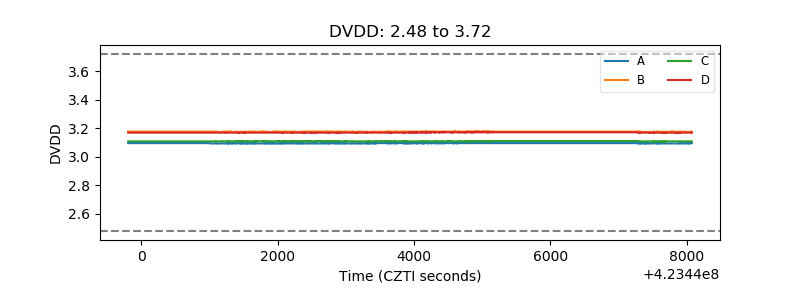 |
| Temperature 1 |  |
| Veto HV Monitor | 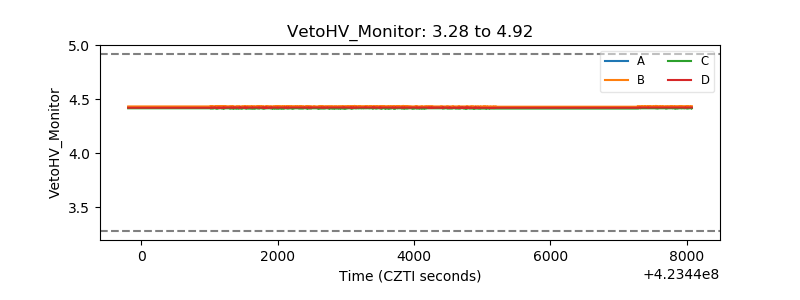 |
| Veto LLD | 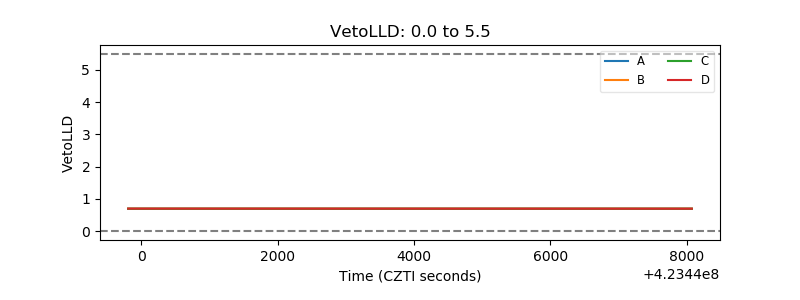 |
| Alpha Counter | 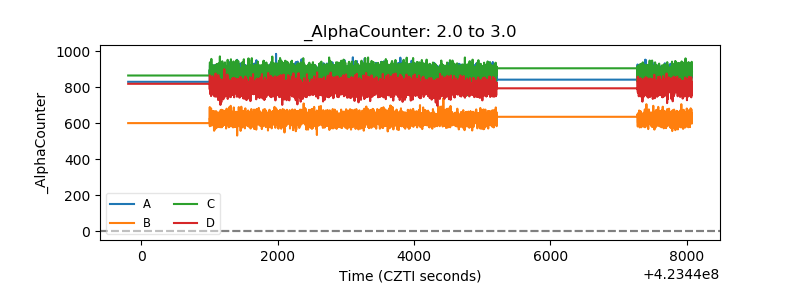 |
| _CPM_Rate | 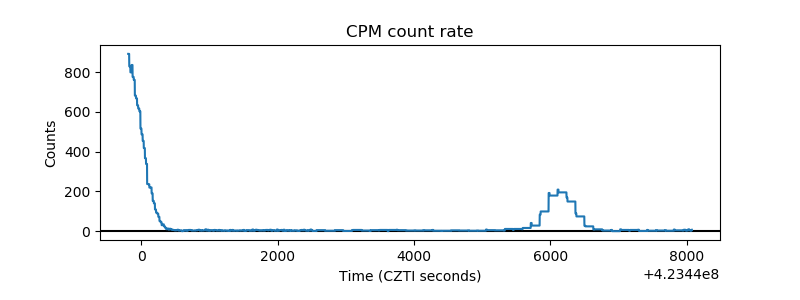 |
| CZT Counter | 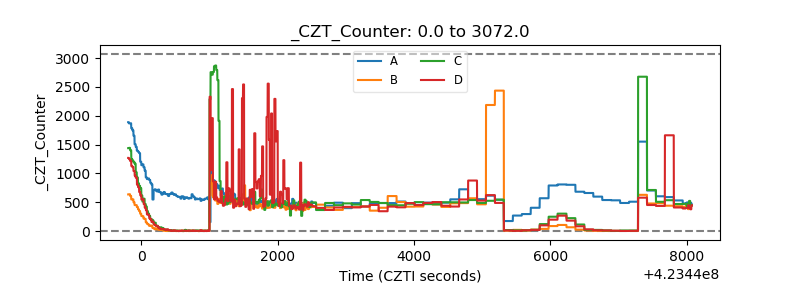 |
| +2.5 Volts monitor | 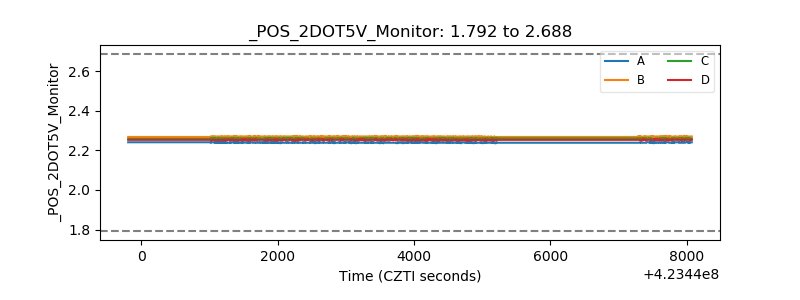 |
| +5 Volts monitor | 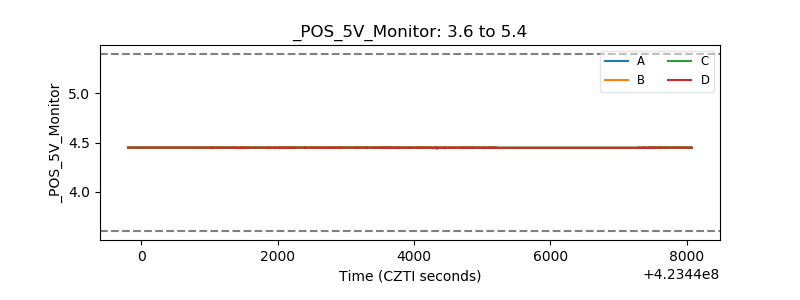 |
| _ROLL_ROT | 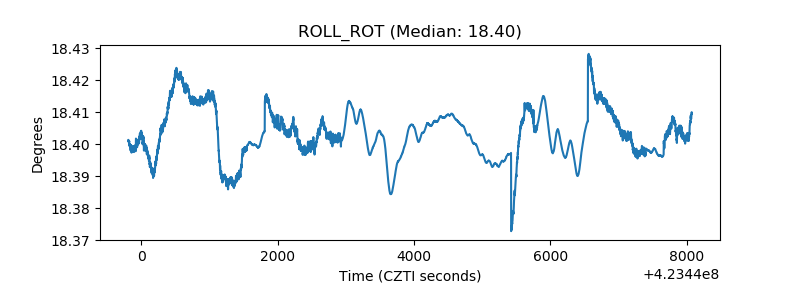 |
| _Roll_DEC | 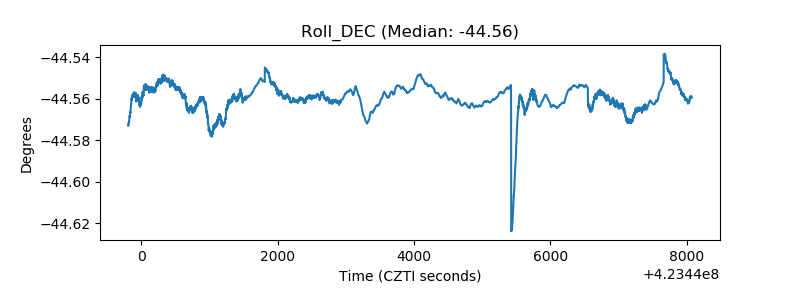 |
| _Roll_RA | 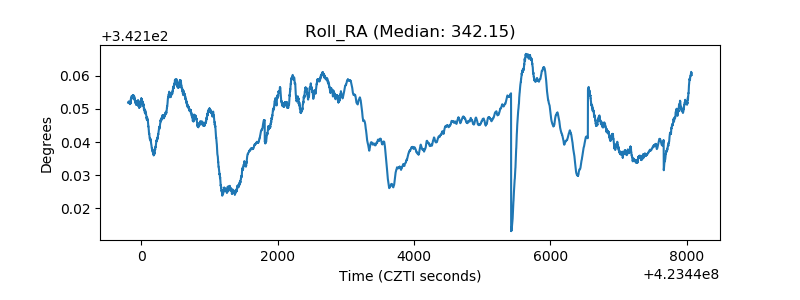 |
| Veto Counter | 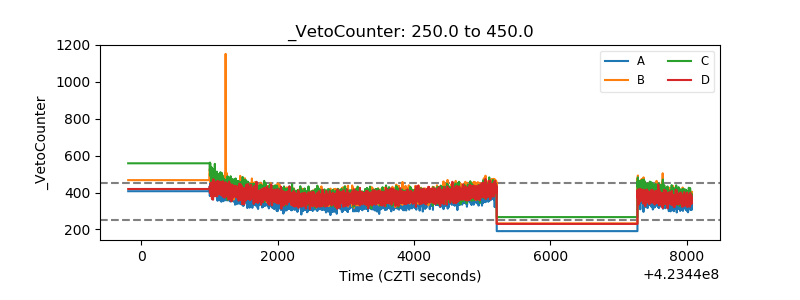 |