| Param | Original file | Final file |
|---|---|---|
| Filename | modeM0/AS1A12_035T02_9000005676_41521cztM0_level2.fits | modeM0/AS1A12_035T02_9000005676_41521cztM0_level2_quad_clean.evt |
| Size (bytes) | 321,229,440 | 84,954,240 |
| Size | 306.3 MB | 81.0 MB |
| Events in quadrant A | 2,722,243 | 583,863 |
| Events in quadrant B | 3,101,648 | 550,939 |
| Events in quadrant C | 2,976,546 | 549,208 |
| Events in quadrant D | 2,684,416 | 524,021 |
| Mode SS | |||
|---|---|---|---|
| Quadrant | BADHDUFLAG | Total packets | Discarded packets |
| A | 0 | 106 | 0 |
| B | 0 | 106 | 0 |
| C | 0 | 106 | 0 |
| D | 0 | 106 | 0 |
| Mode M0 | |||
|---|---|---|---|
| Quadrant | BADHDUFLAG | Total packets | Discarded packets |
| A | 0 | 11233 | 3 |
| B | 0 | 12923 | 2 |
| C | 0 | 12094 | 2 |
| D | 0 | 11813 | 2 |
| Mode M9 | |||
|---|---|---|---|
| Quadrant | BADHDUFLAG | Total packets | Discarded packets |
| A | 0 | 27 | 0 |
| B | 0 | 27 | 0 |
| C | 0 | 27 | 0 |
| D | 0 | 28 | 0 |
| Quadrant | Total seconds | Saturated seconds | Saturation percentage |
|---|---|---|---|
| A | 5203 | 12 | 0.230636% |
| B | 5203 | 395 | 7.591774% |
| C | 5203 | 227 | 4.362868% |
| D | 5203 | 84 | 1.614453% |
Noise dominated data is calculated using 1-second bins in cleaned event files. If a bin has >2000 counts, and if more than 50% of those come from <1% of pixels, then it is considered to be noise-dominated and hence unusable.
| Quadrant | # 1 sec bins | Bins with >0 counts | Bins with >2000 counts | High rate bins dominated by noise | Noise dominated (total time) | Noise dominated (detector-on time) | Marked lightcurve |
|---|---|---|---|---|---|---|---|
| A | 7056 | 5204 | 6 | 6 | 0.09% | 0.12% | 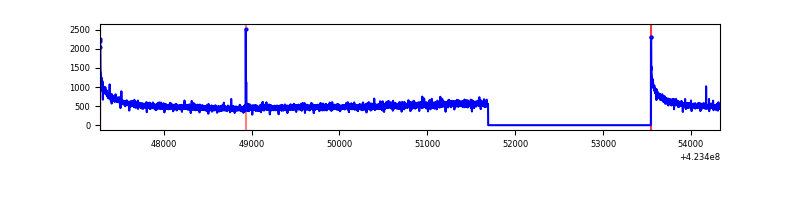 |
| B | 7056 | 5204 | 363 | 363 | 5.14% | 6.98% | 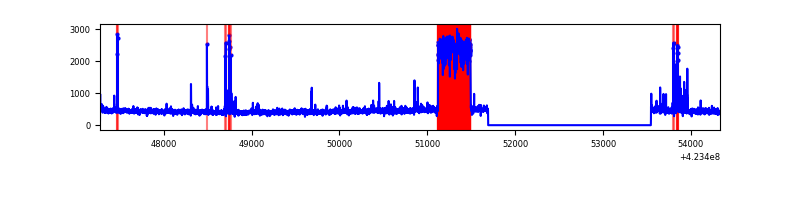 |
| C | 7056 | 5204 | 218 | 218 | 3.09% | 4.19% | 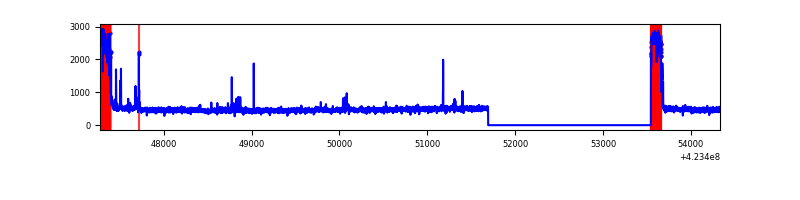 |
| D | 7056 | 5204 | 69 | 69 | 0.98% | 1.33% | 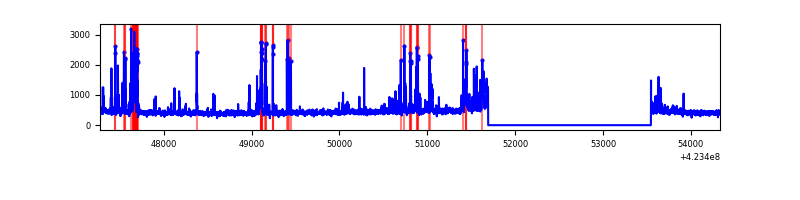 |
Top three noisy pixels from each quadrant. If the there are fewer than three noisy pixels in the level2.evt file, extra rows are filled as -1
| Pixel properties | Quadrant properties | ||||||
|---|---|---|---|---|---|---|---|
| Quadrant | DetID | PixID | Counts | Sigma | Mean | Median | Sigma |
| A | 10 | 83 | 507979 | 4286.6 | 569 | 556 | 118.4 |
| A | 13 | 254 | 8307 | 65.48 | 569 | 556 | 118.4 |
| A | 13 | 248 | 7807 | 61.25 | 569 | 556 | 118.4 |
| B | 0 | 186 | 809672 | 7774.53 | 538 | 522 | 104.1 |
| B | 5 | 255 | 117067 | 1119.8 | 538 | 522 | 104.1 |
| B | 0 | 190 | 25729 | 242.2 | 538 | 522 | 104.1 |
| C | 0 | 10 | 554953 | 4308.33 | 547 | 550 | 128.7 |
| C | 15 | 214 | 211621 | 1640.26 | 547 | 550 | 128.7 |
| C | 14 | 254 | 48616 | 373.53 | 547 | 550 | 128.7 |
| D | 1 | 47 | 233241 | 1691.3 | 559 | 544 | 137.6 |
| D | 12 | 6 | 106484 | 770.0 | 559 | 544 | 137.6 |
| D | 13 | 249 | 104677 | 756.86 | 559 | 544 | 137.6 |
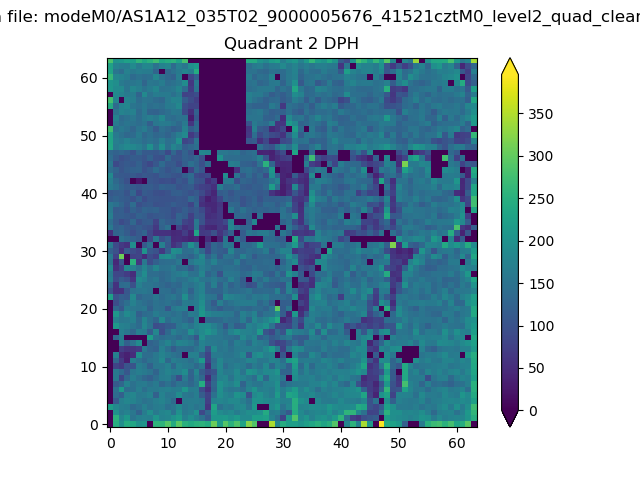
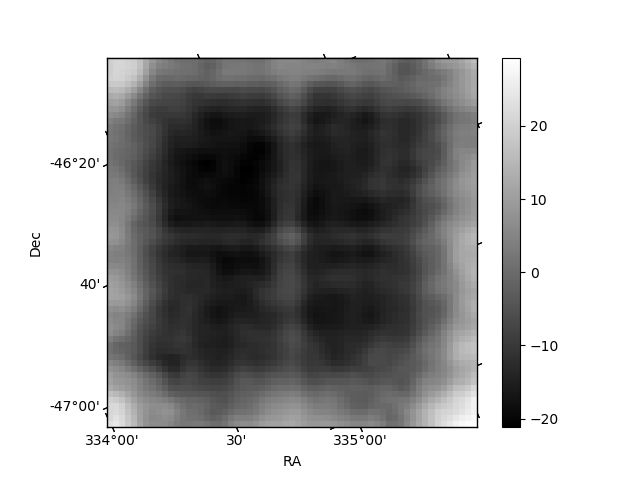
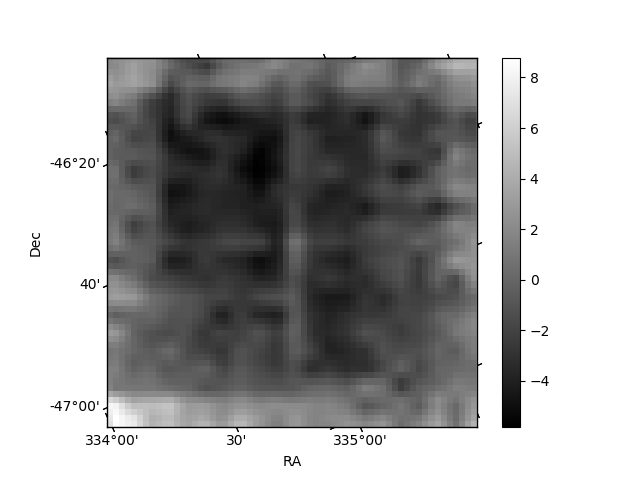
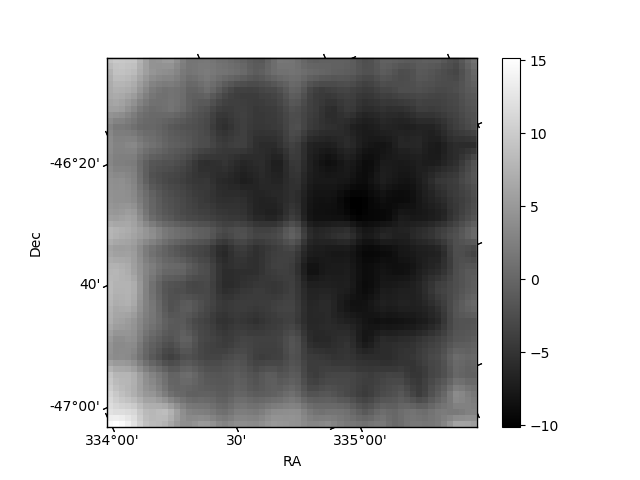
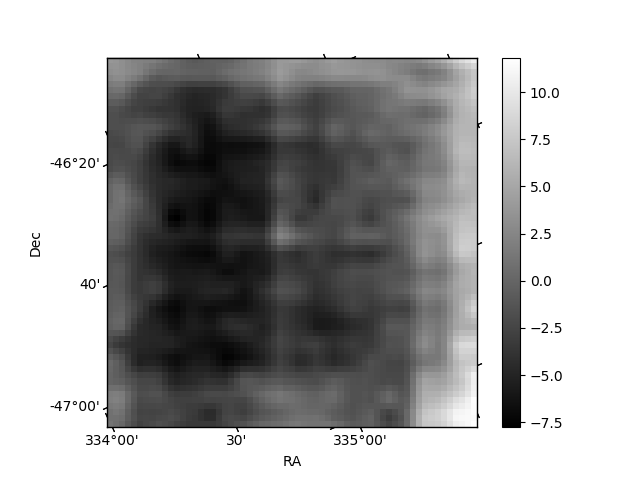
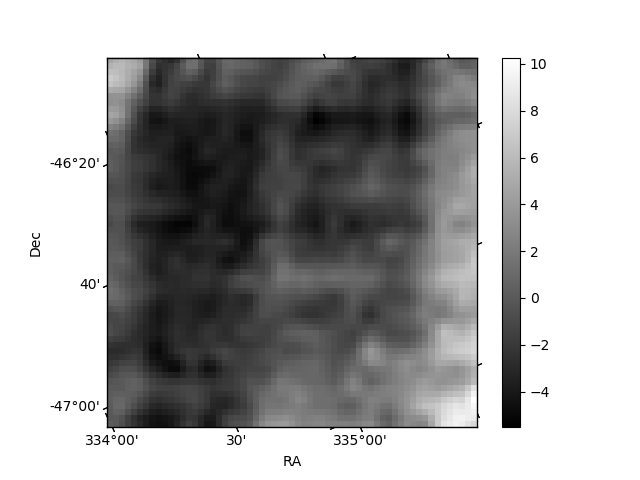
Histogram calculated using DETX and DETY for each event in the final _common_clean file
| Quadrant A | 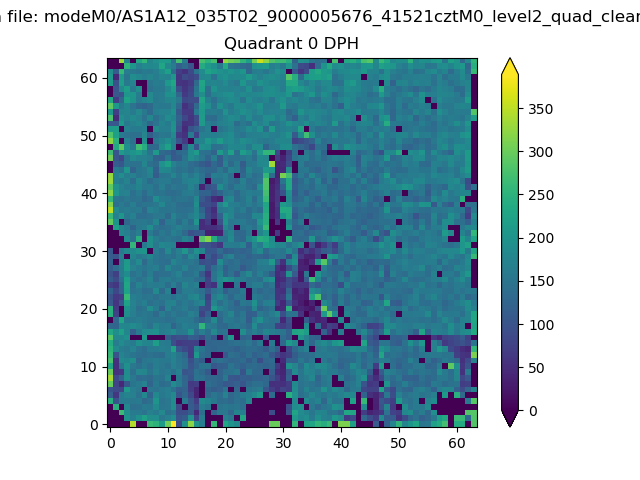 |
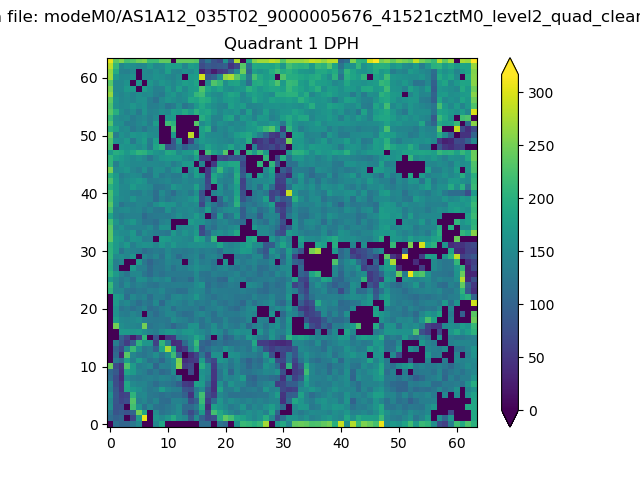 |
Quadrant B |
|---|---|---|---|
| Quadrant D | 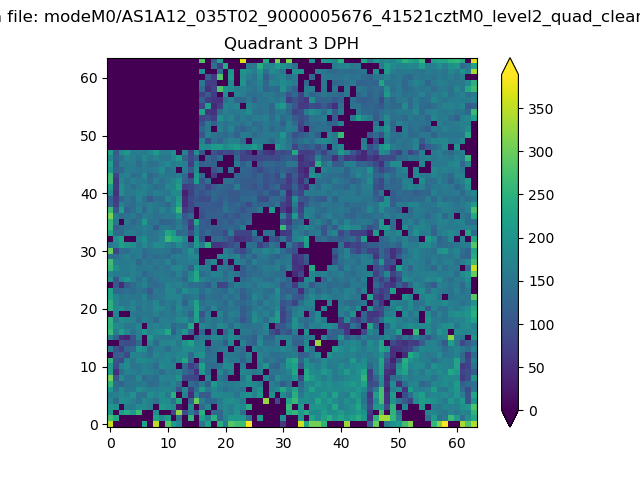 |
 |
Quadrant C |
| Plot type | Count rate plots | Images |
|---|---|---|
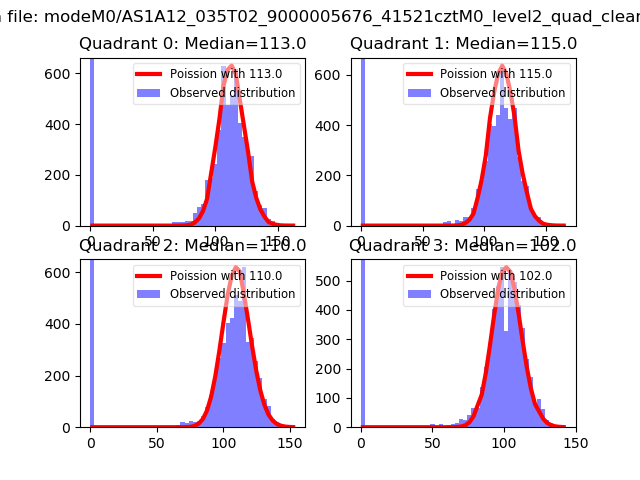
| Comparison with Poisson distribution Blue bars denote a histogram of data divided into 1 sec bins. Red curve is a Poisson curve with rate = median count rate of data. |
 |
 |
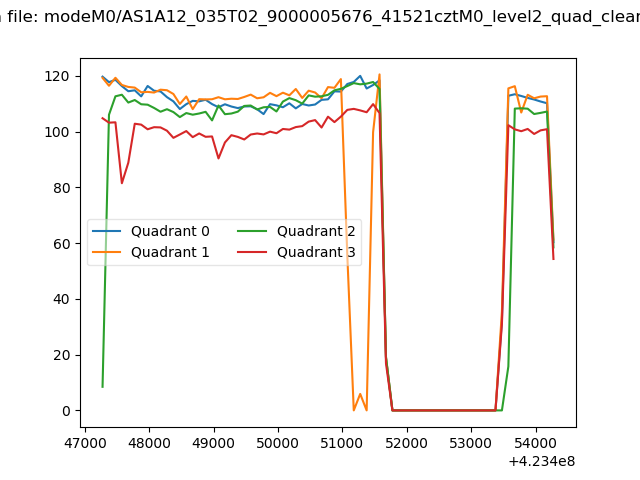
| Quadrant-wise count rates Data is divided into 100 sec bins |
 |
|
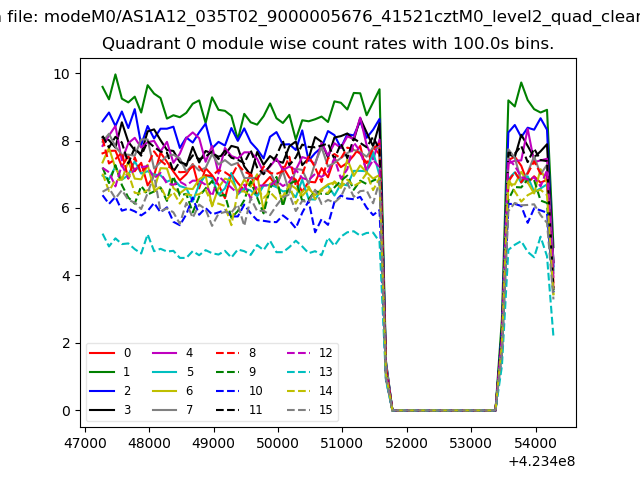
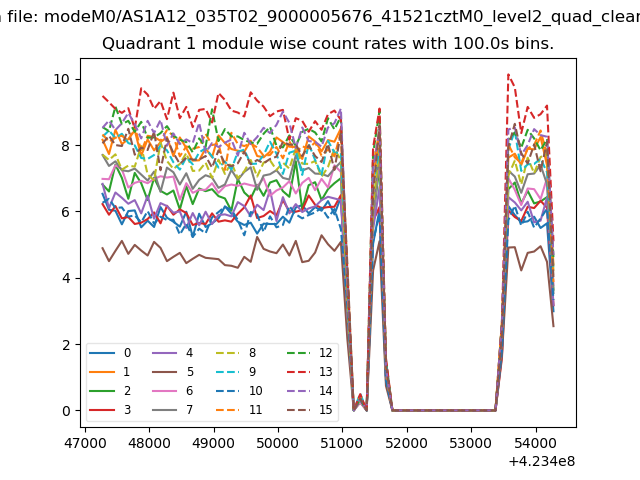
| Module-wise count rates for Quadrant A Data is divided into 100 sec bins |
 |
 |
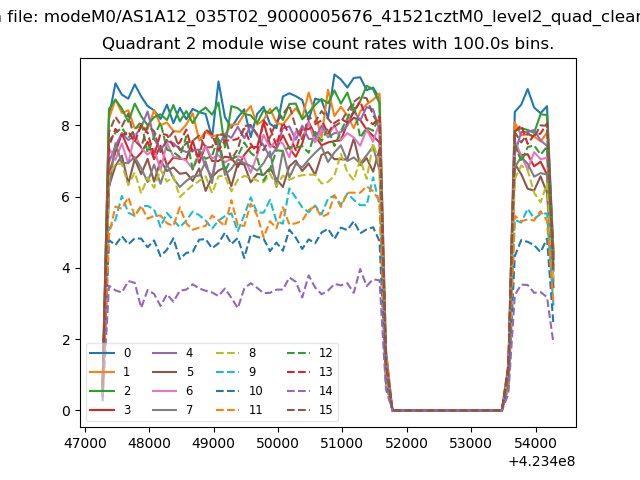
| Module-wise count rates for Quadrant B Data is divided into 100 sec bins |
 |
 |
| Module-wise count rates for Quadrant C Data is divided into 100 sec bins |
 |
 |
| Module-wise count rates for Quadrant D Data is divided into 100 sec bins |
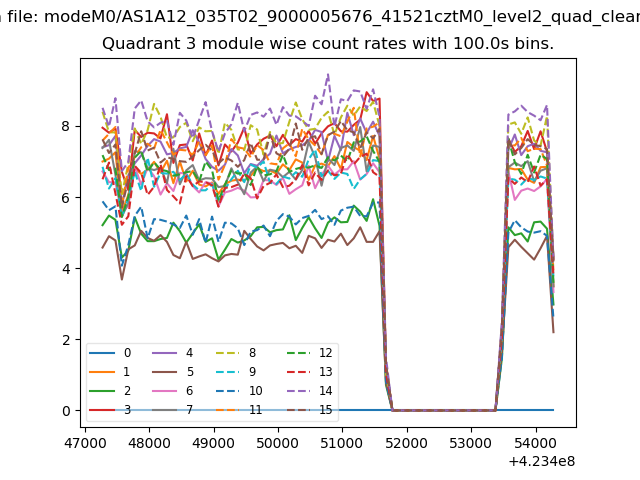 |
 |
| Parameter | Plot |
|---|---|
| CZT HV Monitor | 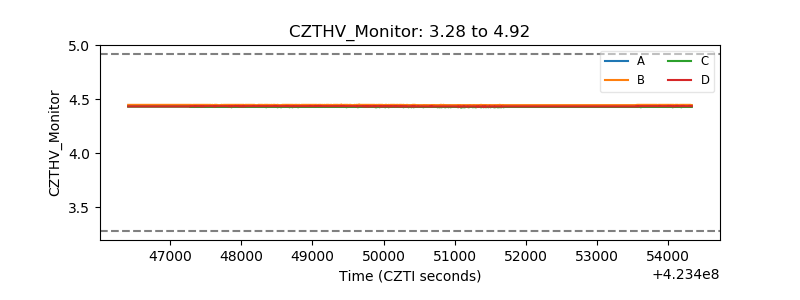 |
| D_VDD | 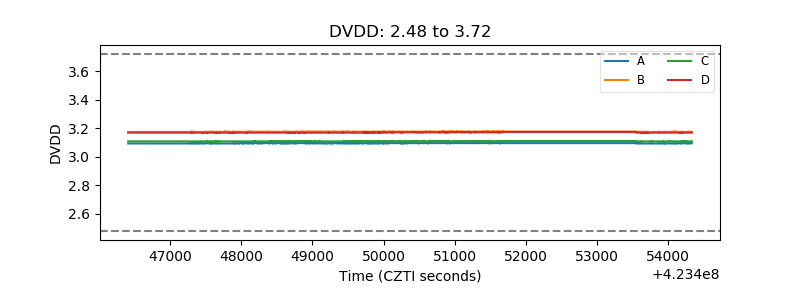 |
| Temperature 1 |  |
| Veto HV Monitor | 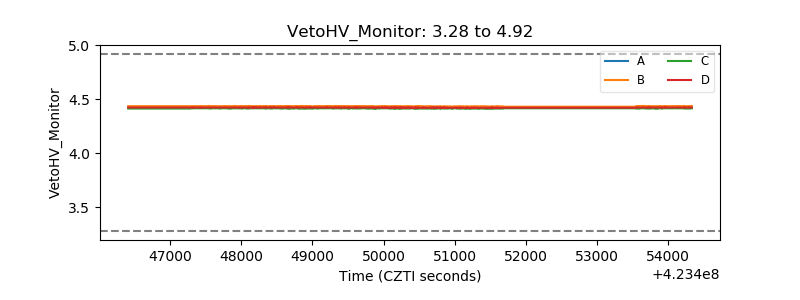 |
| Veto LLD | 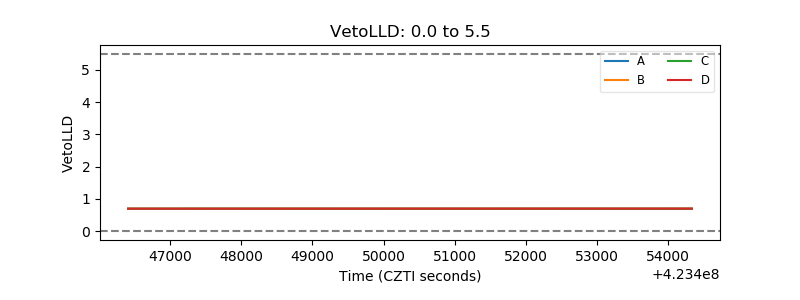 |
| Alpha Counter | 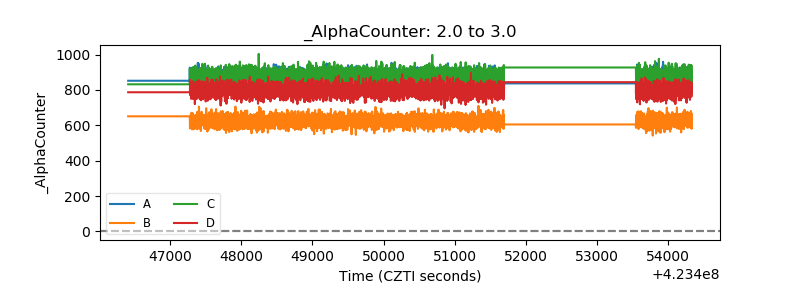 |
| _CPM_Rate | 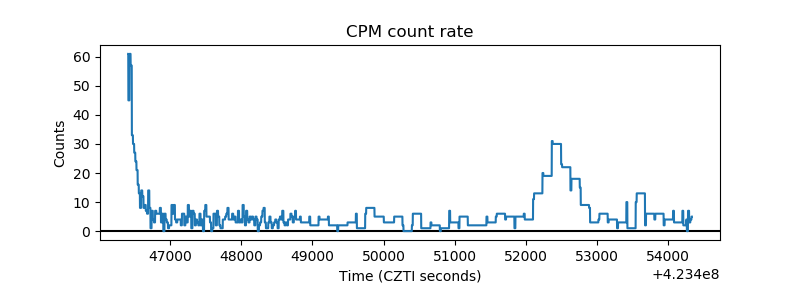 |
| CZT Counter | 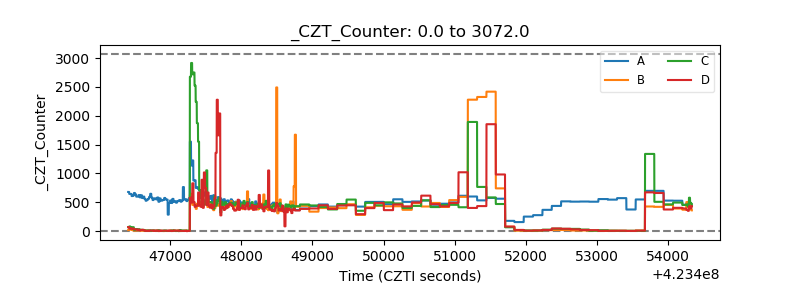 |
| +2.5 Volts monitor | 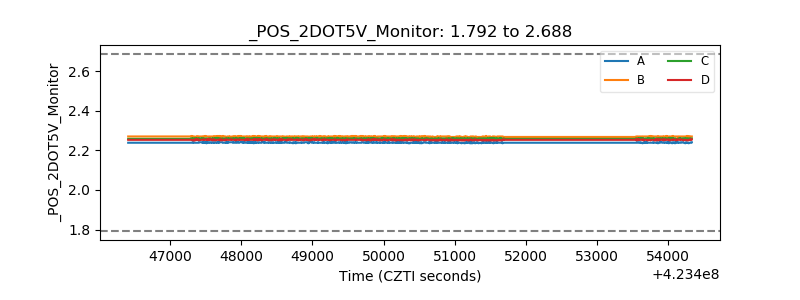 |
| +5 Volts monitor | 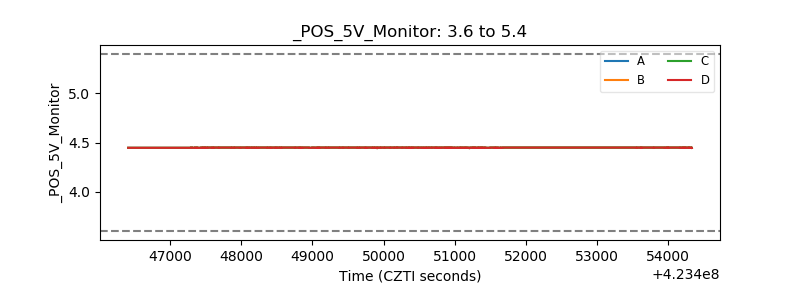 |
| _ROLL_ROT | 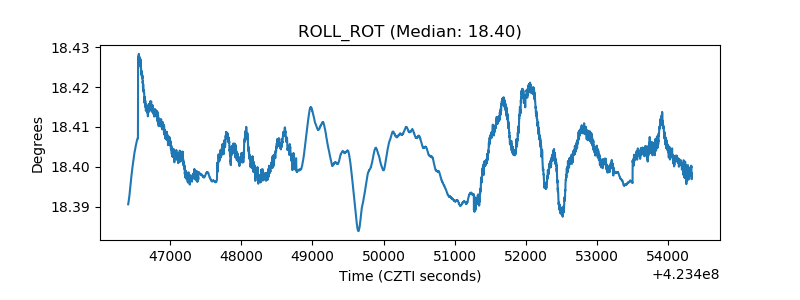 |
| _Roll_DEC | 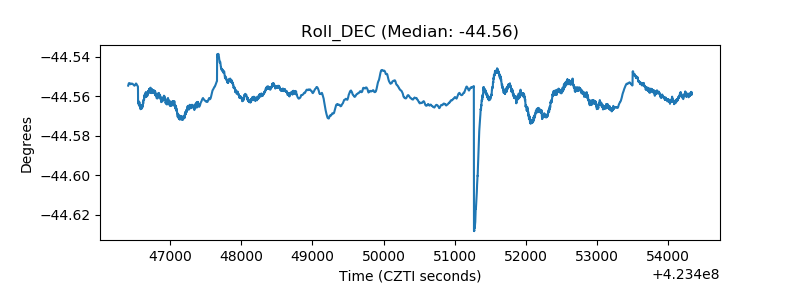 |
| _Roll_RA | 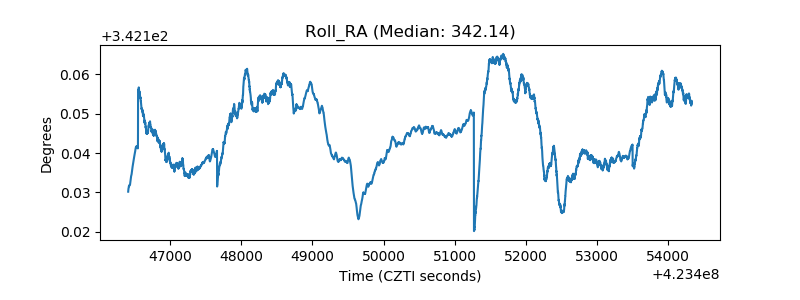 |
| Veto Counter | 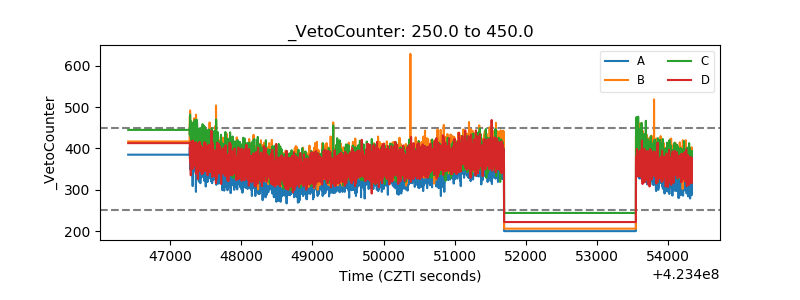 |