| Param | Original file | Final file |
|---|---|---|
| Filename | modeM0/AS1A12_035T02_9000005676_41522cztM0_level2.fits | modeM0/AS1A12_035T02_9000005676_41522cztM0_level2_quad_clean.evt |
| Size (bytes) | 322,747,200 | 93,110,400 |
| Size | 307.8 MB | 88.8 MB |
| Events in quadrant A | 2,972,384 | 625,095 |
| Events in quadrant B | 2,734,963 | 635,624 |
| Events in quadrant C | 3,120,753 | 592,838 |
| Events in quadrant D | 2,677,260 | 570,022 |
| Mode SS | |||
|---|---|---|---|
| Quadrant | BADHDUFLAG | Total packets | Discarded packets |
| A | 0 | 116 | 0 |
| B | 0 | 116 | 0 |
| C | 0 | 116 | 0 |
| D | 0 | 116 | 0 |
| Mode M0 | |||
|---|---|---|---|
| Quadrant | BADHDUFLAG | Total packets | Discarded packets |
| A | 0 | 12205 | 3 |
| B | 0 | 12034 | 2 |
| C | 0 | 12806 | 2 |
| D | 0 | 12108 | 2 |
| Mode M9 | |||
|---|---|---|---|
| Quadrant | BADHDUFLAG | Total packets | Discarded packets |
| A | 0 | 35 | 0 |
| B | 0 | 35 | 0 |
| C | 0 | 35 | 0 |
| D | 0 | 35 | 0 |
| Quadrant | Total seconds | Saturated seconds | Saturation percentage |
|---|---|---|---|
| A | 5664 | 12 | 0.211864% |
| B | 5664 | 52 | 0.918079% |
| C | 5664 | 193 | 3.407486% |
| D | 5664 | 21 | 0.370763% |
Noise dominated data is calculated using 1-second bins in cleaned event files. If a bin has >2000 counts, and if more than 50% of those come from <1% of pixels, then it is considered to be noise-dominated and hence unusable.
| Quadrant | # 1 sec bins | Bins with >0 counts | Bins with >2000 counts | High rate bins dominated by noise | Noise dominated (total time) | Noise dominated (detector-on time) | Marked lightcurve |
|---|---|---|---|---|---|---|---|
| A | 9040 | 5666 | 3 | 3 | 0.03% | 0.05% | 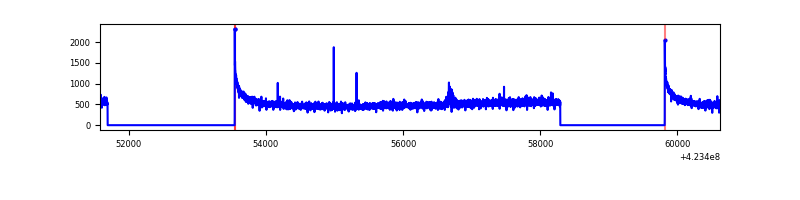 |
| B | 9040 | 5666 | 42 | 42 | 0.46% | 0.74% | 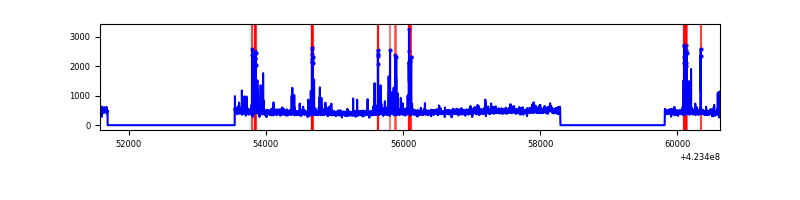 |
| C | 9040 | 5666 | 183 | 183 | 2.02% | 3.23% | 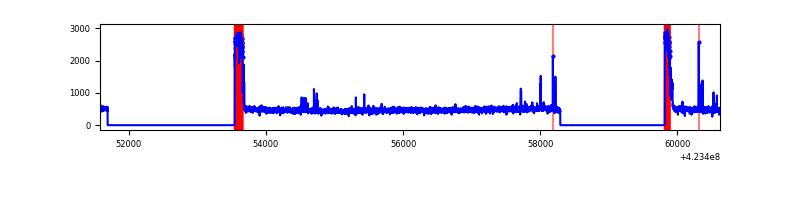 |
| D | 9040 | 5666 | 16 | 16 | 0.18% | 0.28% | 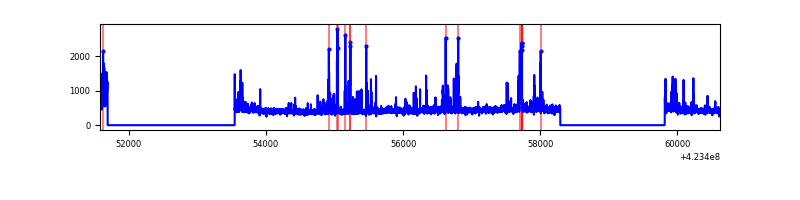 |
Top three noisy pixels from each quadrant. If the there are fewer than three noisy pixels in the level2.evt file, extra rows are filled as -1
| Pixel properties | Quadrant properties | ||||||
|---|---|---|---|---|---|---|---|
| Quadrant | DetID | PixID | Counts | Sigma | Mean | Median | Sigma |
| A | 10 | 83 | 538204 | 4216.16 | 623 | 611 | 127.5 |
| A | 13 | 248 | 18478 | 140.12 | 623 | 611 | 127.5 |
| A | 13 | 254 | 10044 | 73.98 | 623 | 611 | 127.5 |
| B | 5 | 255 | 197845 | 1661.26 | 614 | 596 | 118.7 |
| B | 0 | 190 | 60318 | 502.99 | 614 | 596 | 118.7 |
| B | 0 | 245 | 22246 | 182.34 | 614 | 596 | 118.7 |
| C | 0 | 10 | 497490 | 3530.58 | 599 | 601 | 140.7 |
| C | 15 | 214 | 230665 | 1634.69 | 599 | 601 | 140.7 |
| C | 14 | 254 | 26483 | 183.9 | 599 | 601 | 140.7 |
| D | 1 | 47 | 153573 | 1032.71 | 611 | 594 | 148.1 |
| D | 12 | 128 | 70527 | 472.1 | 611 | 594 | 148.1 |
| D | 12 | 6 | 59157 | 395.34 | 611 | 594 | 148.1 |
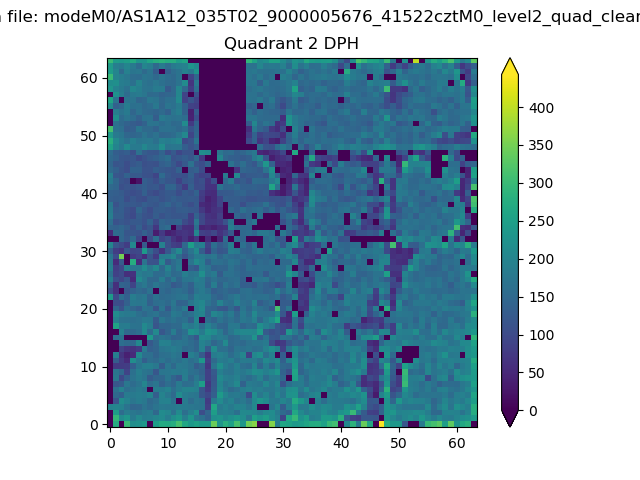
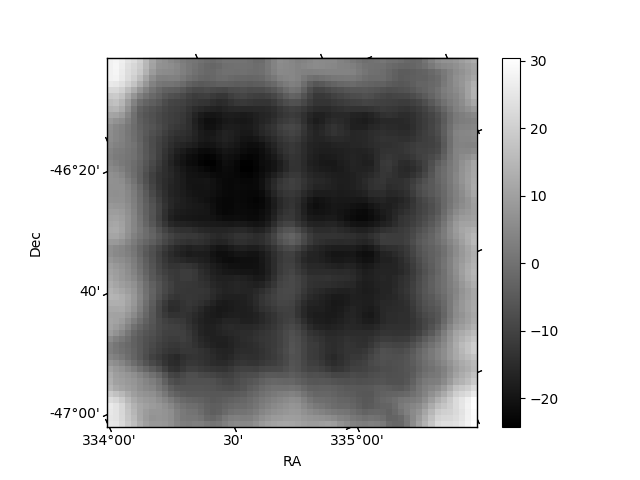
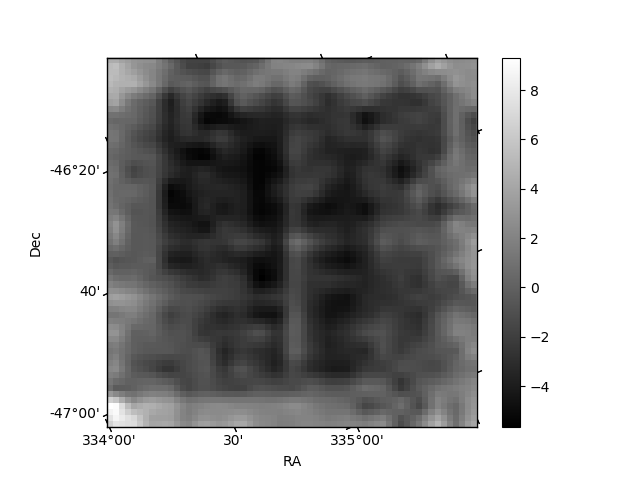
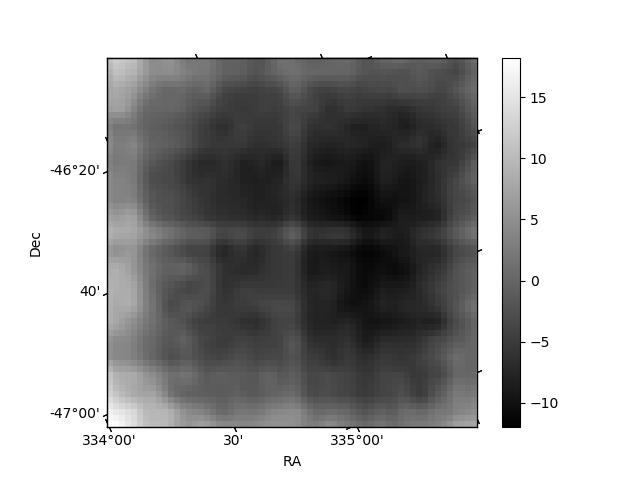
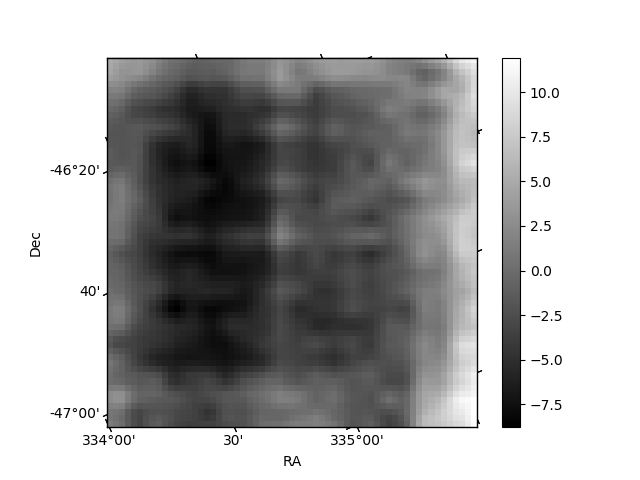
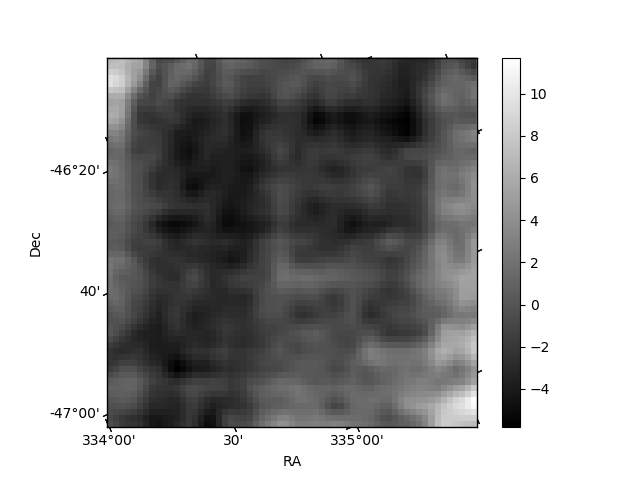
Histogram calculated using DETX and DETY for each event in the final _common_clean file
| Quadrant A | 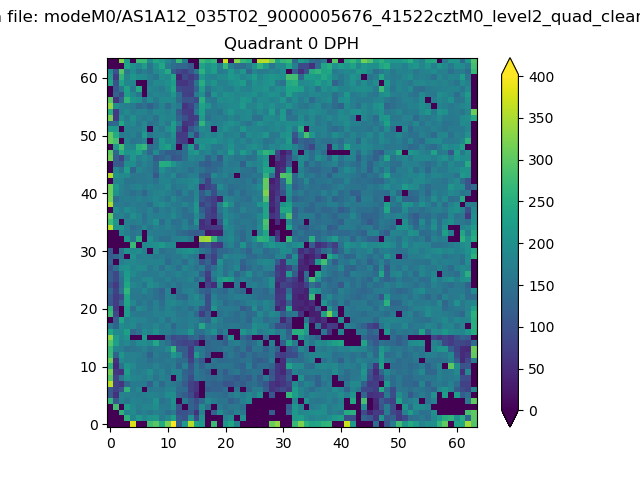 |
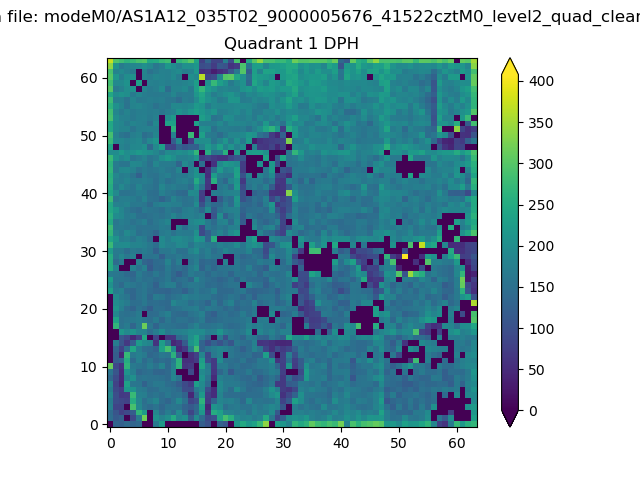 |
Quadrant B |
|---|---|---|---|
| Quadrant D | 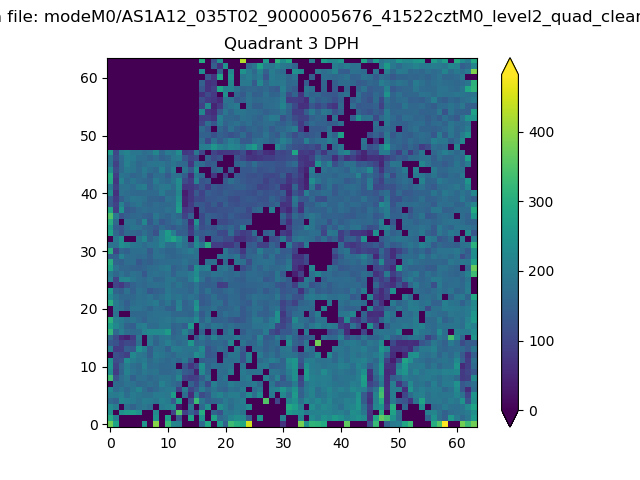 |
 |
Quadrant C |
| Plot type | Count rate plots | Images |
|---|---|---|
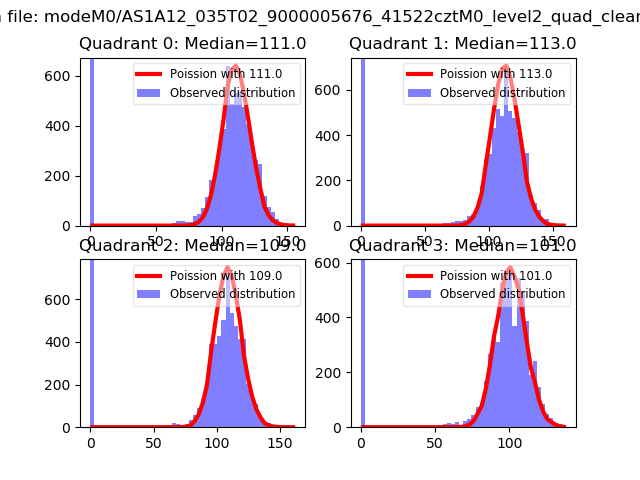
| Comparison with Poisson distribution Blue bars denote a histogram of data divided into 1 sec bins. Red curve is a Poisson curve with rate = median count rate of data. |
 |
 |
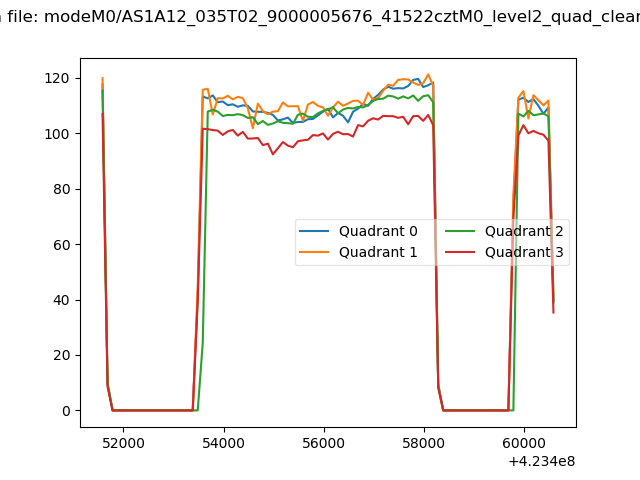
| Quadrant-wise count rates Data is divided into 100 sec bins |
 |
|
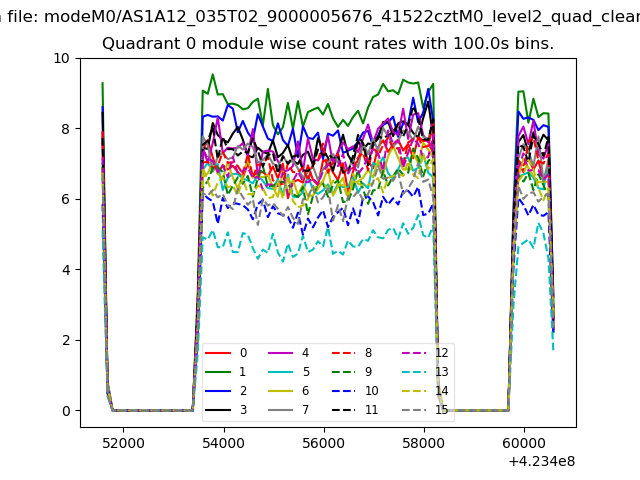
| Module-wise count rates for Quadrant A Data is divided into 100 sec bins |
 |
 |
| Module-wise count rates for Quadrant B Data is divided into 100 sec bins |
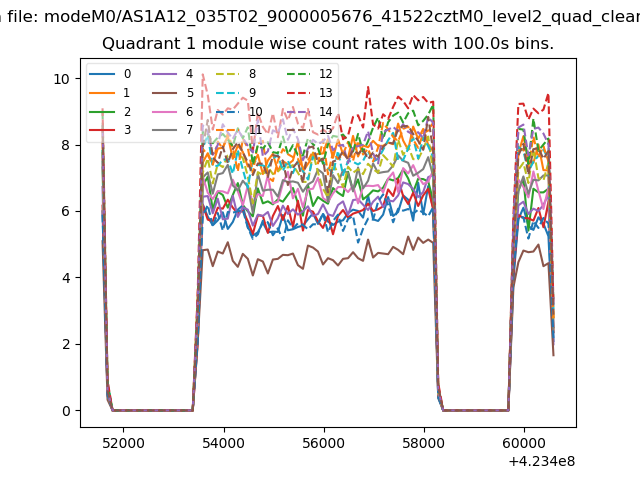 |
 |
| Module-wise count rates for Quadrant C Data is divided into 100 sec bins |
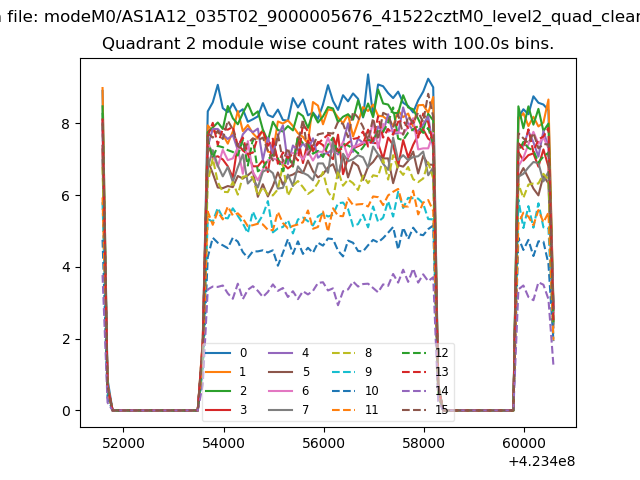 |
 |
| Module-wise count rates for Quadrant D Data is divided into 100 sec bins |
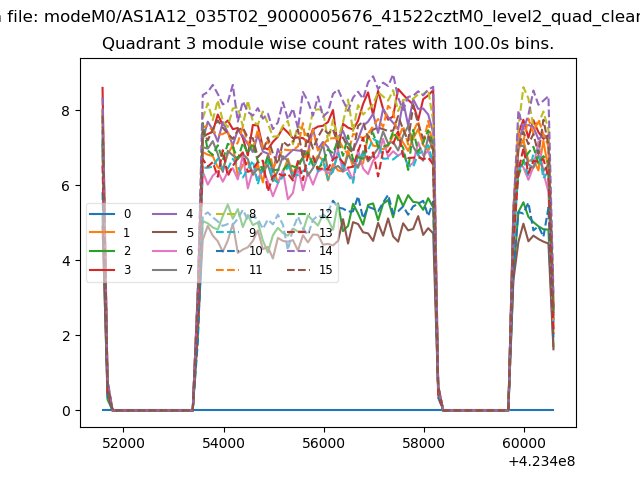 |
 |
| Parameter | Plot |
|---|---|
| CZT HV Monitor | 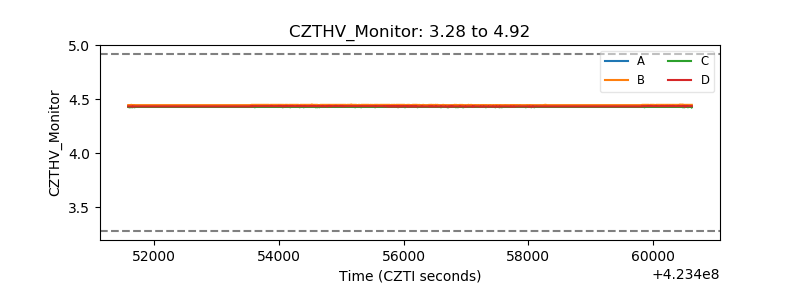 |
| D_VDD | 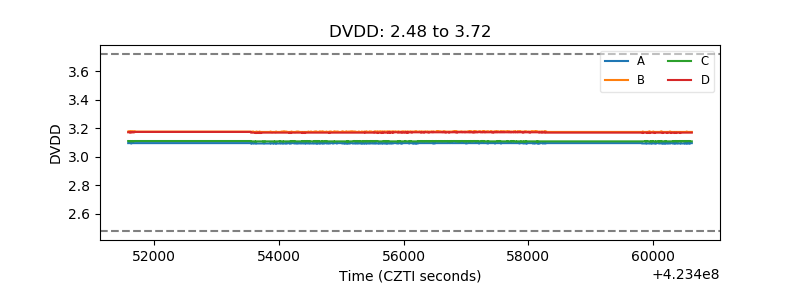 |
| Temperature 1 | 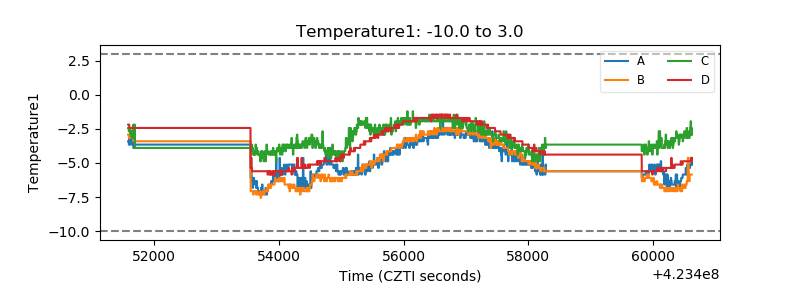 |
| Veto HV Monitor | 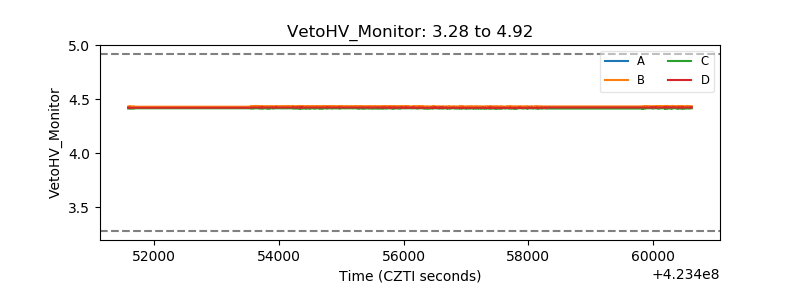 |
| Veto LLD | 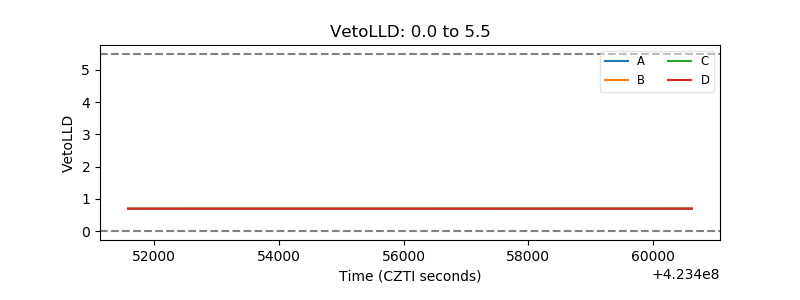 |
| Alpha Counter | 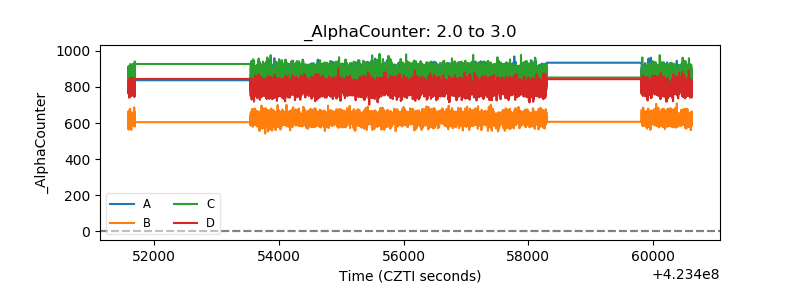 |
| _CPM_Rate | 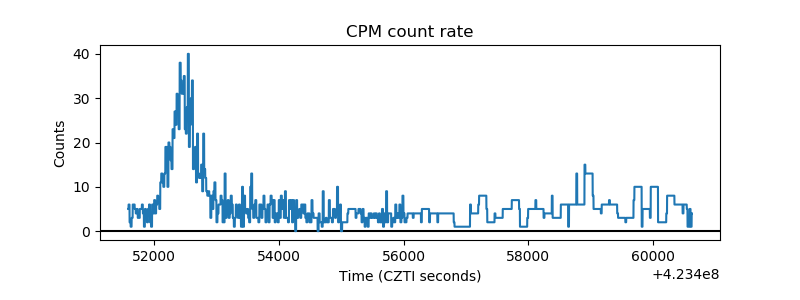 |
| CZT Counter | 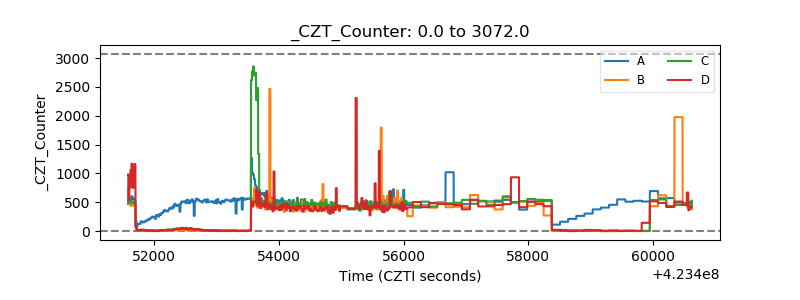 |
| +2.5 Volts monitor | 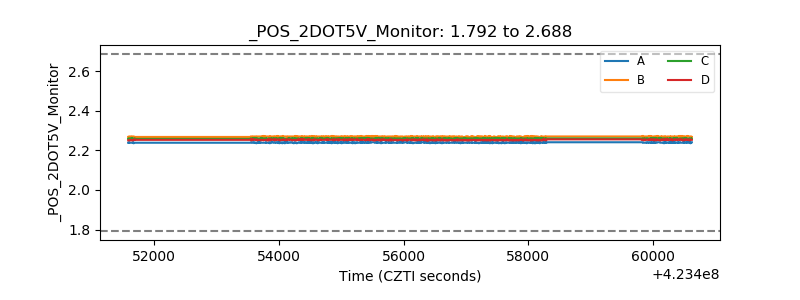 |
| +5 Volts monitor | 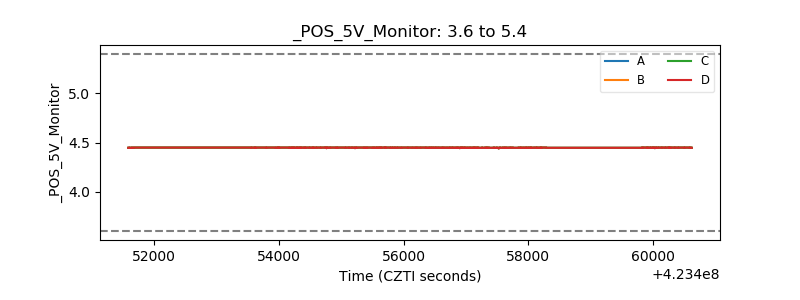 |
| _ROLL_ROT | 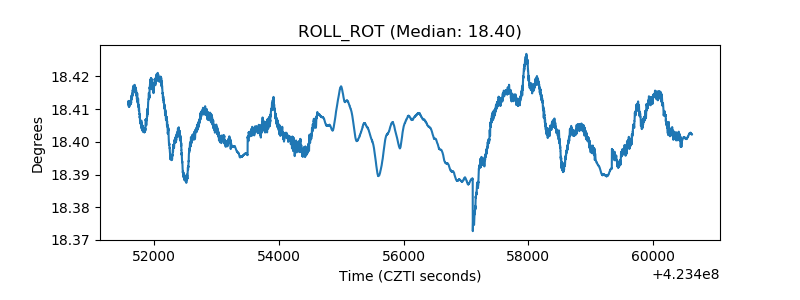 |
| _Roll_DEC | 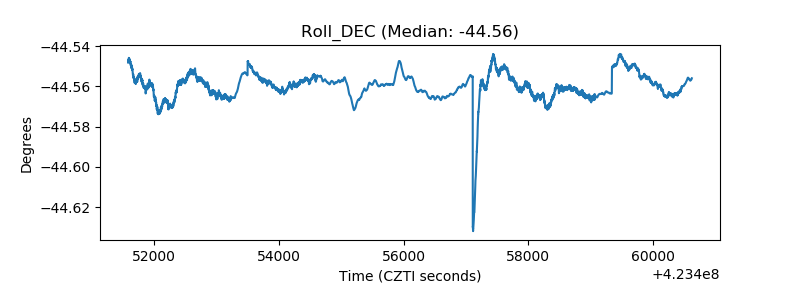 |
| _Roll_RA | 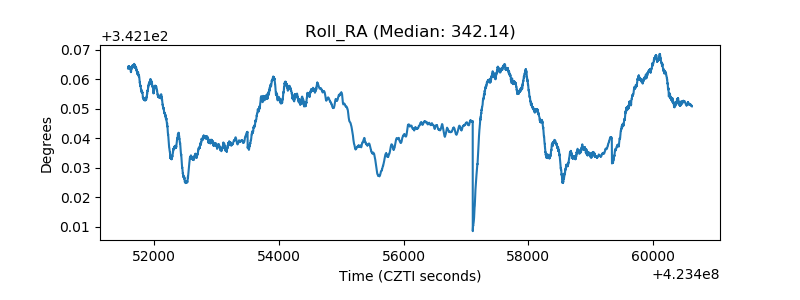 |
| Veto Counter | 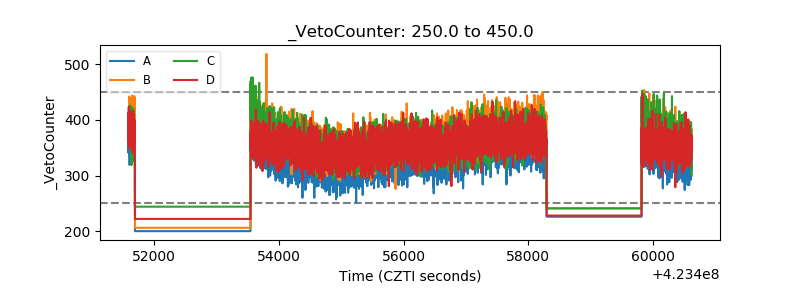 |