| Param | Original file | Final file |
|---|---|---|
| Filename | modeM0/AS1A12_035T02_9000005676_41526cztM0_level2.fits | modeM0/AS1A12_035T02_9000005676_41526cztM0_level2_quad_clean.evt |
| Size (bytes) | 839,784,960 | 228,502,080 |
| Size | 800.9 MB | 217.9 MB |
| Events in quadrant A | 7,547,734 | 1,532,155 |
| Events in quadrant B | 7,304,132 | 1,547,231 |
| Events in quadrant C | 7,316,429 | 1,477,241 |
| Events in quadrant D | 7,808,974 | 1,374,501 |
| Mode SS | |||
|---|---|---|---|
| Quadrant | BADHDUFLAG | Total packets | Discarded packets |
| A | 0 | 292 | 0 |
| B | 0 | 292 | 0 |
| C | 0 | 292 | 0 |
| D | 0 | 292 | 0 |
| Mode M0 | |||
|---|---|---|---|
| Quadrant | BADHDUFLAG | Total packets | Discarded packets |
| A | 0 | 30592 | 4 |
| B | 0 | 31576 | 3 |
| C | 0 | 30733 | 3 |
| D | 0 | 33561 | 3 |
| Mode M9 | |||
|---|---|---|---|
| Quadrant | BADHDUFLAG | Total packets | Discarded packets |
| A | 0 | 42 | 0 |
| B | 0 | 42 | 0 |
| C | 0 | 42 | 0 |
| D | 0 | 42 | 0 |
| Quadrant | Total seconds | Saturated seconds | Saturation percentage |
|---|---|---|---|
| A | 14300 | 26 | 0.181818% |
| B | 14300 | 200 | 1.398601% |
| C | 14300 | 238 | 1.664336% |
| D | 14300 | 332 | 2.321678% |
Noise dominated data is calculated using 1-second bins in cleaned event files. If a bin has >2000 counts, and if more than 50% of those come from <1% of pixels, then it is considered to be noise-dominated and hence unusable.
| Quadrant | # 1 sec bins | Bins with >0 counts | Bins with >2000 counts | High rate bins dominated by noise | Noise dominated (total time) | Noise dominated (detector-on time) | Marked lightcurve |
|---|---|---|---|---|---|---|---|
| A | 18417 | 14303 | 7 | 7 | 0.04% | 0.05% | 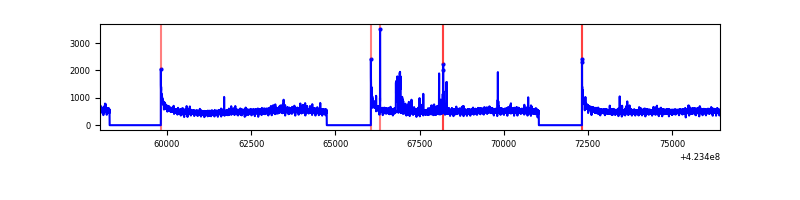 |
| B | 18417 | 14303 | 162 | 162 | 0.88% | 1.13% | 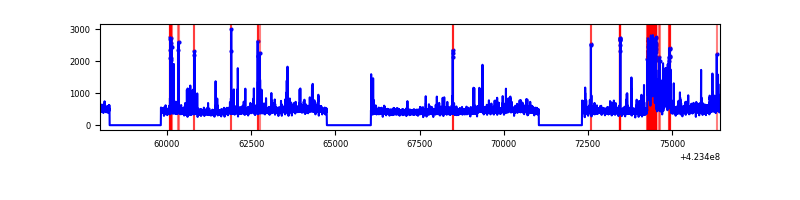 |
| C | 18417 | 14303 | 235 | 235 | 1.28% | 1.64% | 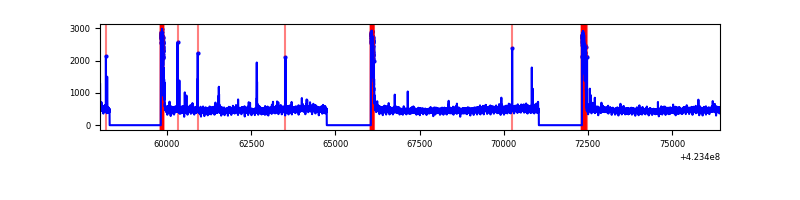 |
| D | 18417 | 14303 | 364 | 364 | 1.98% | 2.54% | 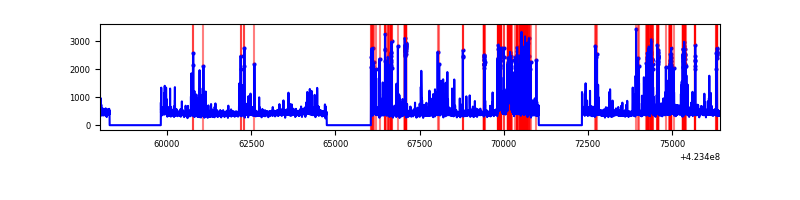 |
Top three noisy pixels from each quadrant. If the there are fewer than three noisy pixels in the level2.evt file, extra rows are filled as -1
| Pixel properties | Quadrant properties | ||||||
|---|---|---|---|---|---|---|---|
| Quadrant | DetID | PixID | Counts | Sigma | Mean | Median | Sigma |
| A | 10 | 83 | 1182624 | 3663.34 | 1578 | 1545 | 322.4 |
| A | 14 | 235 | 222340 | 684.84 | 1578 | 1545 | 322.4 |
| A | 13 | 254 | 25938 | 75.66 | 1578 | 1545 | 322.4 |
| B | 0 | 186 | 602821 | 2016.04 | 1548 | 1506 | 298.3 |
| B | 5 | 255 | 205504 | 683.95 | 1548 | 1506 | 298.3 |
| B | 0 | 245 | 174421 | 579.74 | 1548 | 1506 | 298.3 |
| C | 0 | 10 | 665541 | 1884.01 | 1519 | 1525 | 352.4 |
| C | 15 | 214 | 573632 | 1623.23 | 1519 | 1525 | 352.4 |
| C | 14 | 254 | 55779 | 153.93 | 1519 | 1525 | 352.4 |
| D | 12 | 128 | 691889 | 1844.84 | 1528 | 1483 | 374.2 |
| D | 13 | 249 | 512959 | 1366.72 | 1528 | 1483 | 374.2 |
| D | 1 | 47 | 146368 | 387.15 | 1528 | 1483 | 374.2 |
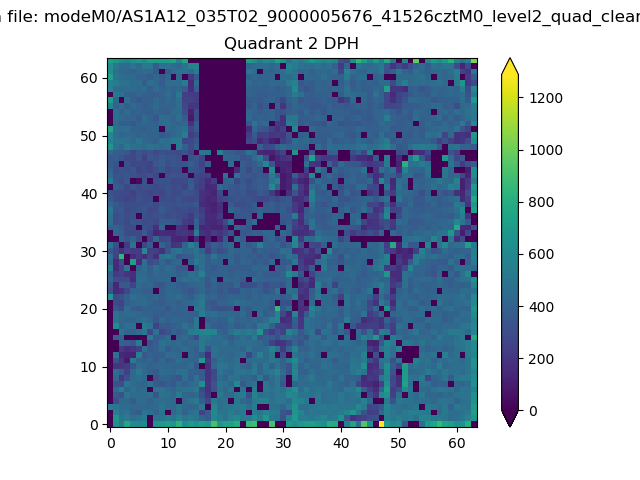
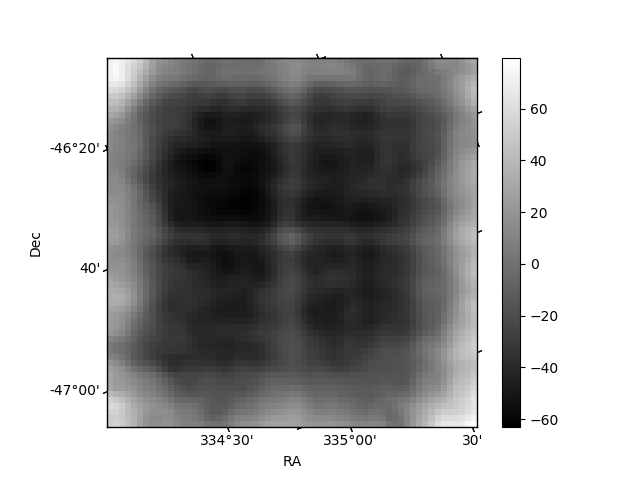
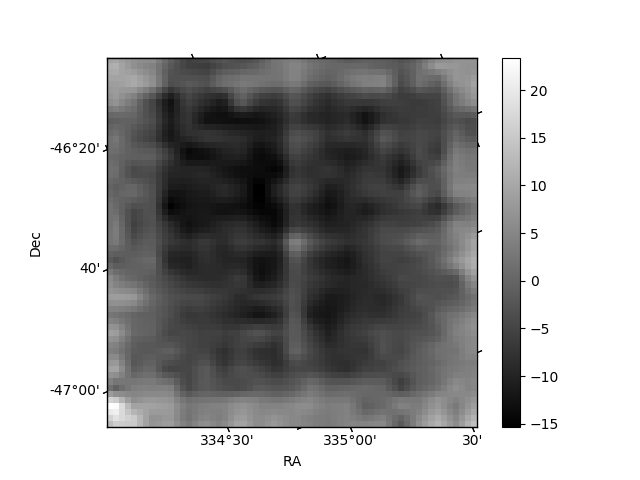
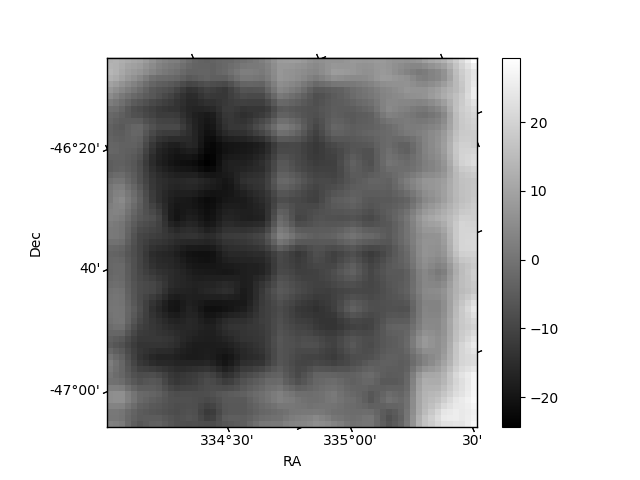
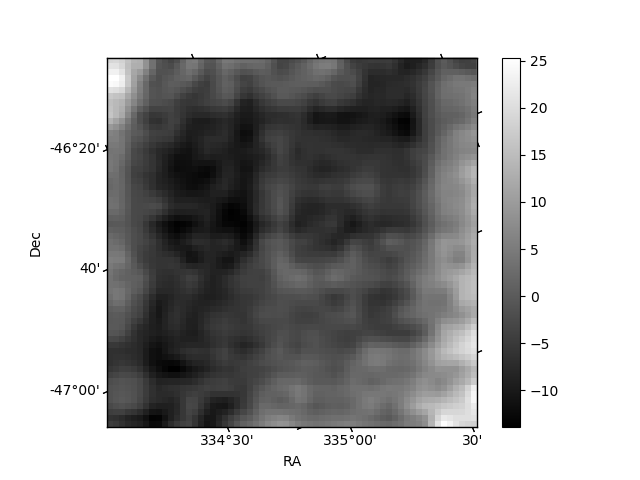
Histogram calculated using DETX and DETY for each event in the final _common_clean file
| Quadrant A | 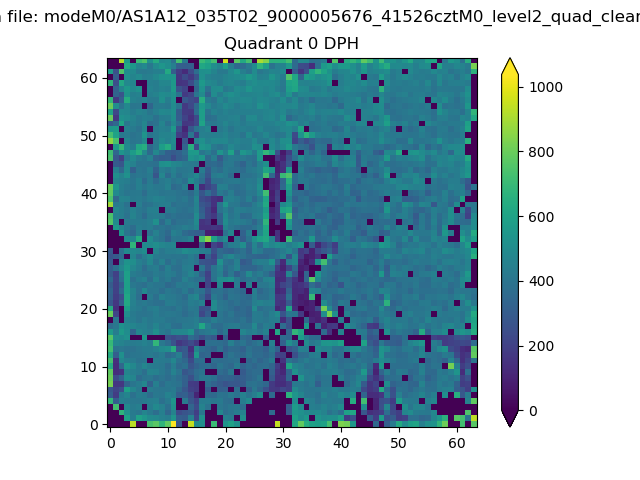 |
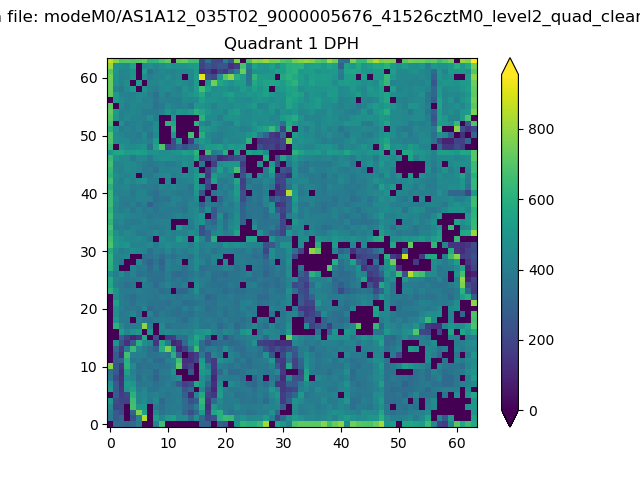 |
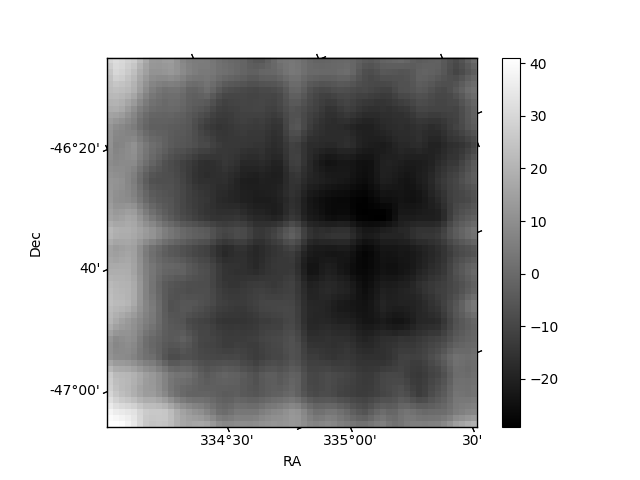
Quadrant B |
|---|---|---|---|
| Quadrant D | 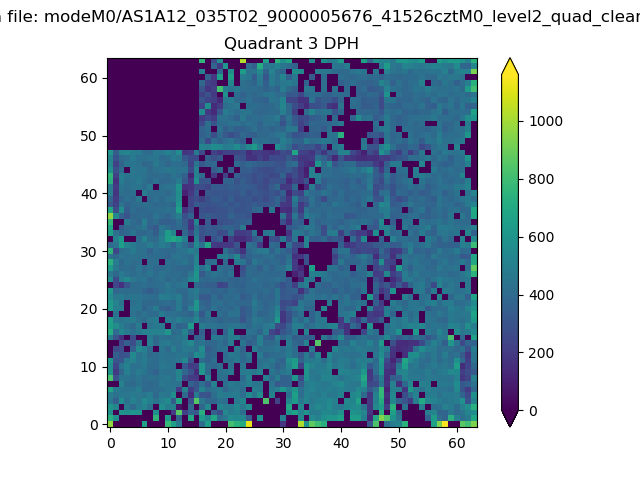 |
 |
Quadrant C |
| Plot type | Count rate plots | Images |
|---|---|---|
| Comparison with Poisson distribution Blue bars denote a histogram of data divided into 1 sec bins. Red curve is a Poisson curve with rate = median count rate of data. |
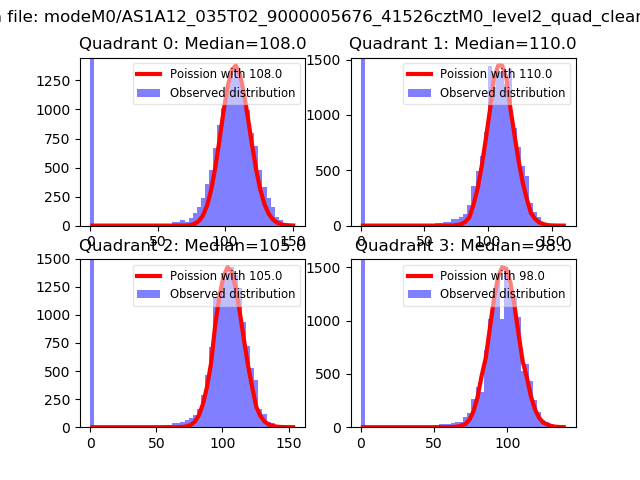 |
 |
| Quadrant-wise count rates Data is divided into 100 sec bins |
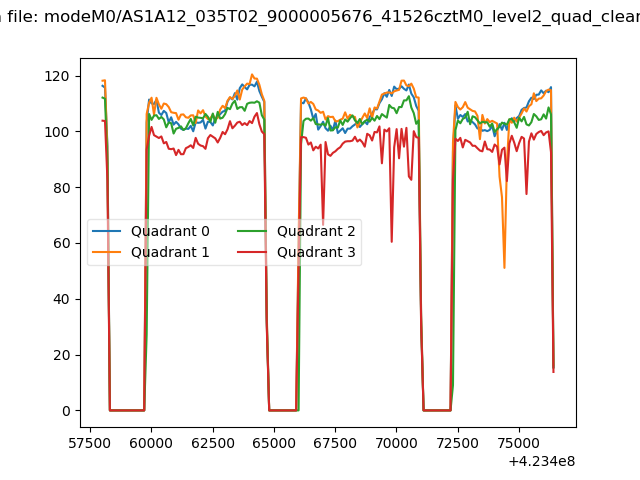 |
|
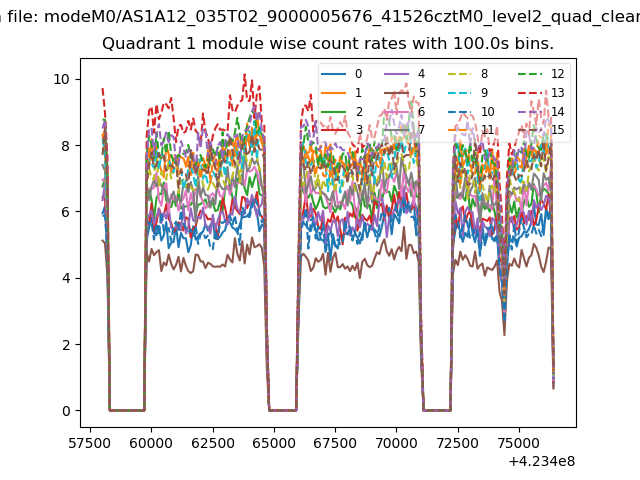
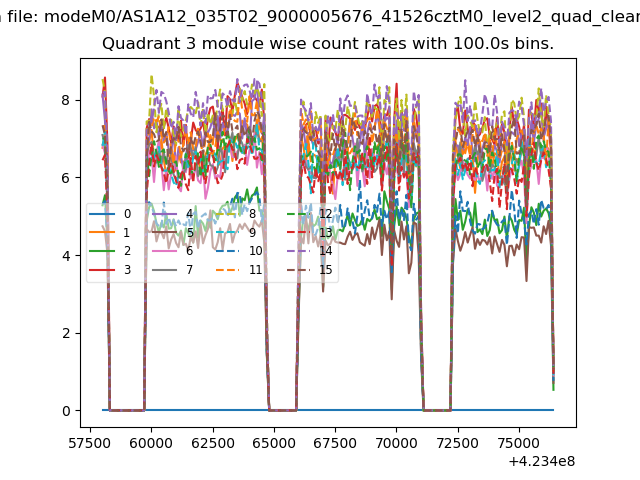
| Module-wise count rates for Quadrant A Data is divided into 100 sec bins |
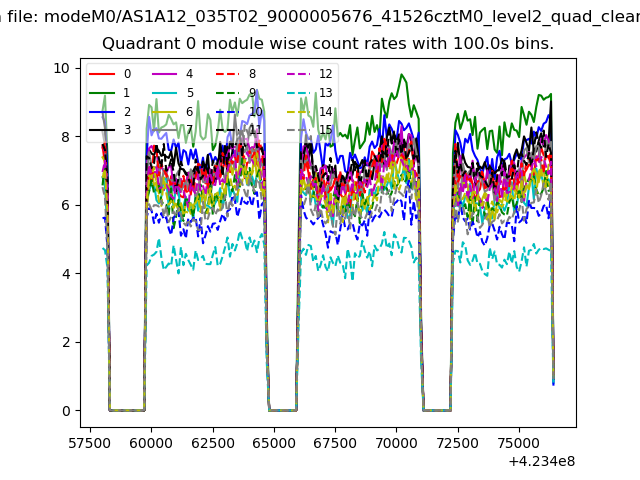 |
 |
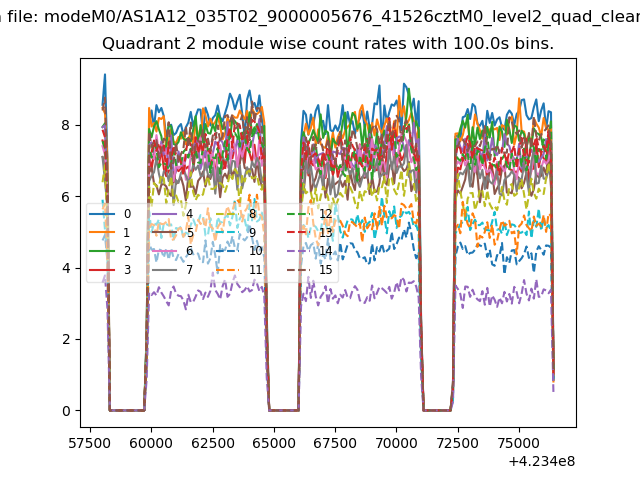
| Module-wise count rates for Quadrant B Data is divided into 100 sec bins |
 |
 |
| Module-wise count rates for Quadrant C Data is divided into 100 sec bins |
 |
 |
| Module-wise count rates for Quadrant D Data is divided into 100 sec bins |
 |
 |
| Parameter | Plot |
|---|---|
| CZT HV Monitor | 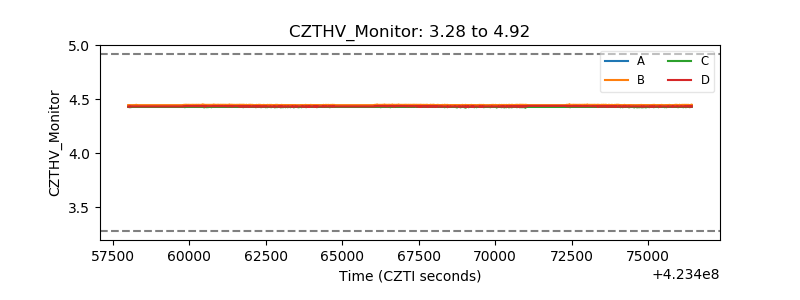 |
| D_VDD | 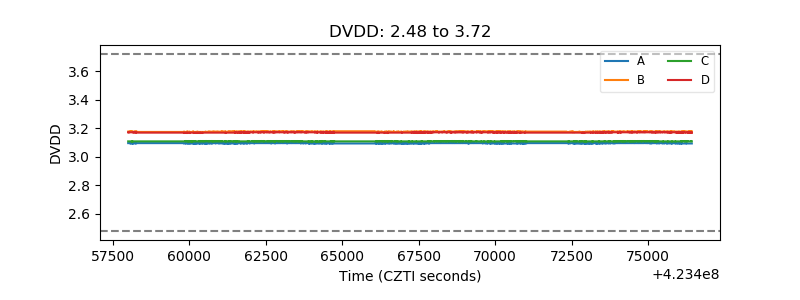 |
| Temperature 1 | 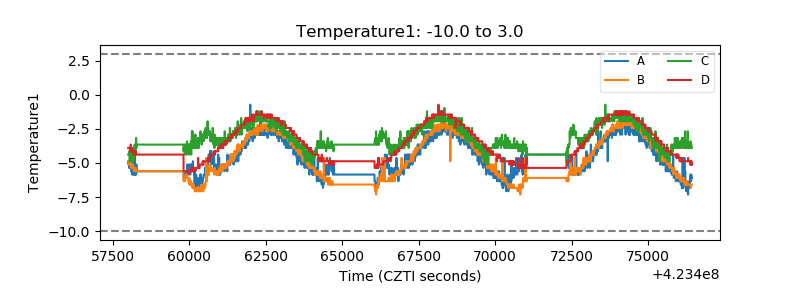 |
| Veto HV Monitor | 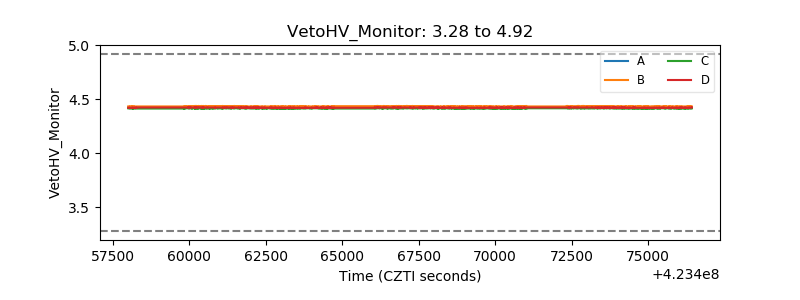 |
| Veto LLD | 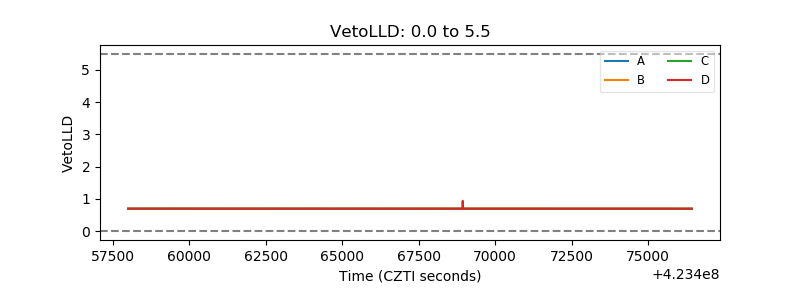 |
| Alpha Counter | 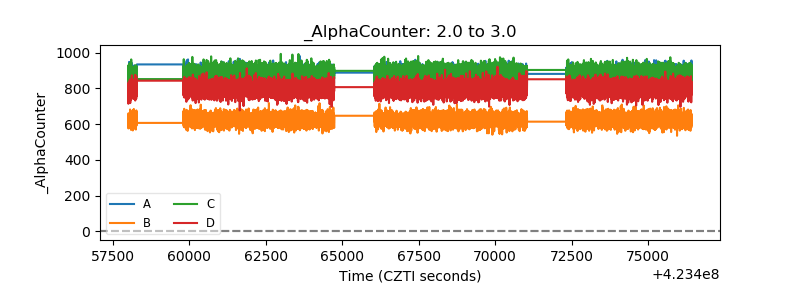 |
| _CPM_Rate | 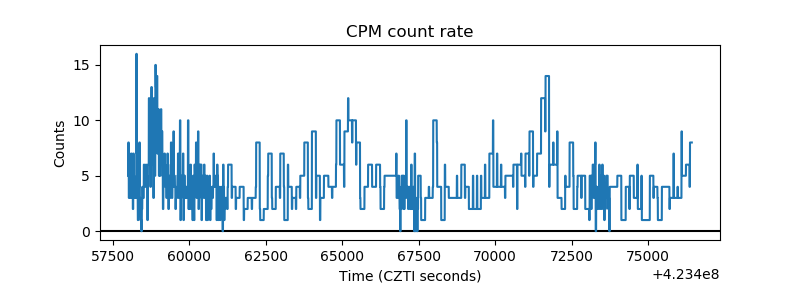 |
| CZT Counter | 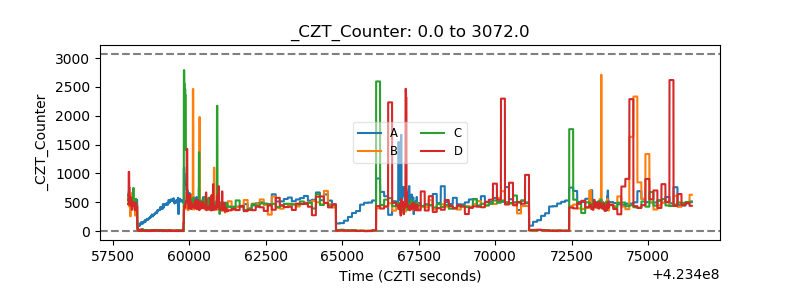 |
| +2.5 Volts monitor | 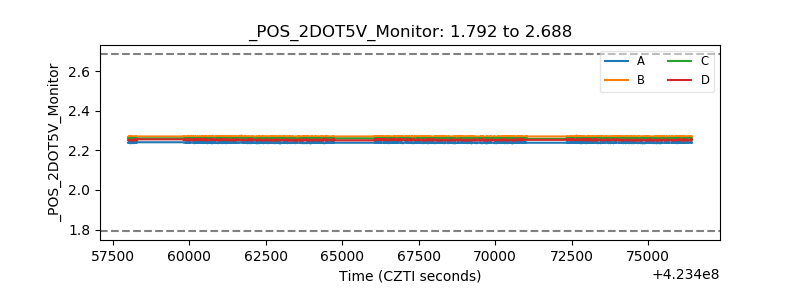 |
| +5 Volts monitor | 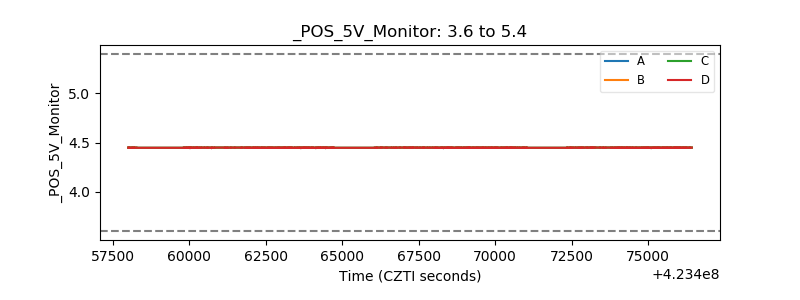 |
| _ROLL_ROT | 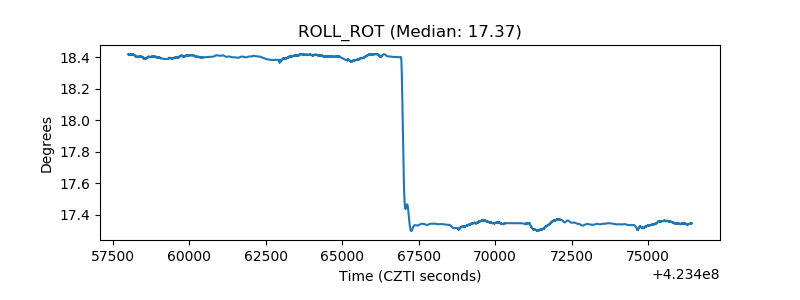 |
| _Roll_DEC | 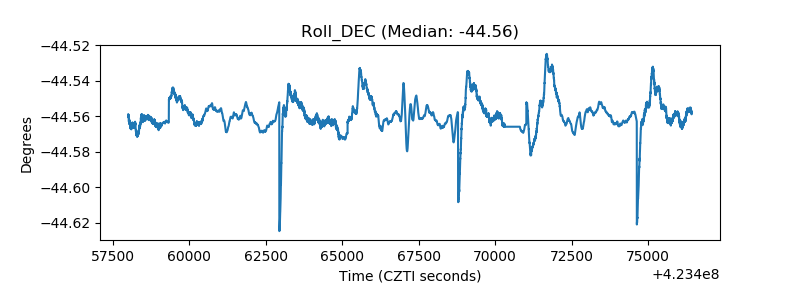 |
| _Roll_RA | 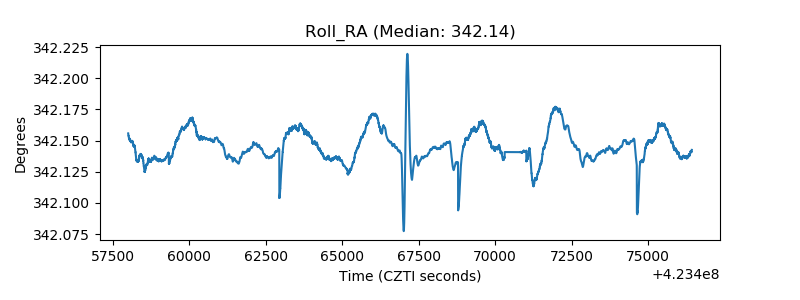 |
| Veto Counter | 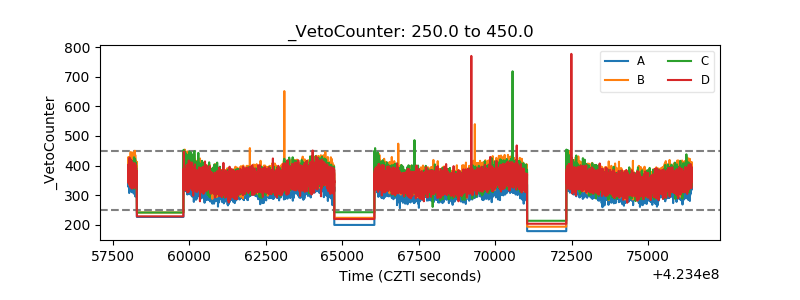 |