| Param | Original file | Final file |
|---|---|---|
| Filename | modeM0/AS1A12_035T02_9000005676_41527cztM0_level2.fits | modeM0/AS1A12_035T02_9000005676_41527cztM0_level2_quad_clean.evt |
| Size (bytes) | 738,397,440 | 200,496,960 |
| Size | 704.2 MB | 191.2 MB |
| Events in quadrant A | 6,562,107 | 1,347,463 |
| Events in quadrant B | 6,198,837 | 1,365,881 |
| Events in quadrant C | 6,559,812 | 1,290,391 |
| Events in quadrant D | 7,054,766 | 1,212,905 |
| Mode SS | |||
|---|---|---|---|
| Quadrant | BADHDUFLAG | Total packets | Discarded packets |
| A | 0 | 254 | 0 |
| B | 0 | 254 | 0 |
| C | 0 | 254 | 0 |
| D | 0 | 254 | 0 |
| Mode M0 | |||
|---|---|---|---|
| Quadrant | BADHDUFLAG | Total packets | Discarded packets |
| A | 0 | 26556 | 4 |
| B | 0 | 26572 | 3 |
| C | 0 | 27124 | 3 |
| D | 0 | 29326 | 3 |
| Mode M9 | |||
|---|---|---|---|
| Quadrant | BADHDUFLAG | Total packets | Discarded packets |
| A | 0 | 44 | 0 |
| B | 0 | 44 | 0 |
| C | 0 | 44 | 0 |
| D | 0 | 44 | 0 |
| Quadrant | Total seconds | Saturated seconds | Saturation percentage |
|---|---|---|---|
| A | 12349 | 25 | 0.202446% |
| B | 12349 | 40 | 0.323913% |
| C | 12349 | 266 | 2.154021% |
| D | 12349 | 188 | 1.522390% |
Noise dominated data is calculated using 1-second bins in cleaned event files. If a bin has >2000 counts, and if more than 50% of those come from <1% of pixels, then it is considered to be noise-dominated and hence unusable.
| Quadrant | # 1 sec bins | Bins with >0 counts | Bins with >2000 counts | High rate bins dominated by noise | Noise dominated (total time) | Noise dominated (detector-on time) | Marked lightcurve |
|---|---|---|---|---|---|---|---|
| A | 16737 | 12352 | 9 | 9 | 0.05% | 0.07% | 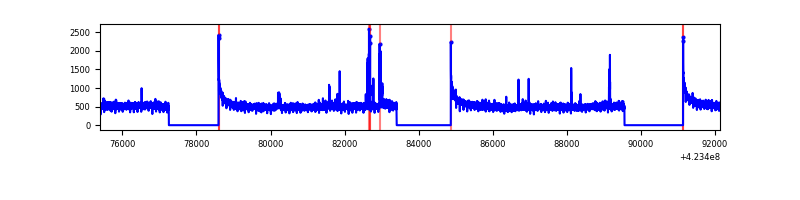 |
| B | 16737 | 12352 | 16 | 16 | 0.10% | 0.13% | 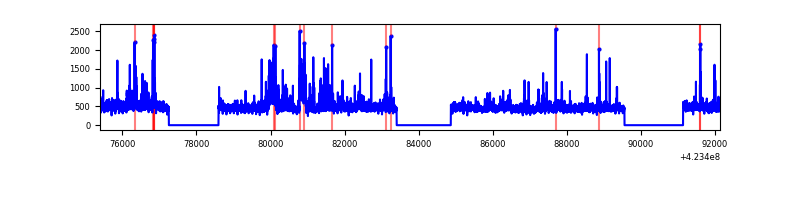 |
| C | 16737 | 12352 | 257 | 257 | 1.54% | 2.08% | 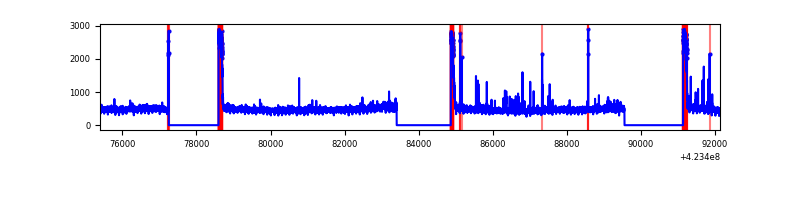 |
| D | 16737 | 12352 | 197 | 197 | 1.18% | 1.59% | 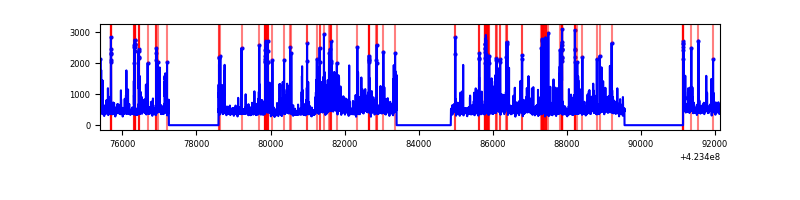 |
Top three noisy pixels from each quadrant. If the there are fewer than three noisy pixels in the level2.evt file, extra rows are filled as -1
| Pixel properties | Quadrant properties | ||||||
|---|---|---|---|---|---|---|---|
| Quadrant | DetID | PixID | Counts | Sigma | Mean | Median | Sigma |
| A | 10 | 83 | 1076243 | 3825.38 | 1372 | 1341 | 281.0 |
| A | 14 | 235 | 132058 | 465.2 | 1372 | 1341 | 281.0 |
| A | 13 | 6 | 25879 | 87.33 | 1372 | 1341 | 281.0 |
| B | 0 | 190 | 267039 | 1020.15 | 1356 | 1317 | 260.5 |
| B | 0 | 186 | 262938 | 1004.4 | 1356 | 1317 | 260.5 |
| B | 0 | 245 | 130602 | 496.34 | 1356 | 1317 | 260.5 |
| C | 0 | 10 | 680148 | 2228.84 | 1314 | 1321 | 304.6 |
| C | 15 | 214 | 521578 | 1708.19 | 1314 | 1321 | 304.6 |
| C | 14 | 254 | 99502 | 322.36 | 1314 | 1321 | 304.6 |
| D | 5 | 222 | 993509 | 3043.3 | 1333 | 1297 | 326.0 |
| D | 13 | 249 | 305017 | 931.57 | 1333 | 1297 | 326.0 |
| D | 1 | 47 | 251413 | 767.15 | 1333 | 1297 | 326.0 |
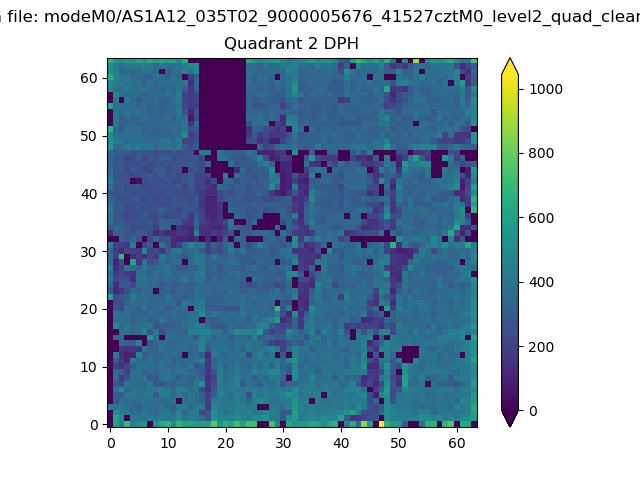
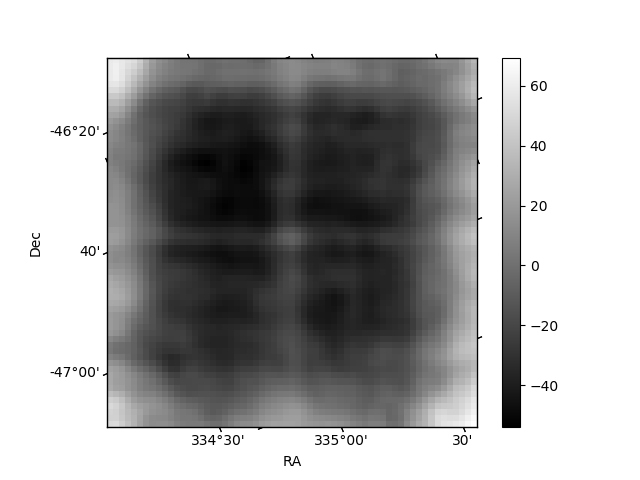
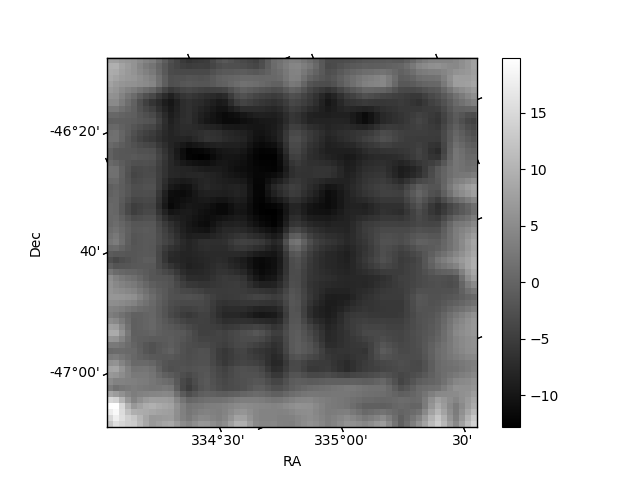
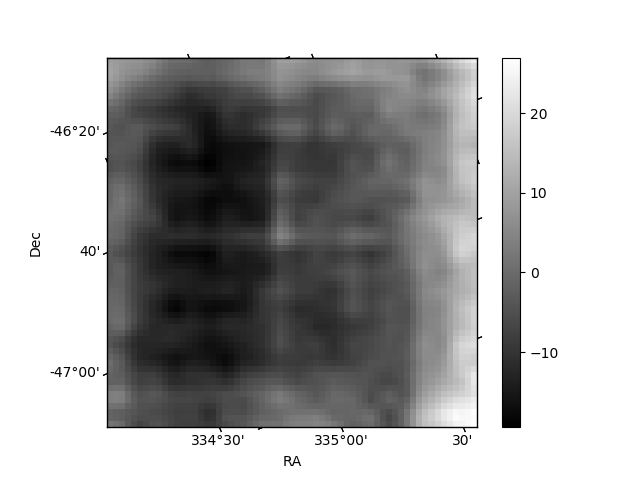
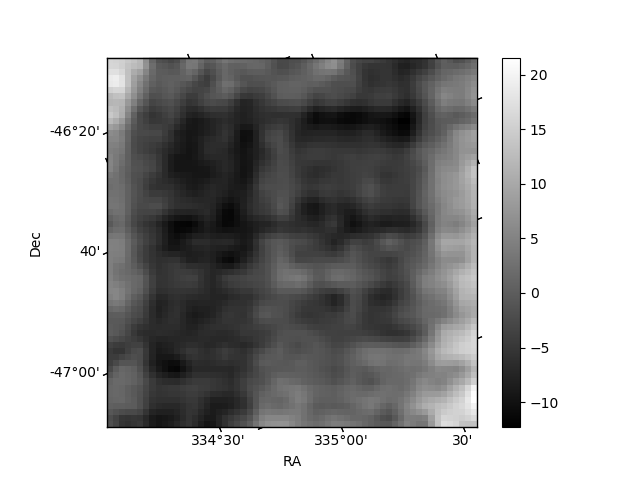
Histogram calculated using DETX and DETY for each event in the final _common_clean file
| Quadrant A | 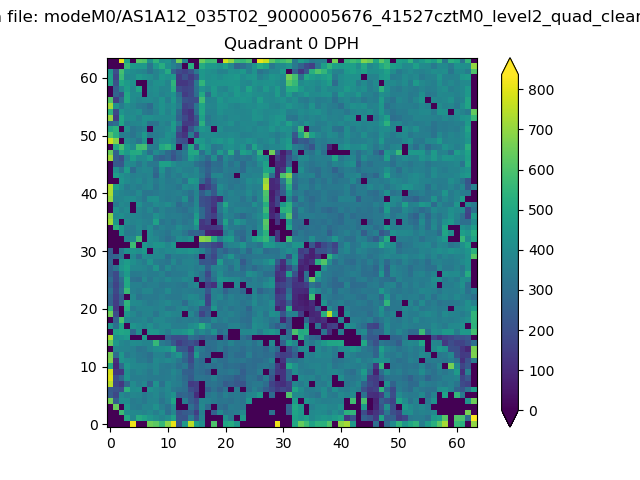 |
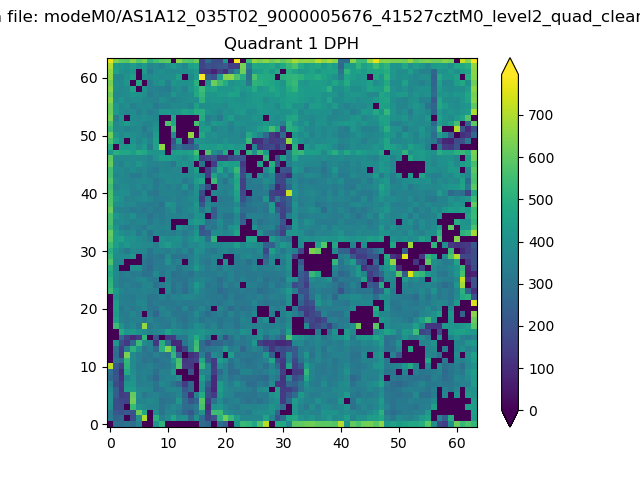 |
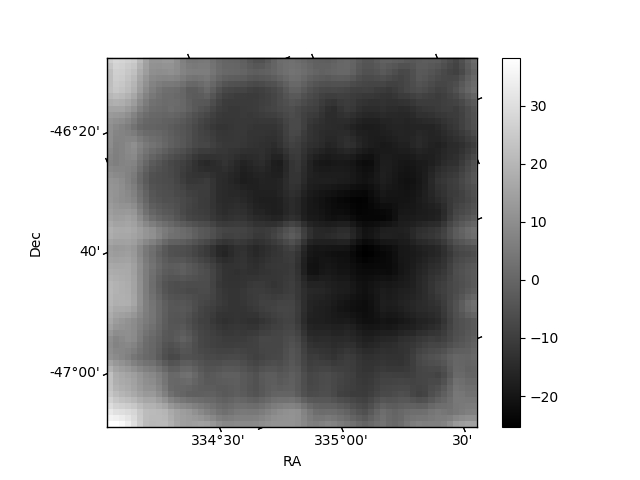
Quadrant B |
|---|---|---|---|
| Quadrant D | 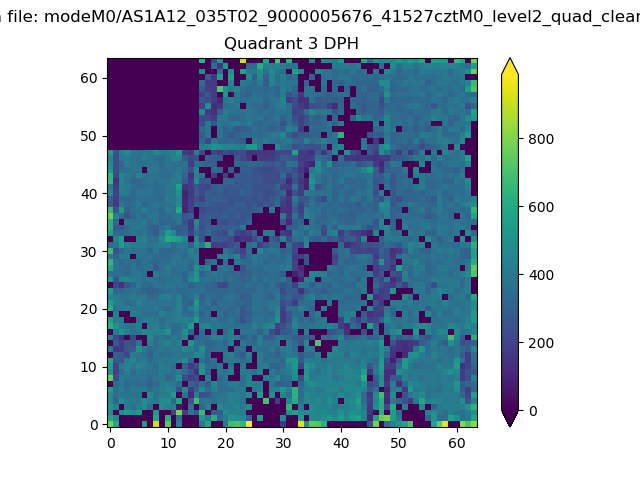 |
 |
Quadrant C |
| Plot type | Count rate plots | Images |
|---|---|---|
| Comparison with Poisson distribution Blue bars denote a histogram of data divided into 1 sec bins. Red curve is a Poisson curve with rate = median count rate of data. |
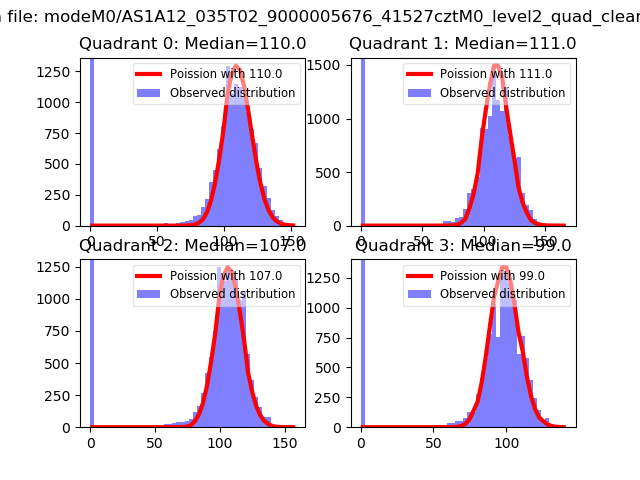 |
 |
| Quadrant-wise count rates Data is divided into 100 sec bins |
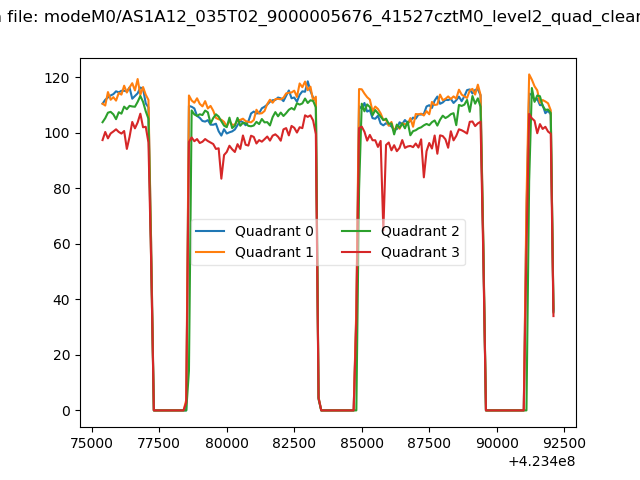 |
|
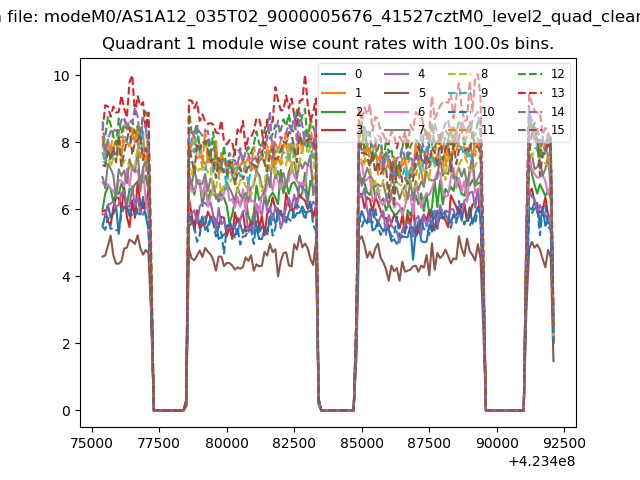
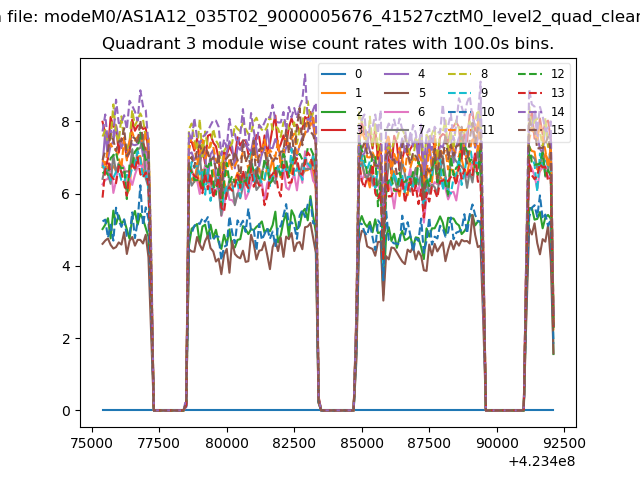
| Module-wise count rates for Quadrant A Data is divided into 100 sec bins |
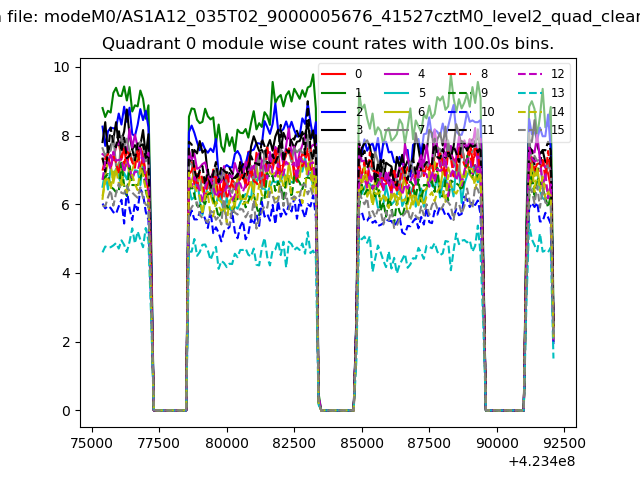 |
 |
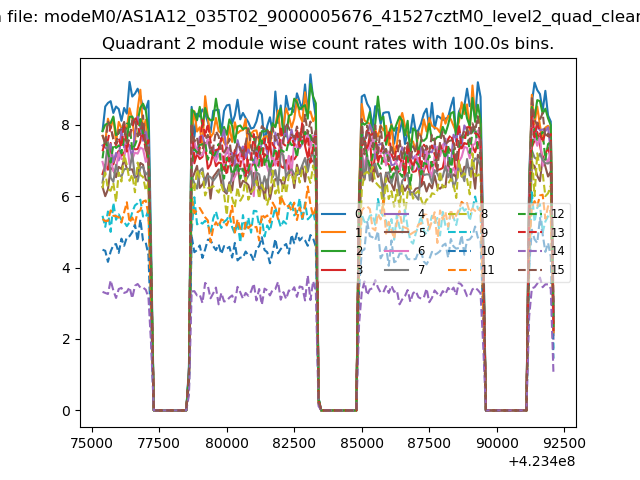
| Module-wise count rates for Quadrant B Data is divided into 100 sec bins |
 |
 |
| Module-wise count rates for Quadrant C Data is divided into 100 sec bins |
 |
 |
| Module-wise count rates for Quadrant D Data is divided into 100 sec bins |
 |
 |
| Parameter | Plot |
|---|---|
| CZT HV Monitor | 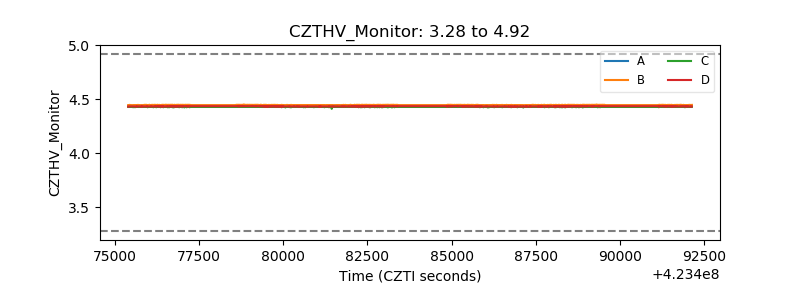 |
| D_VDD | 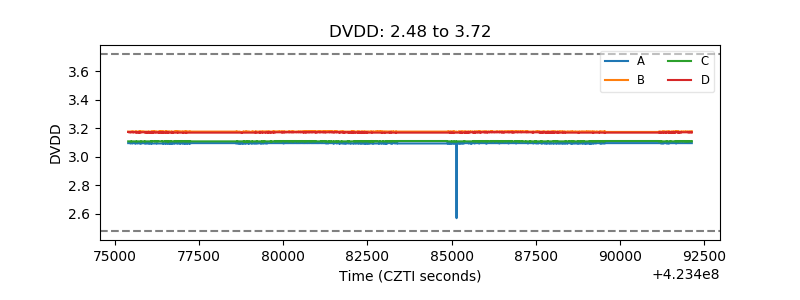 |
| Temperature 1 | 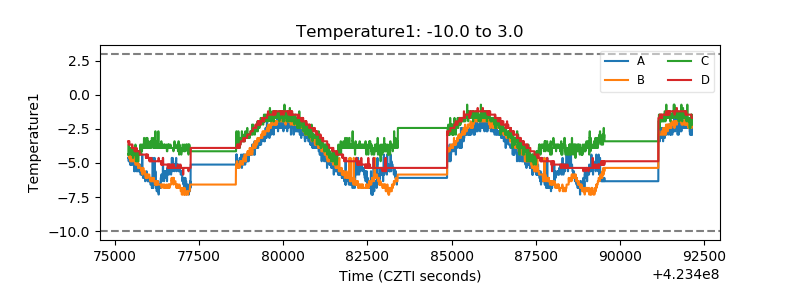 |
| Veto HV Monitor | 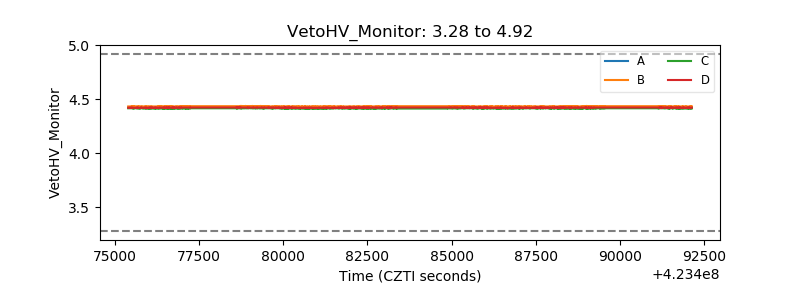 |
| Veto LLD | 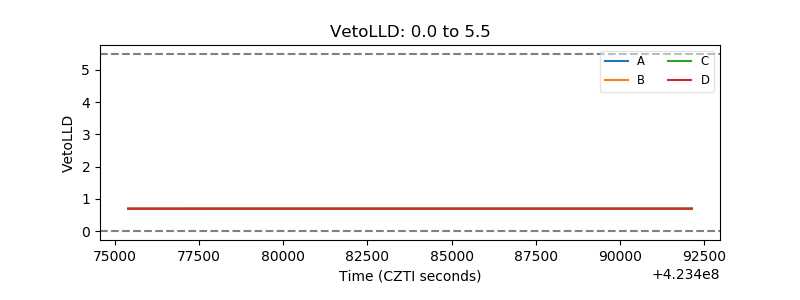 |
| Alpha Counter | 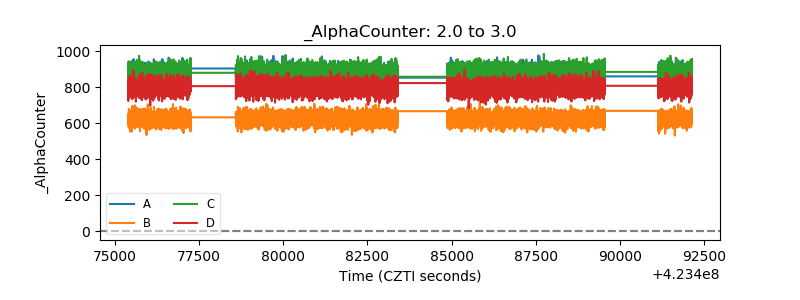 |
| _CPM_Rate | 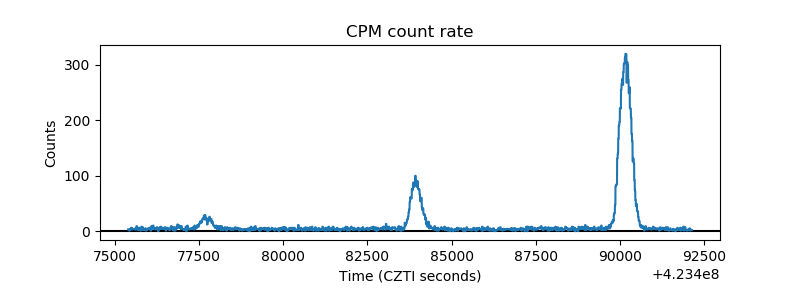 |
| CZT Counter | 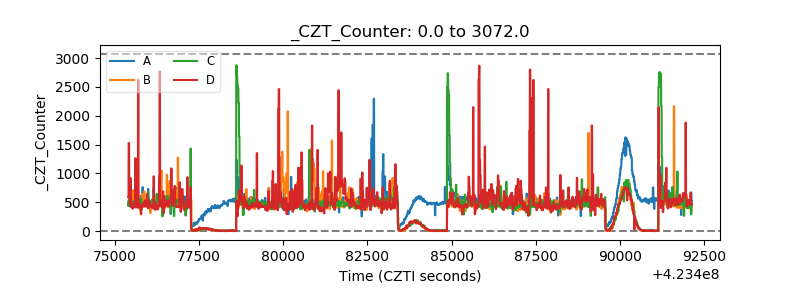 |
| +2.5 Volts monitor | 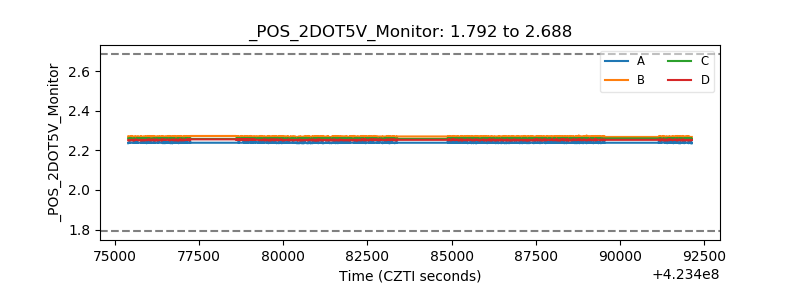 |
| +5 Volts monitor | 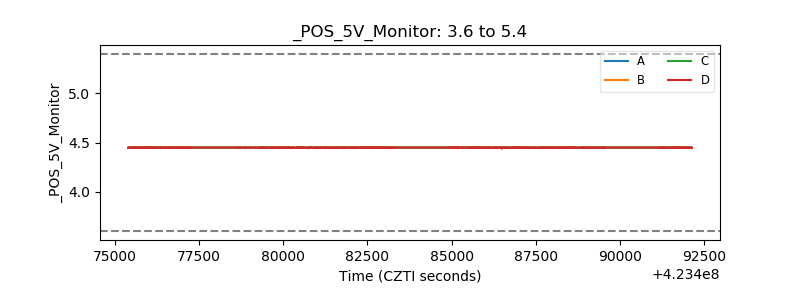 |
| _ROLL_ROT | 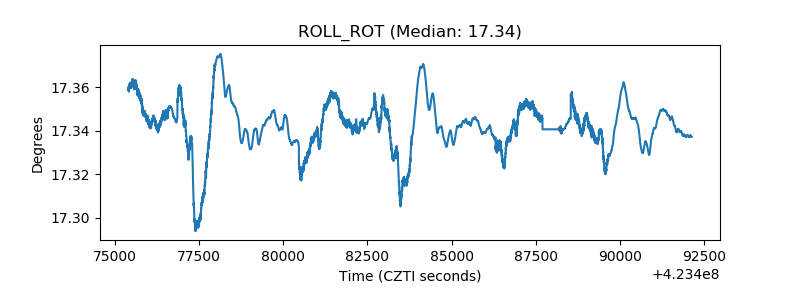 |
| _Roll_DEC | 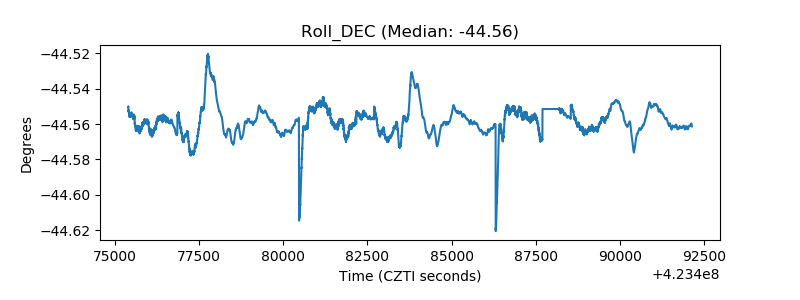 |
| _Roll_RA | 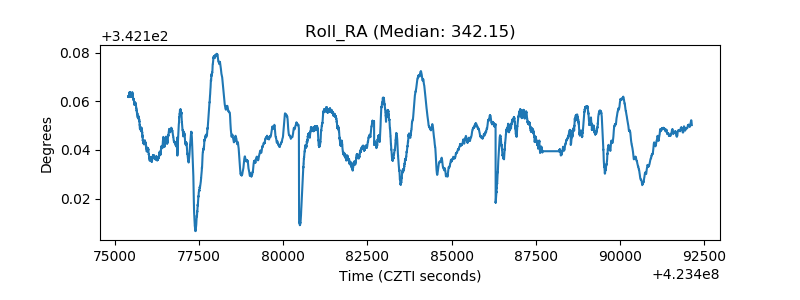 |
| Veto Counter | 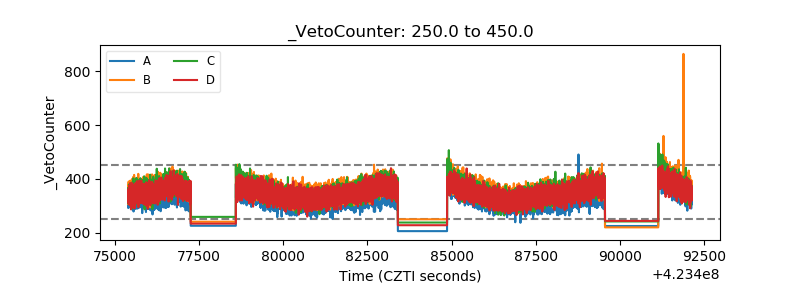 |