| Param | Original file | Final file |
|---|---|---|
| Filename | modeM0/AS1A12_035T02_9000005676_41528cztM0_level2.fits | modeM0/AS1A12_035T02_9000005676_41528cztM0_level2_quad_clean.evt |
| Size (bytes) | 355,072,320 | 92,171,520 |
| Size | 338.6 MB | 87.9 MB |
| Events in quadrant A | 3,021,174 | 623,400 |
| Events in quadrant B | 2,610,101 | 633,150 |
| Events in quadrant C | 3,375,586 | 583,508 |
| Events in quadrant D | 3,703,680 | 561,784 |
| Mode SS | |||
|---|---|---|---|
| Quadrant | BADHDUFLAG | Total packets | Discarded packets |
| A | 0 | 112 | 0 |
| B | 0 | 112 | 0 |
| C | 0 | 112 | 0 |
| D | 0 | 112 | 0 |
| Mode M0 | |||
|---|---|---|---|
| Quadrant | BADHDUFLAG | Total packets | Discarded packets |
| A | 0 | 12317 | 3 |
| B | 0 | 11499 | 2 |
| C | 0 | 13540 | 2 |
| D | 0 | 14776 | 2 |
| Mode M9 | |||
|---|---|---|---|
| Quadrant | BADHDUFLAG | Total packets | Discarded packets |
| A | 0 | 22 | 0 |
| B | 0 | 22 | 0 |
| C | 0 | 22 | 0 |
| D | 0 | 23 | 0 |
| Quadrant | Total seconds | Saturated seconds | Saturation percentage |
|---|---|---|---|
| A | 5562 | 24 | 0.431499% |
| B | 5562 | 18 | 0.323625% |
| C | 5562 | 236 | 4.243078% |
| D | 5562 | 150 | 2.696872% |
Noise dominated data is calculated using 1-second bins in cleaned event files. If a bin has >2000 counts, and if more than 50% of those come from <1% of pixels, then it is considered to be noise-dominated and hence unusable.
| Quadrant | # 1 sec bins | Bins with >0 counts | Bins with >2000 counts | High rate bins dominated by noise | Noise dominated (total time) | Noise dominated (detector-on time) | Marked lightcurve |
|---|---|---|---|---|---|---|---|
| A | 7264 | 5563 | 9 | 9 | 0.12% | 0.16% | 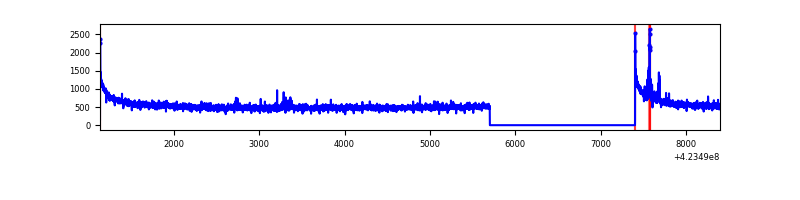 |
| B | 7264 | 5563 | 5 | 5 | 0.07% | 0.09% | 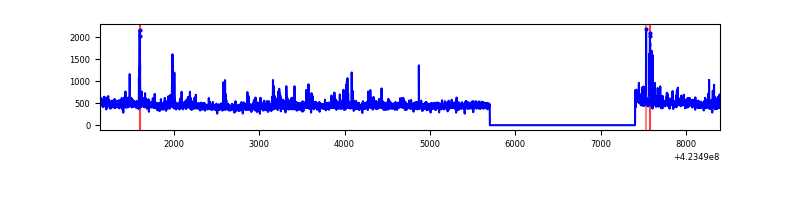 |
| C | 7264 | 5563 | 230 | 230 | 3.17% | 4.13% | 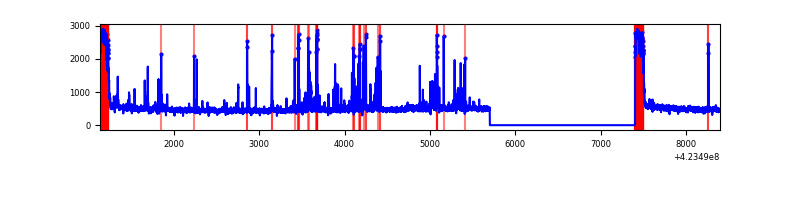 |
| D | 7264 | 5563 | 150 | 150 | 2.06% | 2.70% | 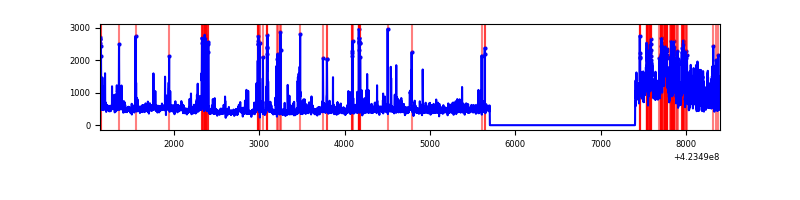 |
Top three noisy pixels from each quadrant. If the there are fewer than three noisy pixels in the level2.evt file, extra rows are filled as -1
| Pixel properties | Quadrant properties | ||||||
|---|---|---|---|---|---|---|---|
| Quadrant | DetID | PixID | Counts | Sigma | Mean | Median | Sigma |
| A | 10 | 83 | 560171 | 4364.88 | 621 | 607 | 128.2 |
| A | 13 | 248 | 30259 | 231.3 | 621 | 607 | 128.2 |
| A | 14 | 235 | 17034 | 128.14 | 621 | 607 | 128.2 |
| B | 0 | 245 | 68868 | 577.16 | 613 | 596 | 118.3 |
| B | 0 | 190 | 66068 | 553.49 | 613 | 596 | 118.3 |
| B | 0 | 186 | 30887 | 256.07 | 613 | 596 | 118.3 |
| C | 0 | 10 | 498404 | 3669.49 | 583 | 587 | 135.7 |
| C | 14 | 254 | 347028 | 2553.67 | 583 | 587 | 135.7 |
| C | 15 | 214 | 239526 | 1761.26 | 583 | 587 | 135.7 |
| D | 5 | 222 | 490279 | 3335.58 | 599 | 580 | 146.8 |
| D | 12 | 79 | 391169 | 2660.5 | 599 | 580 | 146.8 |
| D | 1 | 47 | 215674 | 1465.11 | 599 | 580 | 146.8 |
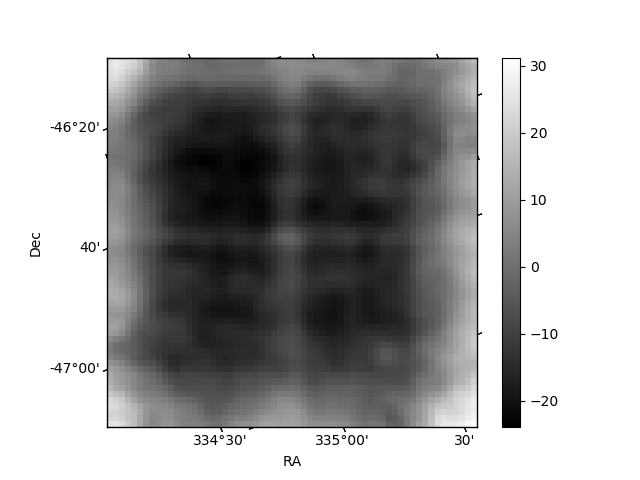
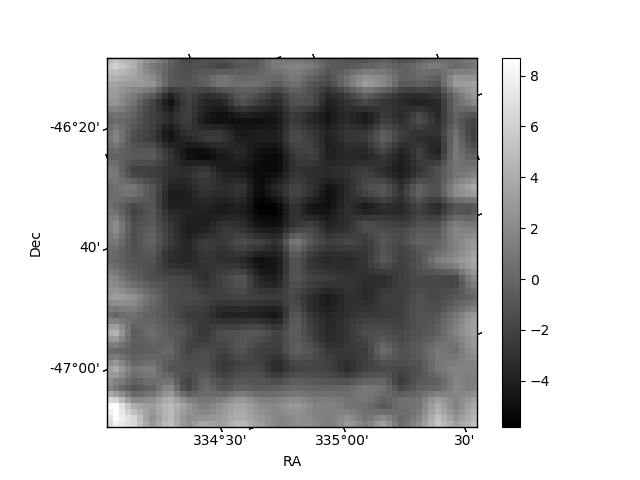
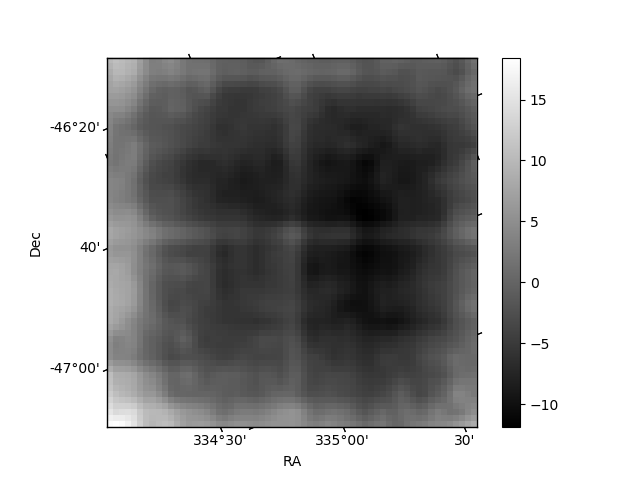
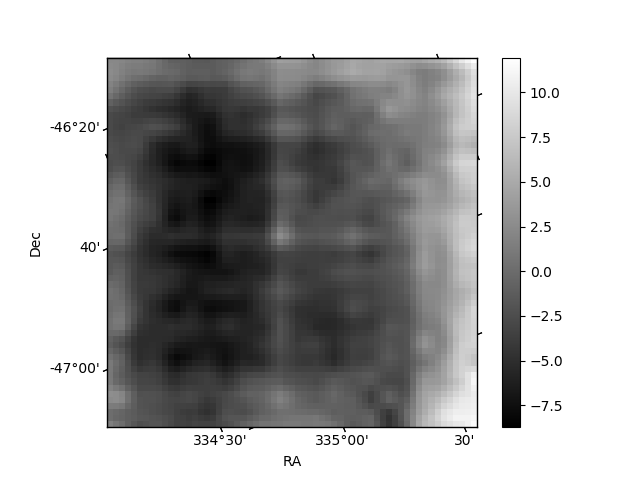
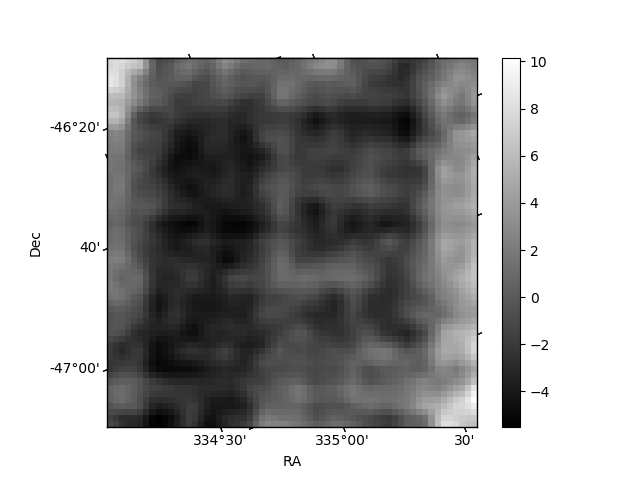
Histogram calculated using DETX and DETY for each event in the final _common_clean file
| Quadrant A | 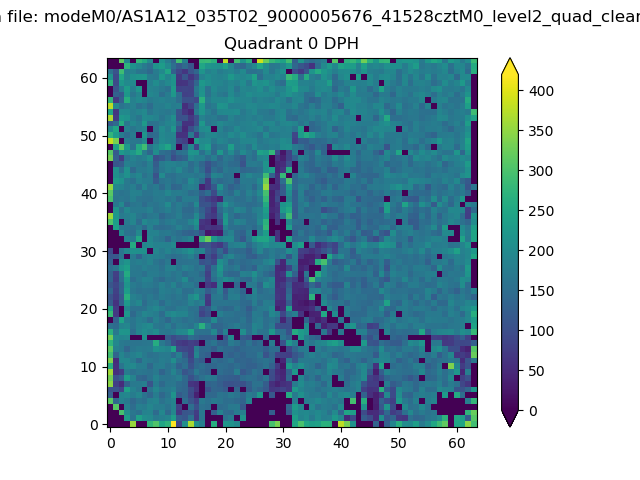 |
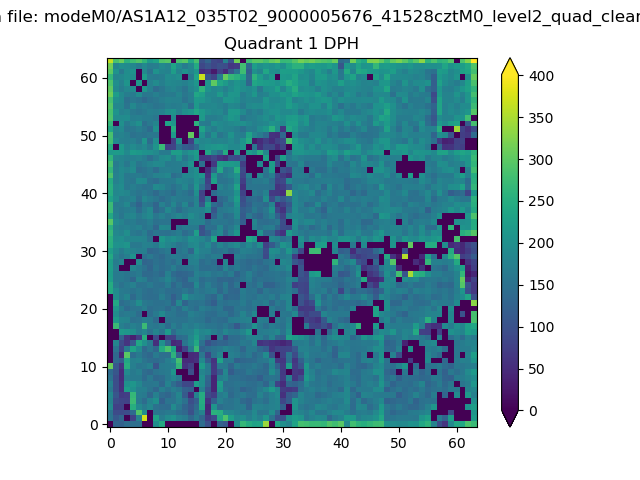 |
Quadrant B |
|---|---|---|---|
| Quadrant D | 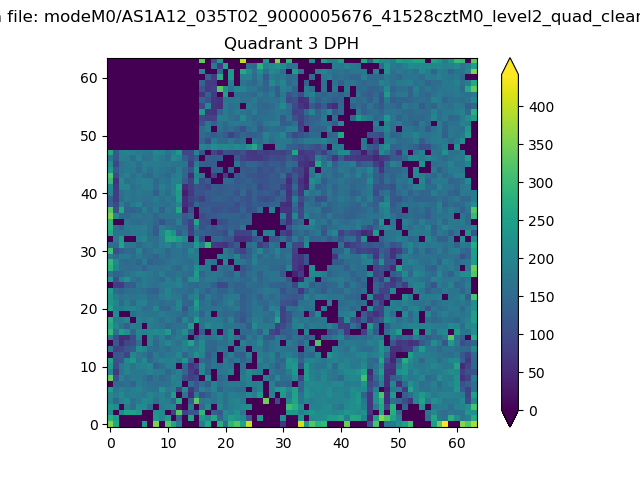 |
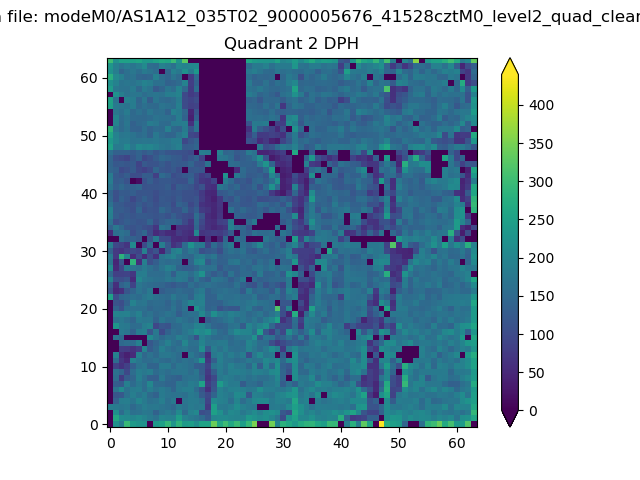 |
Quadrant C |
| Plot type | Count rate plots | Images |
|---|---|---|
| Comparison with Poisson distribution Blue bars denote a histogram of data divided into 1 sec bins. Red curve is a Poisson curve with rate = median count rate of data. |
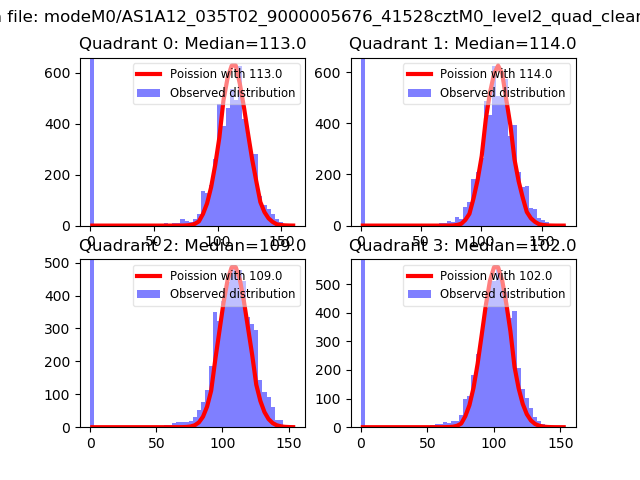 |
 |
| Quadrant-wise count rates Data is divided into 100 sec bins |
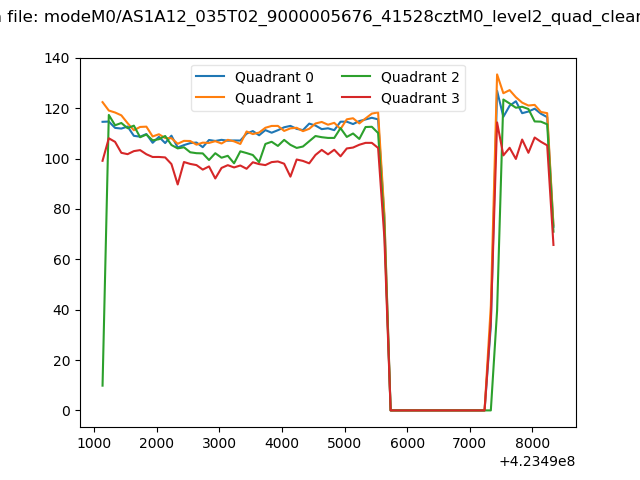 |
|
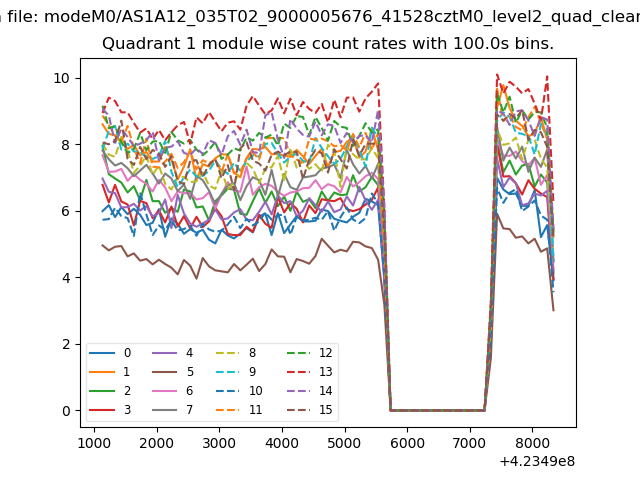
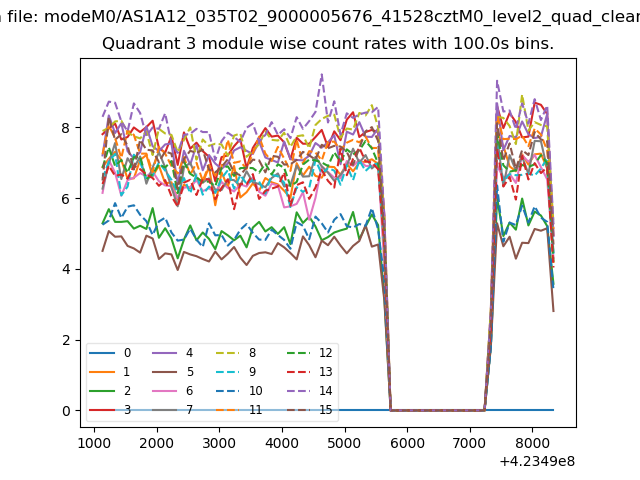
| Module-wise count rates for Quadrant A Data is divided into 100 sec bins |
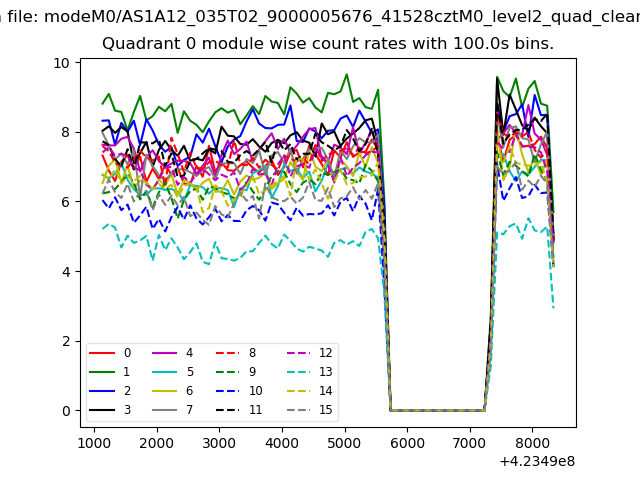 |
 |
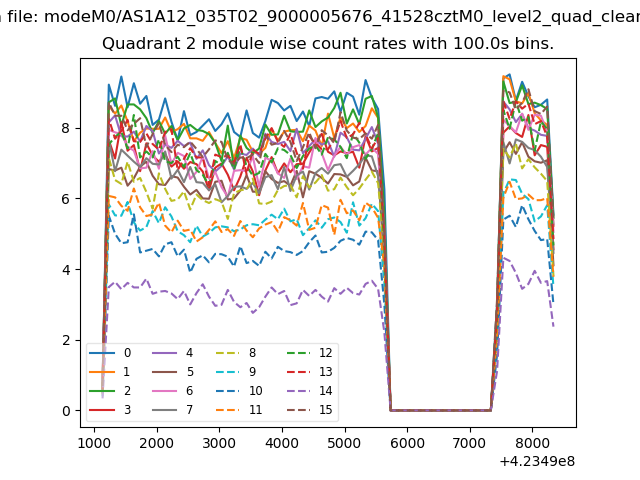
| Module-wise count rates for Quadrant B Data is divided into 100 sec bins |
 |
 |
| Module-wise count rates for Quadrant C Data is divided into 100 sec bins |
 |
 |
| Module-wise count rates for Quadrant D Data is divided into 100 sec bins |
 |
 |
| Parameter | Plot |
|---|---|
| CZT HV Monitor | 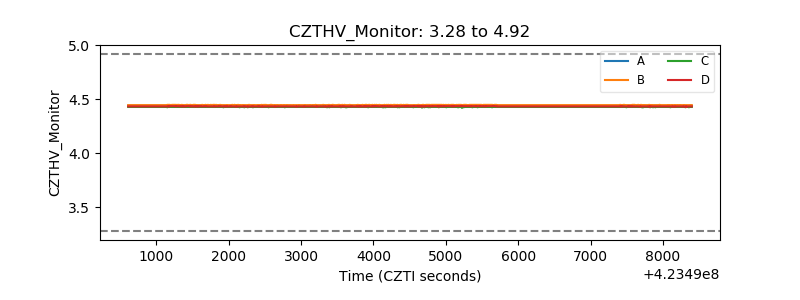 |
| D_VDD | 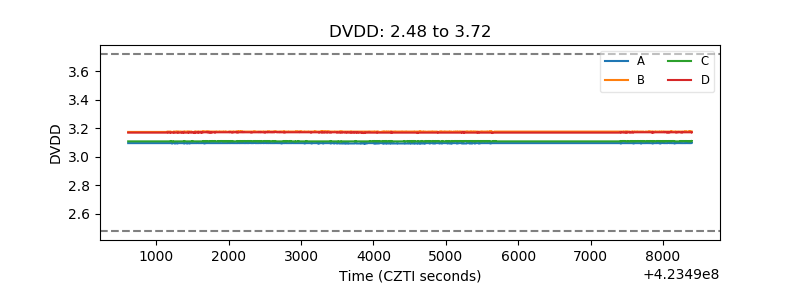 |
| Temperature 1 |  |
| Veto HV Monitor |  |
| Veto LLD | 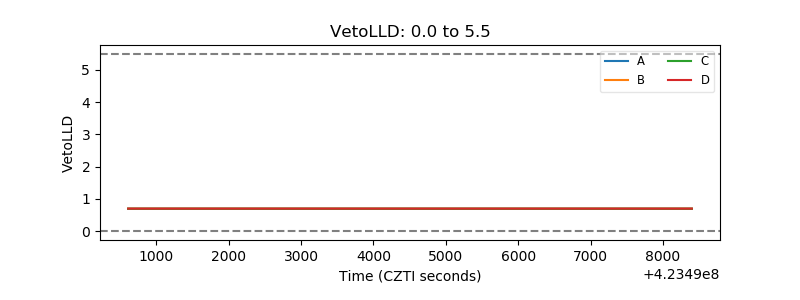 |
| Alpha Counter | 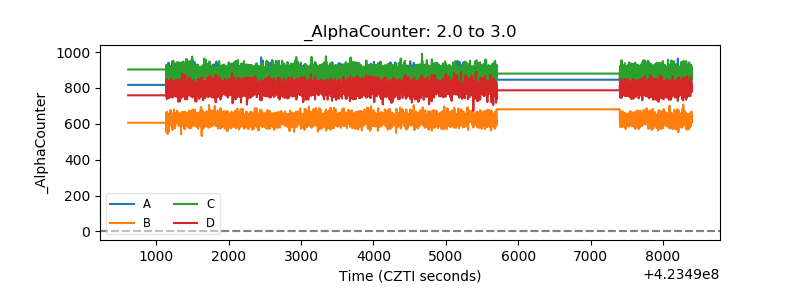 |
| _CPM_Rate | 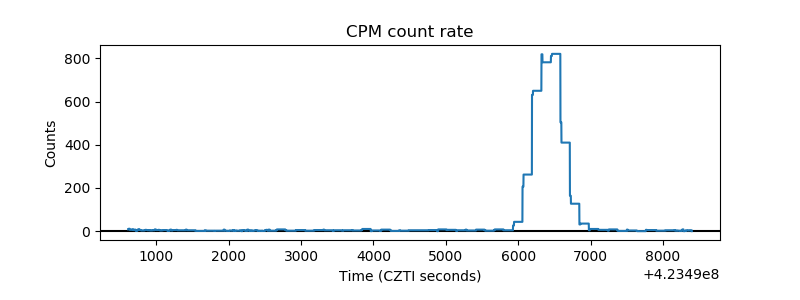 |
| CZT Counter | 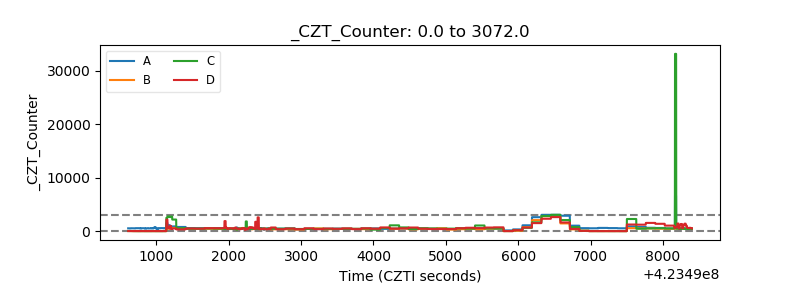 |
| +2.5 Volts monitor | 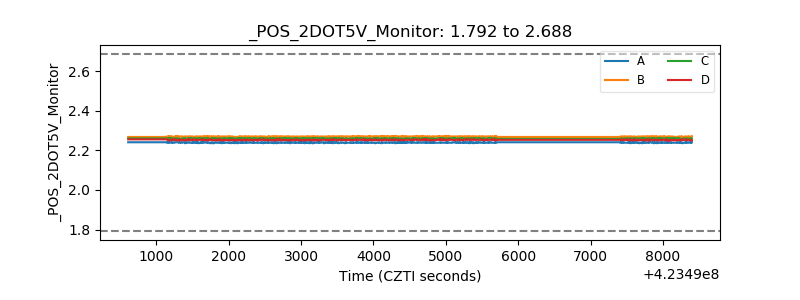 |
| +5 Volts monitor | 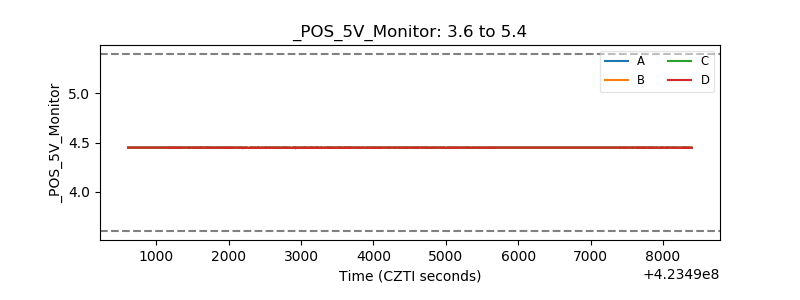 |
| _ROLL_ROT | 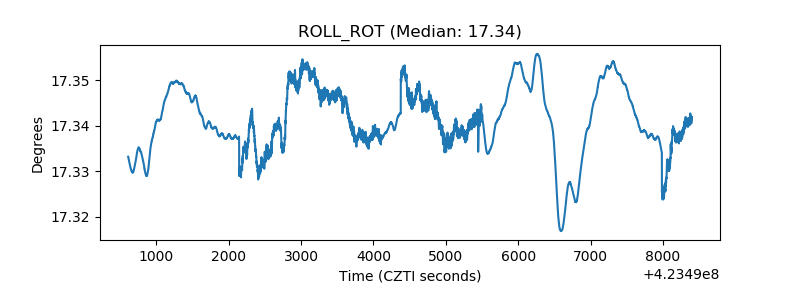 |
| _Roll_DEC | 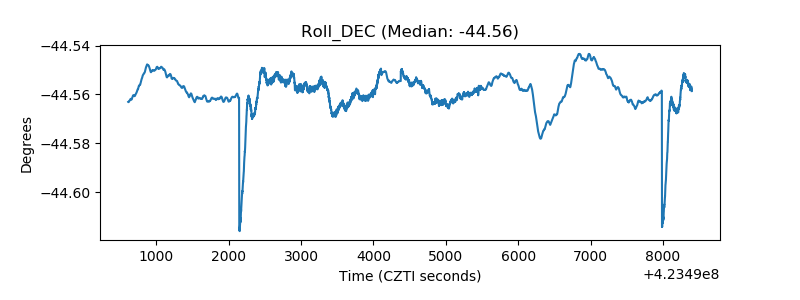 |
| _Roll_RA | 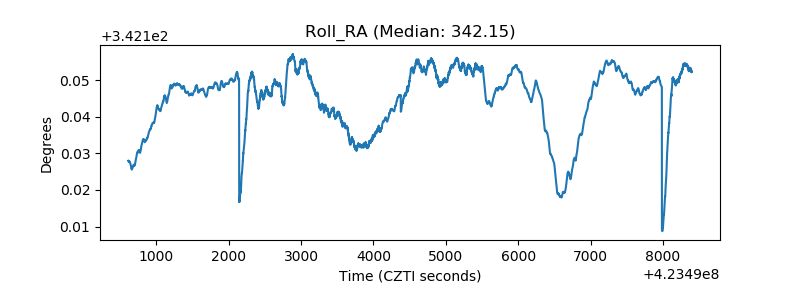 |
| Veto Counter | 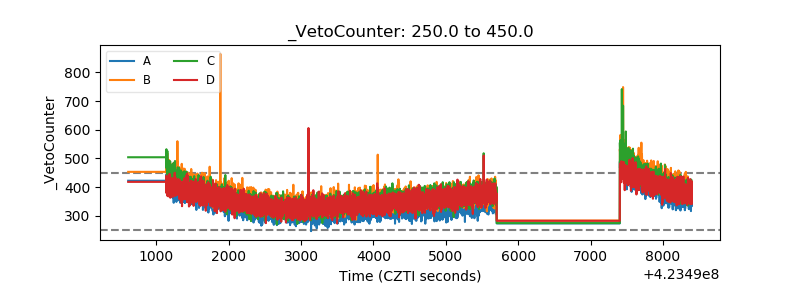 |