| Param | Original file | Final file |
|---|---|---|
| Filename | modeM0/AS1A12_035T02_9000005676_41530cztM0_level2.fits | modeM0/AS1A12_035T02_9000005676_41530cztM0_level2_quad_clean.evt |
| Size (bytes) | 353,787,840 | 90,817,920 |
| Size | 337.4 MB | 86.6 MB |
| Events in quadrant A | 2,909,377 | 625,328 |
| Events in quadrant B | 2,682,029 | 633,264 |
| Events in quadrant C | 3,113,244 | 573,676 |
| Events in quadrant D | 3,983,147 | 550,181 |
| Mode SS | |||
|---|---|---|---|
| Quadrant | BADHDUFLAG | Total packets | Discarded packets |
| A | 0 | 108 | 0 |
| B | 0 | 108 | 0 |
| C | 0 | 108 | 0 |
| D | 0 | 108 | 0 |
| Mode M0 | |||
|---|---|---|---|
| Quadrant | BADHDUFLAG | Total packets | Discarded packets |
| A | 0 | 11876 | 3 |
| B | 0 | 11454 | 2 |
| C | 0 | 12462 | 2 |
| D | 0 | 15391 | 2 |
| Mode M9 | |||
|---|---|---|---|
| Quadrant | BADHDUFLAG | Total packets | Discarded packets |
| A | 0 | 23 | 0 |
| B | 0 | 23 | 0 |
| C | 0 | 23 | 0 |
| D | 0 | 24 | 0 |
| Quadrant | Total seconds | Saturated seconds | Saturation percentage |
|---|---|---|---|
| A | 5243 | 27 | 0.514972% |
| B | 5243 | 30 | 0.572191% |
| C | 5243 | 229 | 4.367728% |
| D | 5243 | 195 | 3.719245% |
Noise dominated data is calculated using 1-second bins in cleaned event files. If a bin has >2000 counts, and if more than 50% of those come from <1% of pixels, then it is considered to be noise-dominated and hence unusable.
| Quadrant | # 1 sec bins | Bins with >0 counts | Bins with >2000 counts | High rate bins dominated by noise | Noise dominated (total time) | Noise dominated (detector-on time) | Marked lightcurve |
|---|---|---|---|---|---|---|---|
| A | 7065 | 5244 | 10 | 10 | 0.14% | 0.19% | 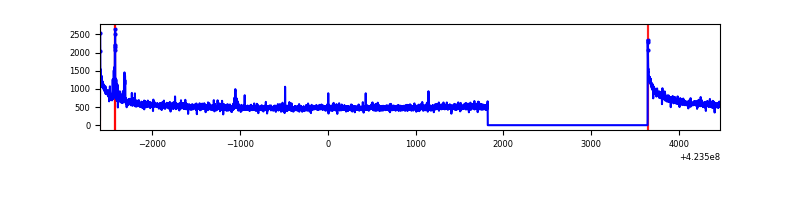 |
| B | 7065 | 5244 | 12 | 12 | 0.17% | 0.23% | 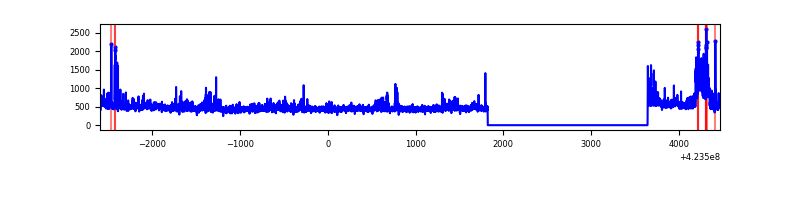 |
| C | 7065 | 5244 | 223 | 223 | 3.16% | 4.25% | 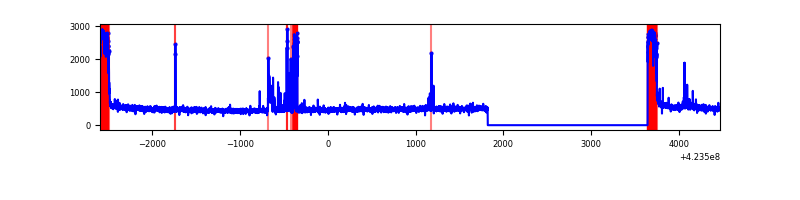 |
| D | 7065 | 5244 | 214 | 214 | 3.03% | 4.08% | 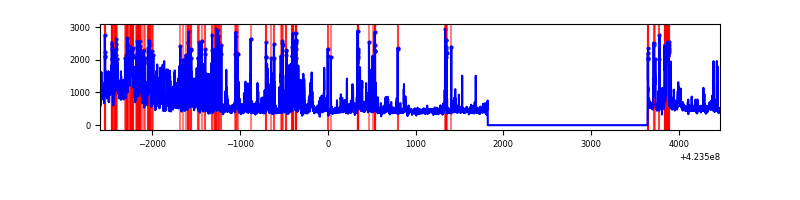 |
Top three noisy pixels from each quadrant. If the there are fewer than three noisy pixels in the level2.evt file, extra rows are filled as -1
| Pixel properties | Quadrant properties | ||||||
|---|---|---|---|---|---|---|---|
| Quadrant | DetID | PixID | Counts | Sigma | Mean | Median | Sigma |
| A | 10 | 83 | 533699 | 4331.44 | 599 | 587 | 123.1 |
| A | 13 | 248 | 29914 | 238.28 | 599 | 587 | 123.1 |
| A | 13 | 6 | 11935 | 92.2 | 599 | 587 | 123.1 |
| B | 0 | 190 | 149572 | 1305.71 | 594 | 578 | 114.1 |
| B | 0 | 186 | 133738 | 1166.95 | 594 | 578 | 114.1 |
| B | 0 | 245 | 27239 | 233.64 | 594 | 578 | 114.1 |
| C | 0 | 10 | 505840 | 3866.43 | 562 | 564 | 130.7 |
| C | 15 | 214 | 224686 | 1715.01 | 562 | 564 | 130.7 |
| C | 14 | 254 | 127651 | 972.48 | 562 | 564 | 130.7 |
| D | 5 | 222 | 656281 | 4765.24 | 573 | 560 | 137.6 |
| D | 12 | 79 | 438649 | 3183.67 | 573 | 560 | 137.6 |
| D | 12 | 217 | 178809 | 1295.37 | 573 | 560 | 137.6 |
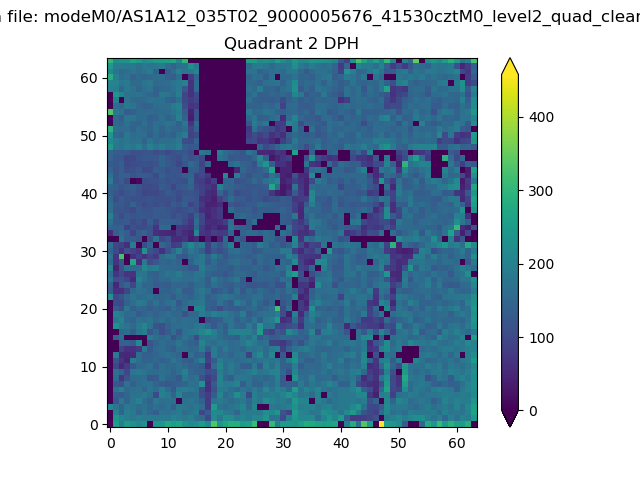
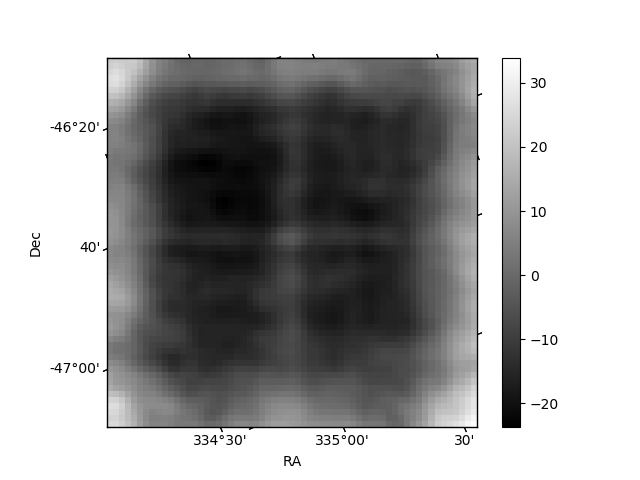
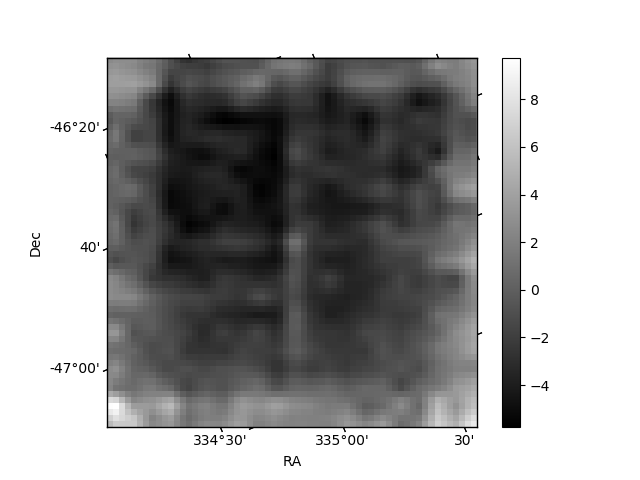
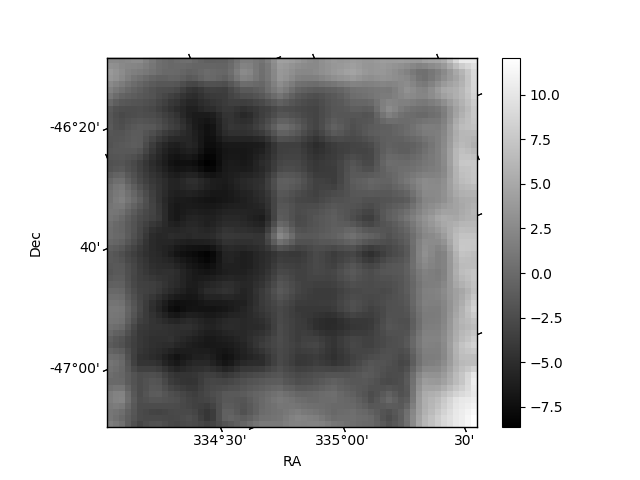
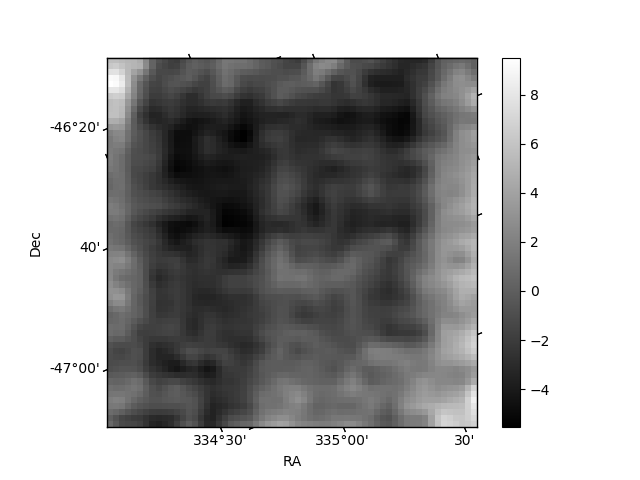
Histogram calculated using DETX and DETY for each event in the final _common_clean file
| Quadrant A | 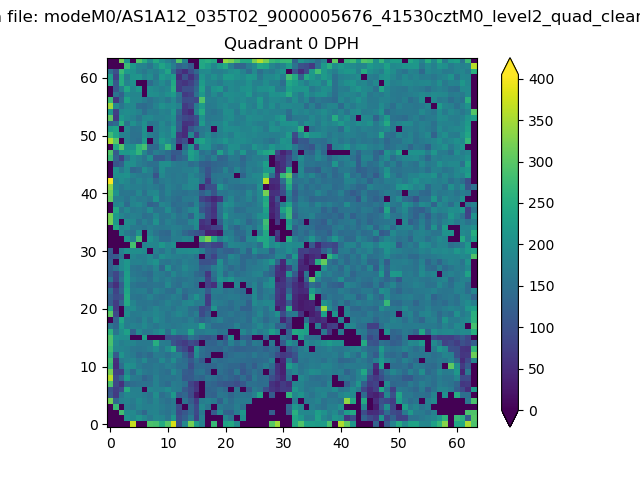 |
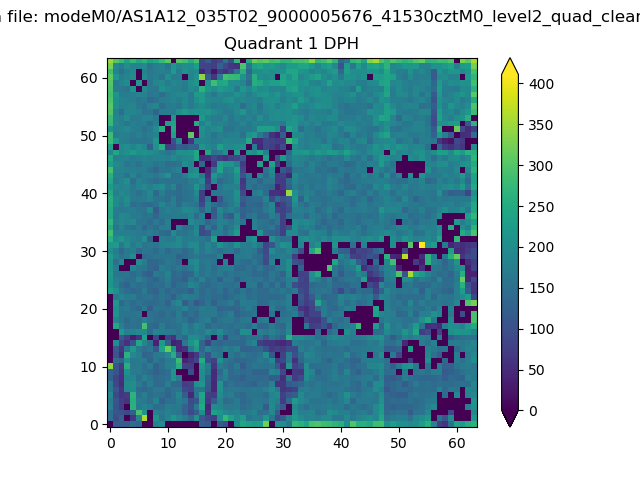 |
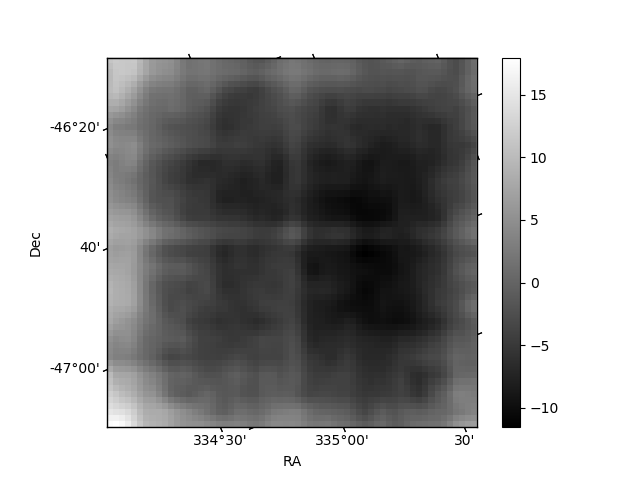
Quadrant B |
|---|---|---|---|
| Quadrant D | 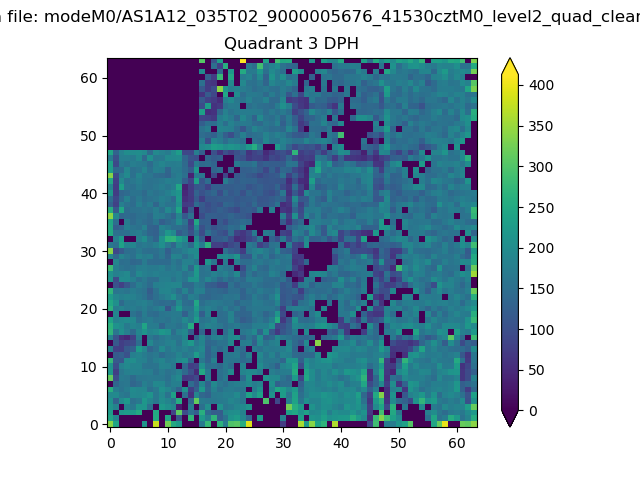 |
 |
Quadrant C |
| Plot type | Count rate plots | Images |
|---|---|---|
| Comparison with Poisson distribution Blue bars denote a histogram of data divided into 1 sec bins. Red curve is a Poisson curve with rate = median count rate of data. |
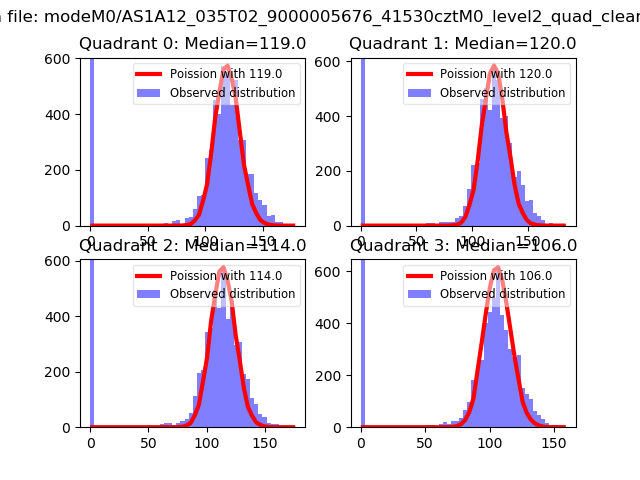 |
 |
| Quadrant-wise count rates Data is divided into 100 sec bins |
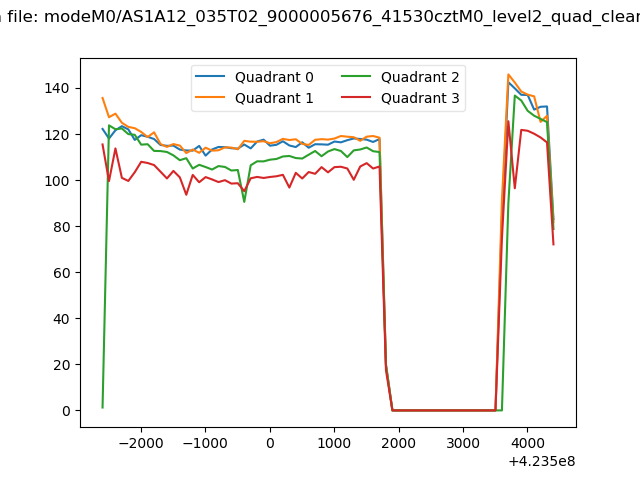 |
|
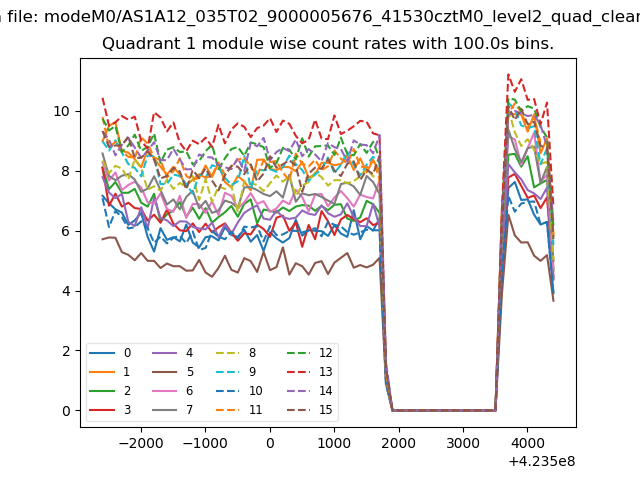
| Module-wise count rates for Quadrant A Data is divided into 100 sec bins |
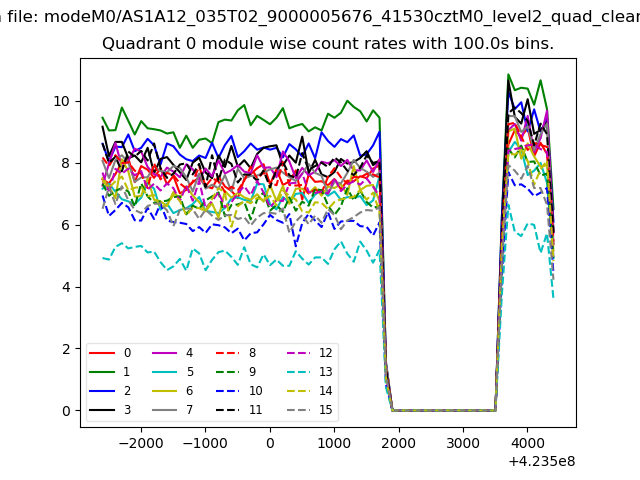 |
 |
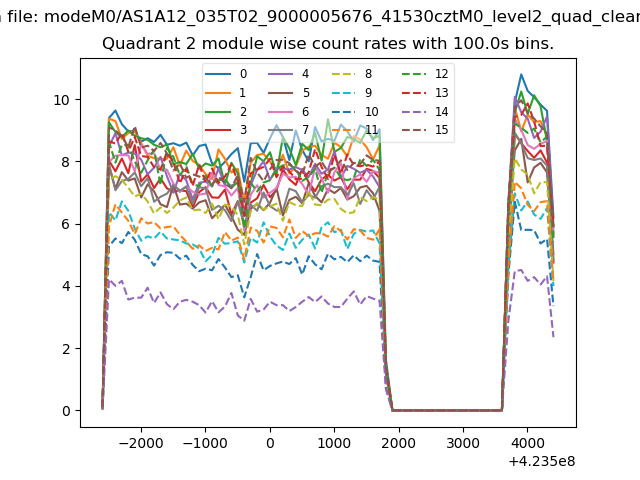
| Module-wise count rates for Quadrant B Data is divided into 100 sec bins |
 |
 |
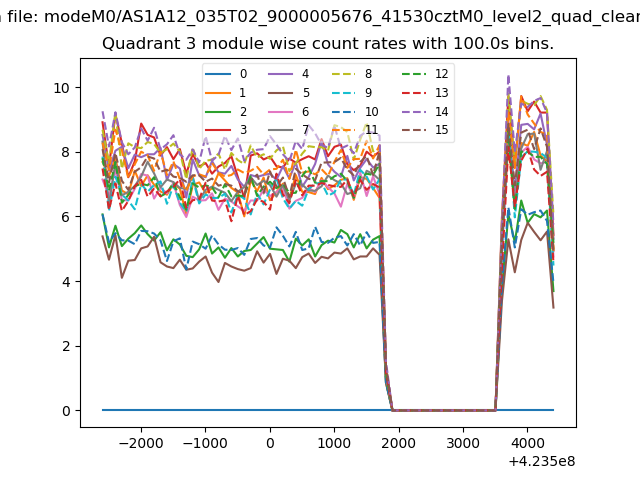
| Module-wise count rates for Quadrant C Data is divided into 100 sec bins |
 |
 |
| Module-wise count rates for Quadrant D Data is divided into 100 sec bins |
 |
 |
| Parameter | Plot |
|---|---|
| CZT HV Monitor | 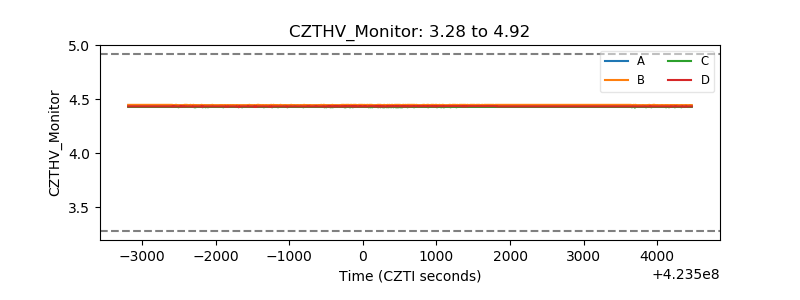 |
| D_VDD | 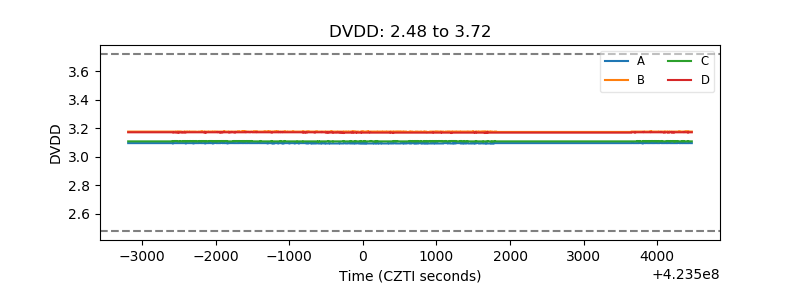 |
| Temperature 1 |  |
| Veto HV Monitor | 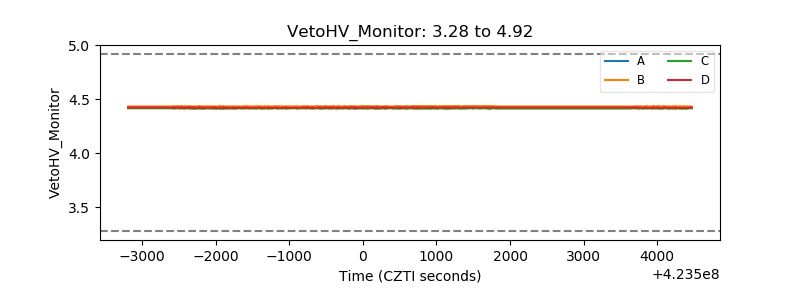 |
| Veto LLD | 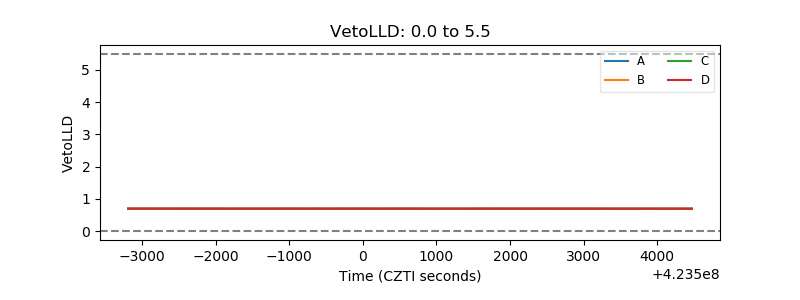 |
| Alpha Counter | 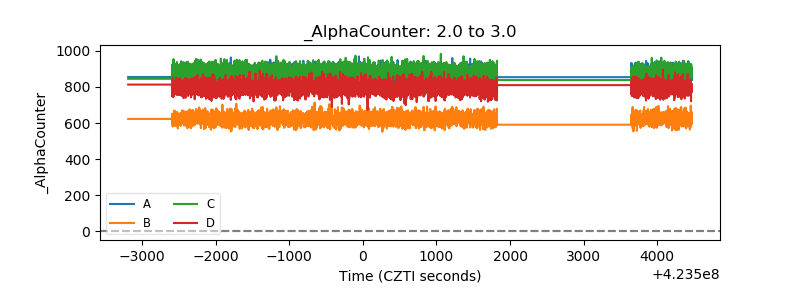 |
| _CPM_Rate | 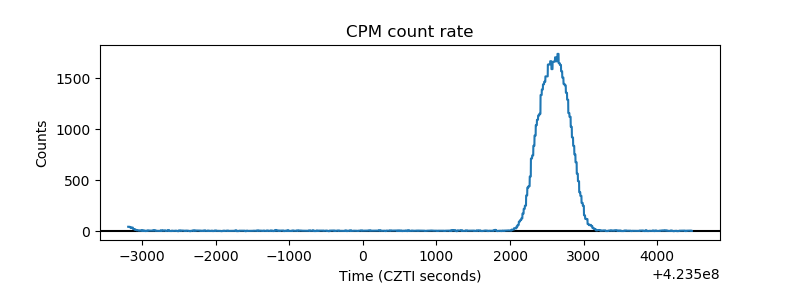 |
| CZT Counter | 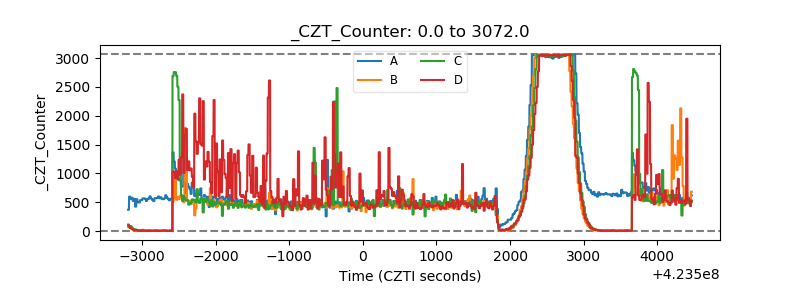 |
| +2.5 Volts monitor | 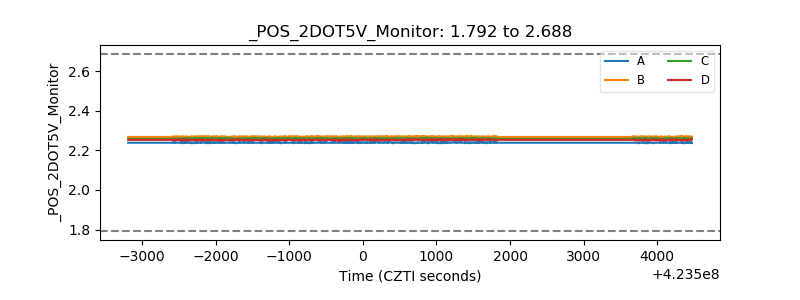 |
| +5 Volts monitor | 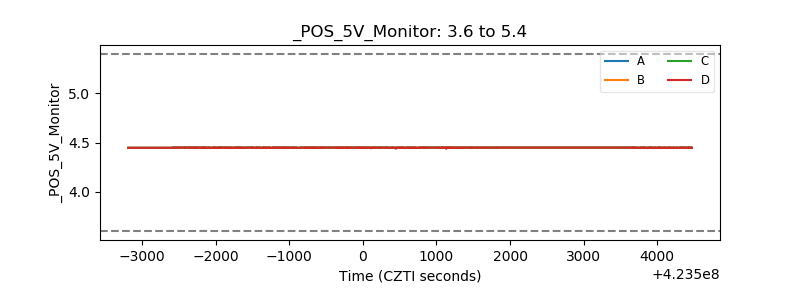 |
| _ROLL_ROT | 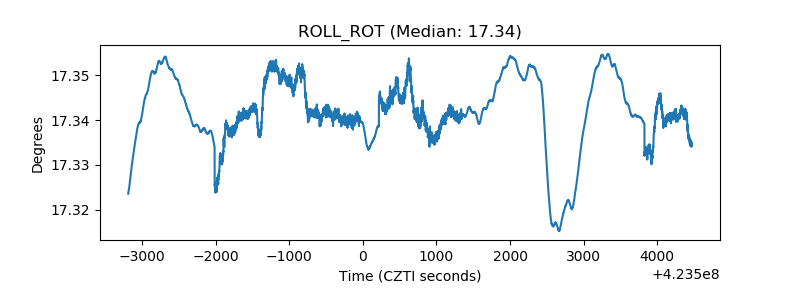 |
| _Roll_DEC | 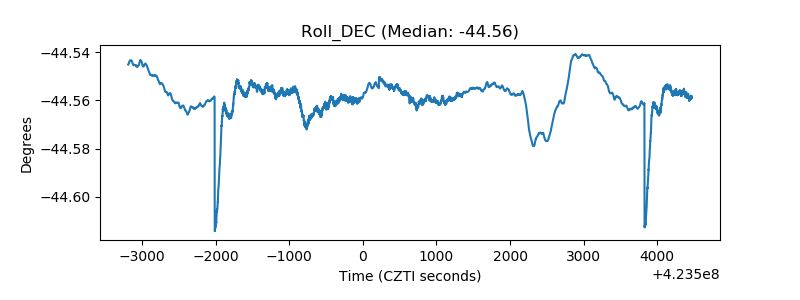 |
| _Roll_RA | 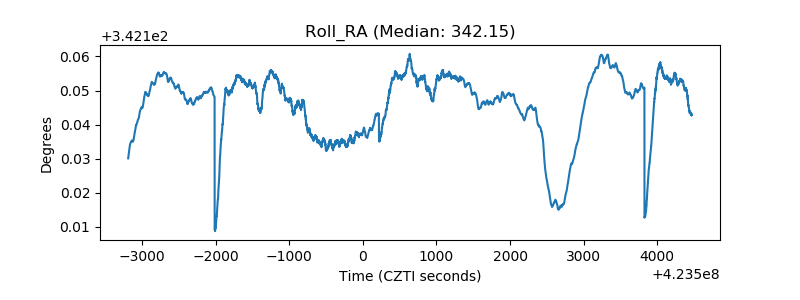 |
| Veto Counter | 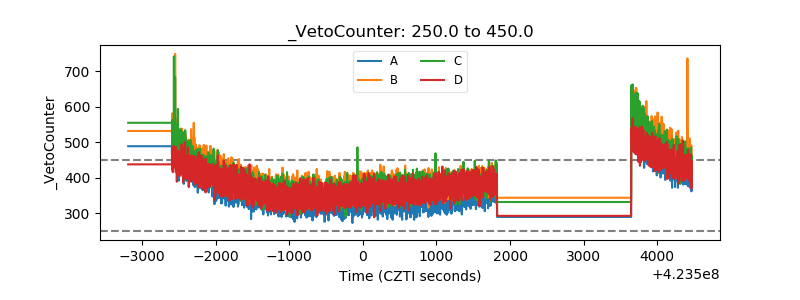 |