| Param | Original file | Final file |
|---|---|---|
| Filename | modeM0/AS1A12_035T02_9000005676_41531cztM0_level2.fits | modeM0/AS1A12_035T02_9000005676_41531cztM0_level2_quad_clean.evt |
| Size (bytes) | 332,847,360 | 94,412,160 |
| Size | 317.4 MB | 90.0 MB |
| Events in quadrant A | 2,917,341 | 658,428 |
| Events in quadrant B | 2,797,641 | 666,697 |
| Events in quadrant C | 3,173,331 | 596,006 |
| Events in quadrant D | 3,029,623 | 575,692 |
| Mode SS | |||
|---|---|---|---|
| Quadrant | BADHDUFLAG | Total packets | Discarded packets |
| A | 0 | 104 | 0 |
| B | 0 | 104 | 0 |
| C | 0 | 104 | 0 |
| D | 0 | 104 | 0 |
| Mode M0 | |||
|---|---|---|---|
| Quadrant | BADHDUFLAG | Total packets | Discarded packets |
| A | 0 | 11809 | 3 |
| B | 0 | 11701 | 2 |
| C | 0 | 12461 | 2 |
| D | 0 | 12445 | 2 |
| Mode M9 | |||
|---|---|---|---|
| Quadrant | BADHDUFLAG | Total packets | Discarded packets |
| A | 0 | 26 | 0 |
| B | 0 | 26 | 0 |
| C | 0 | 26 | 0 |
| D | 0 | 27 | 0 |
| Quadrant | Total seconds | Saturated seconds | Saturation percentage |
|---|---|---|---|
| A | 5174 | 23 | 0.444530% |
| B | 5174 | 44 | 0.850406% |
| C | 5174 | 222 | 4.290684% |
| D | 5174 | 113 | 2.183997% |
Noise dominated data is calculated using 1-second bins in cleaned event files. If a bin has >2000 counts, and if more than 50% of those come from <1% of pixels, then it is considered to be noise-dominated and hence unusable.
| Quadrant | # 1 sec bins | Bins with >0 counts | Bins with >2000 counts | High rate bins dominated by noise | Noise dominated (total time) | Noise dominated (detector-on time) | Marked lightcurve |
|---|---|---|---|---|---|---|---|
| A | 7116 | 5175 | 6 | 6 | 0.08% | 0.12% | 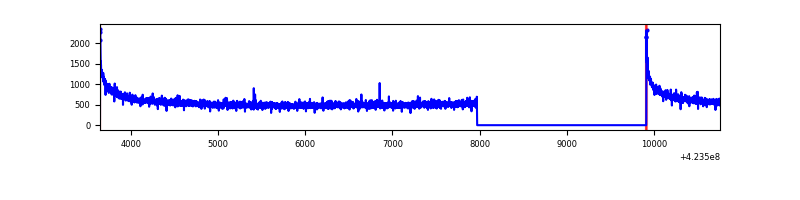 |
| B | 7116 | 5175 | 18 | 18 | 0.25% | 0.35% | 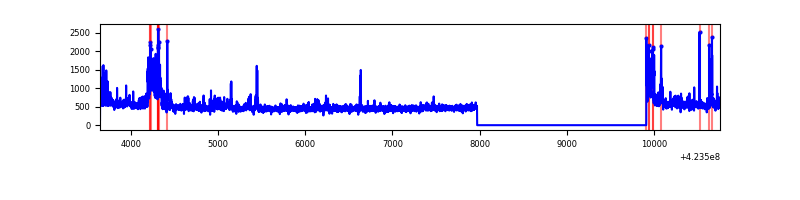 |
| C | 7116 | 5175 | 217 | 217 | 3.05% | 4.19% | 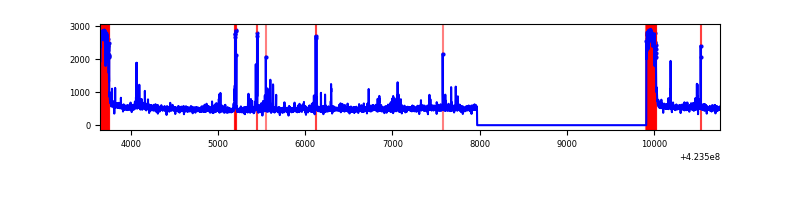 |
| D | 7116 | 5175 | 113 | 113 | 1.59% | 2.18% | 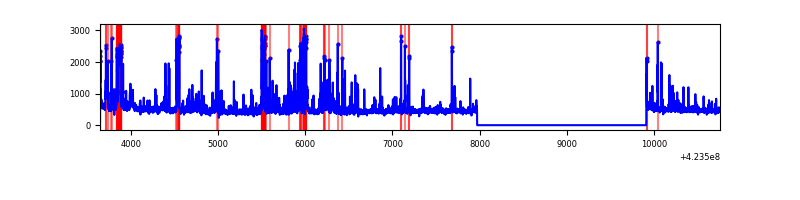 |
Top three noisy pixels from each quadrant. If the there are fewer than three noisy pixels in the level2.evt file, extra rows are filled as -1
| Pixel properties | Quadrant properties | ||||||
|---|---|---|---|---|---|---|---|
| Quadrant | DetID | PixID | Counts | Sigma | Mean | Median | Sigma |
| A | 10 | 83 | 523947 | 4172.2 | 613 | 602 | 125.4 |
| A | 2 | 79 | 9837 | 73.62 | 613 | 602 | 125.4 |
| A | 13 | 254 | 9449 | 70.53 | 613 | 602 | 125.4 |
| B | 0 | 186 | 179077 | 1556.78 | 608 | 593 | 114.6 |
| B | 0 | 190 | 142036 | 1233.7 | 608 | 593 | 114.6 |
| B | 5 | 255 | 42763 | 367.82 | 608 | 593 | 114.6 |
| C | 0 | 10 | 533048 | 4016.61 | 574 | 580 | 132.6 |
| C | 15 | 214 | 220978 | 1662.55 | 574 | 580 | 132.6 |
| C | 14 | 254 | 155404 | 1167.9 | 574 | 580 | 132.6 |
| D | 5 | 222 | 184367 | 1295.24 | 587 | 571 | 141.9 |
| D | 1 | 47 | 125917 | 883.34 | 587 | 571 | 141.9 |
| D | 12 | 233 | 101149 | 708.79 | 587 | 571 | 141.9 |
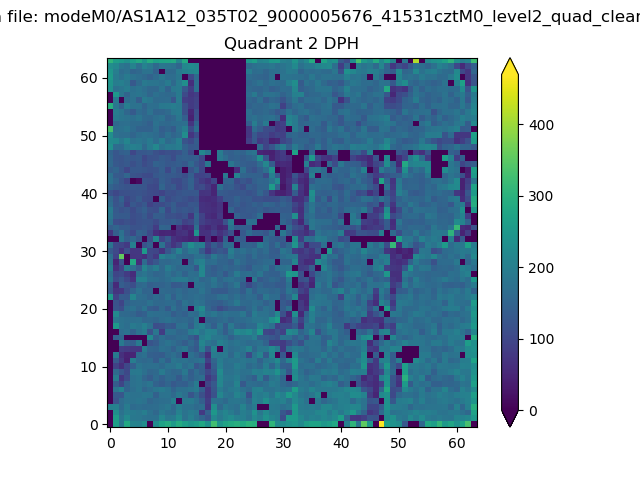
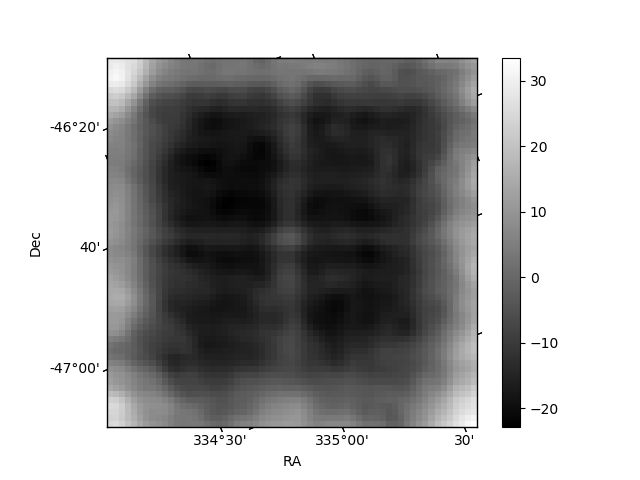
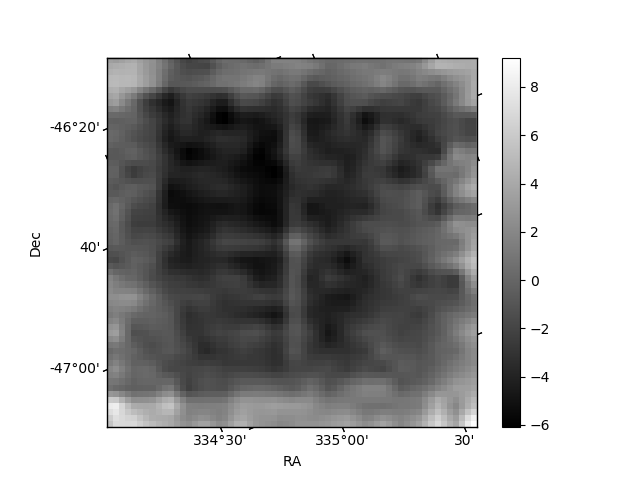
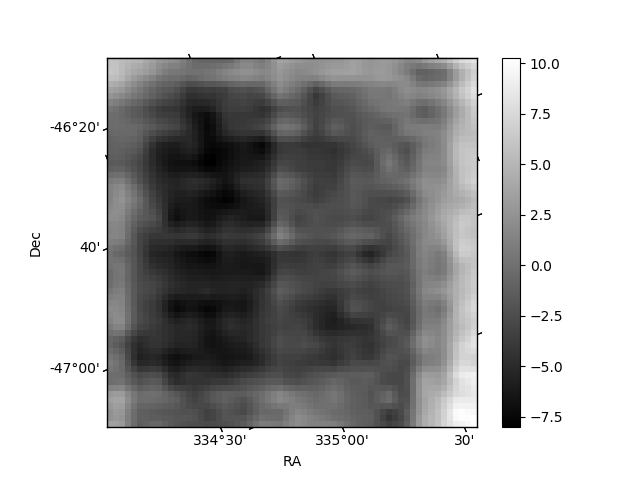
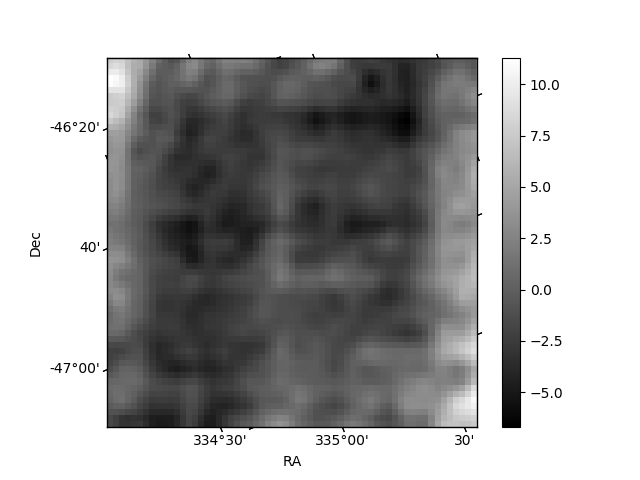
Histogram calculated using DETX and DETY for each event in the final _common_clean file
| Quadrant A | 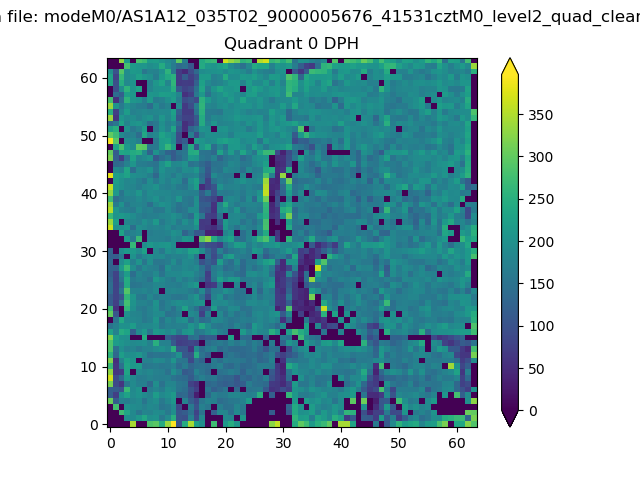 |
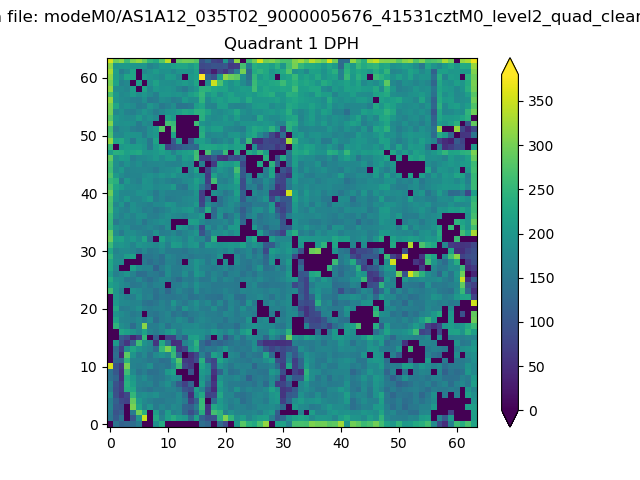 |
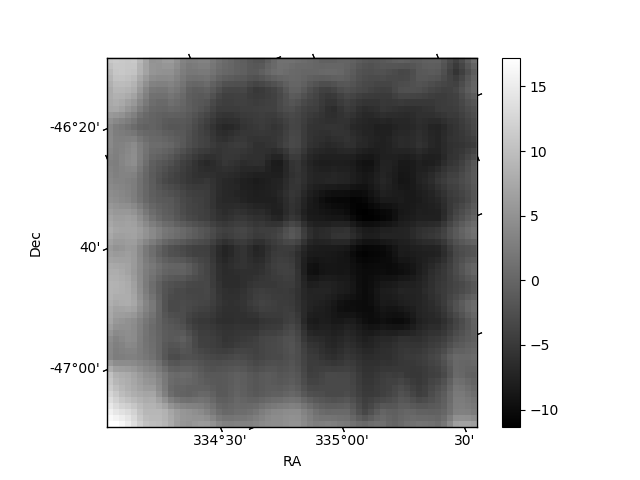
Quadrant B |
|---|---|---|---|
| Quadrant D | 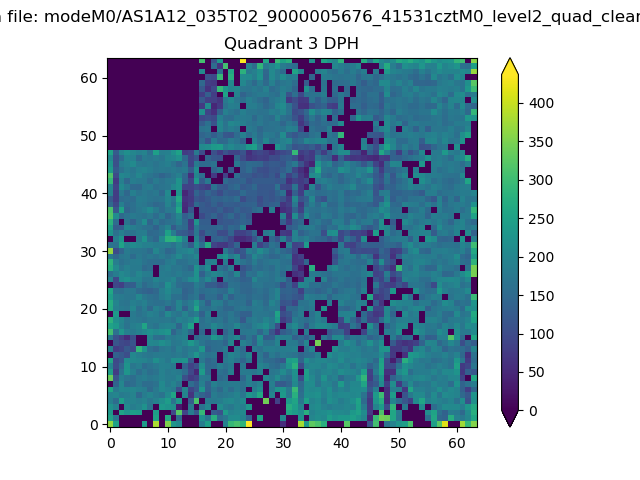 |
 |
Quadrant C |
| Plot type | Count rate plots | Images |
|---|---|---|
| Comparison with Poisson distribution Blue bars denote a histogram of data divided into 1 sec bins. Red curve is a Poisson curve with rate = median count rate of data. |
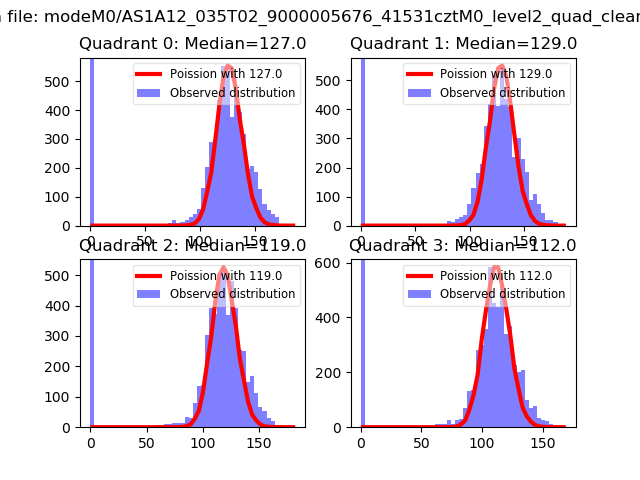 |
 |
| Quadrant-wise count rates Data is divided into 100 sec bins |
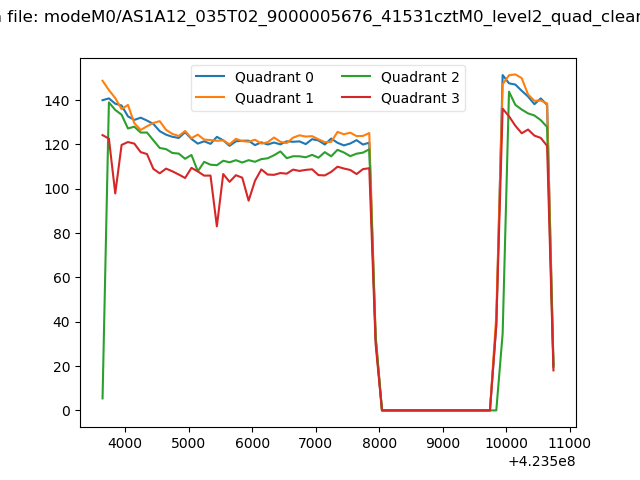 |
|
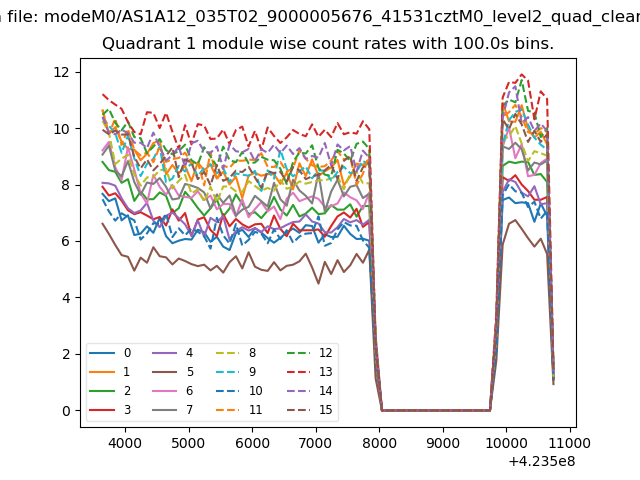
| Module-wise count rates for Quadrant A Data is divided into 100 sec bins |
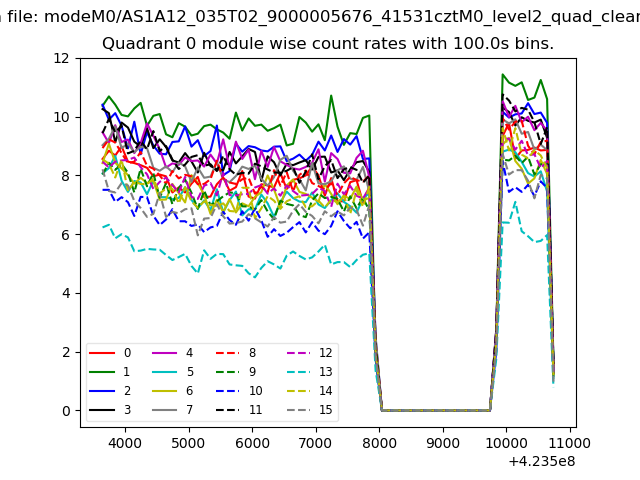 |
 |
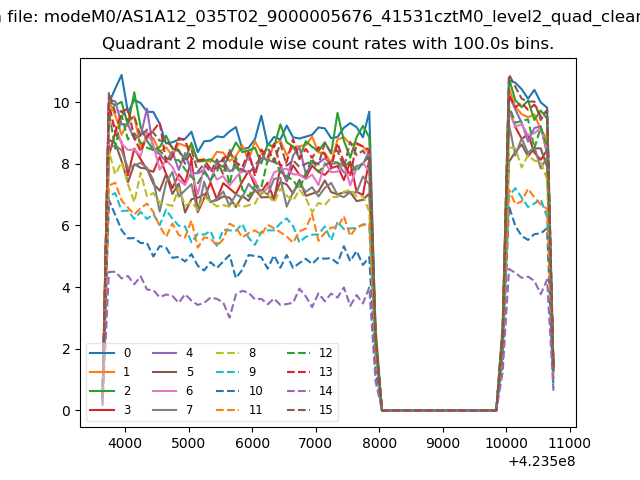
| Module-wise count rates for Quadrant B Data is divided into 100 sec bins |
 |
 |
| Module-wise count rates for Quadrant C Data is divided into 100 sec bins |
 |
 |
| Module-wise count rates for Quadrant D Data is divided into 100 sec bins |
 |
 |
| Parameter | Plot |
|---|---|
| CZT HV Monitor | 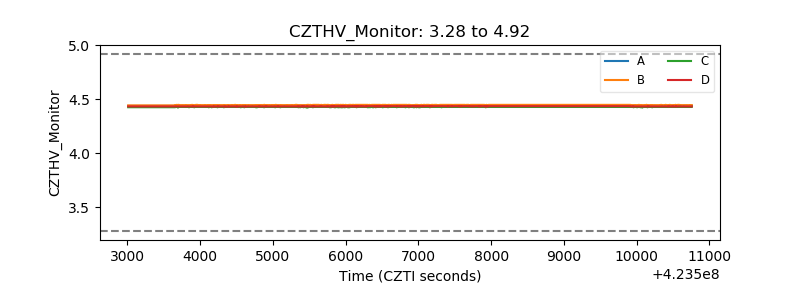 |
| D_VDD | 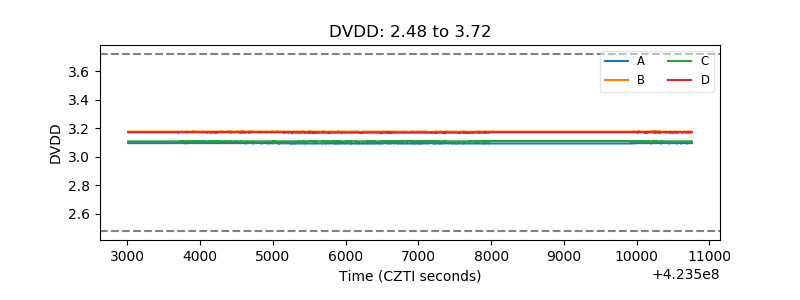 |
| Temperature 1 | 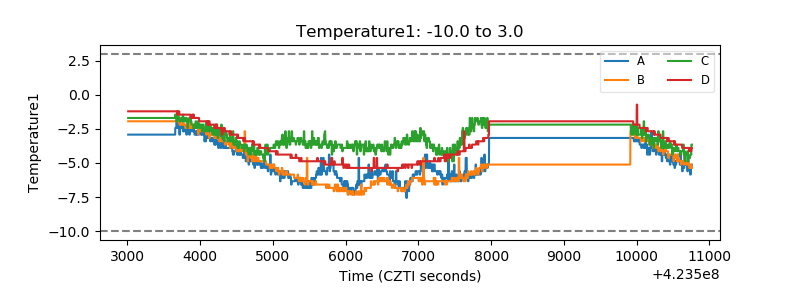 |
| Veto HV Monitor | 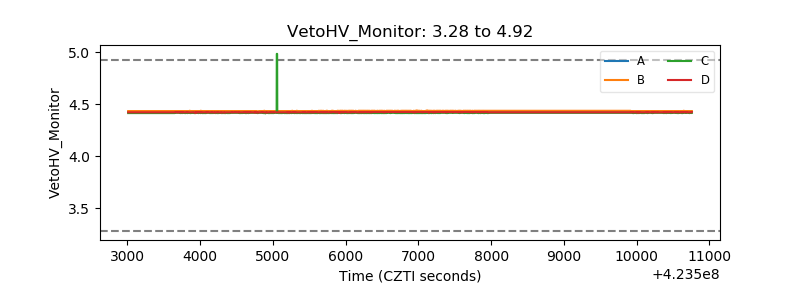 |
| Veto LLD | 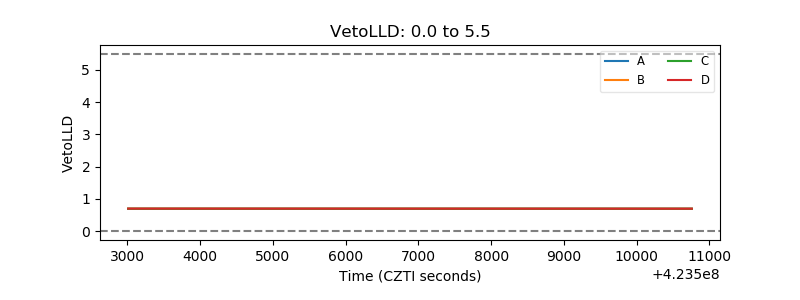 |
| Alpha Counter | 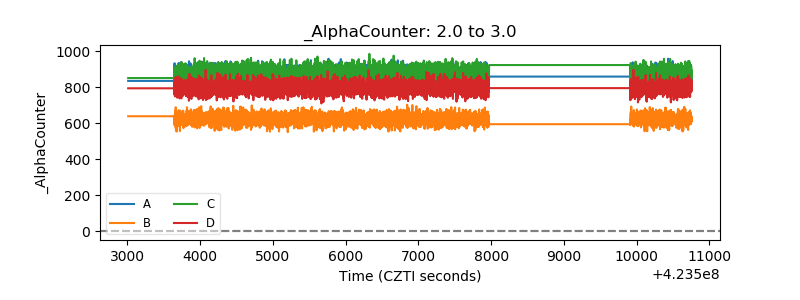 |
| _CPM_Rate | 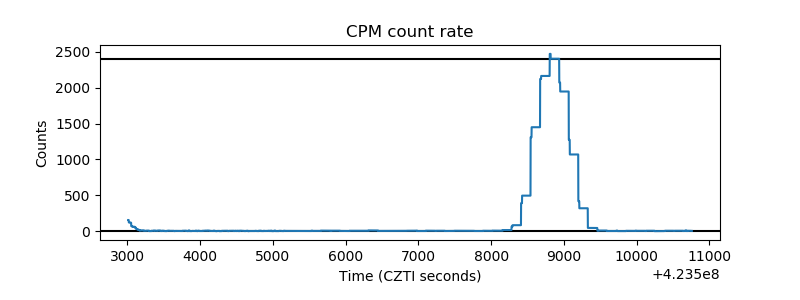 |
| CZT Counter | 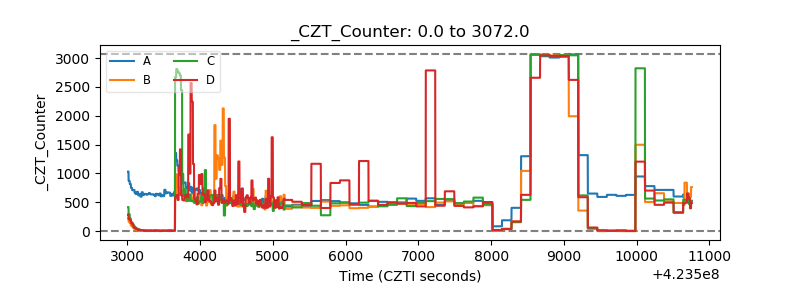 |
| +2.5 Volts monitor | 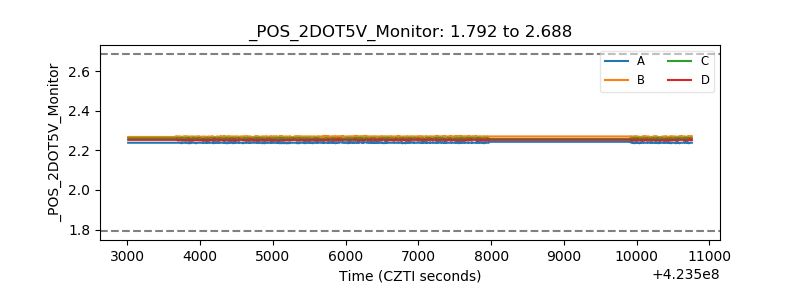 |
| +5 Volts monitor | 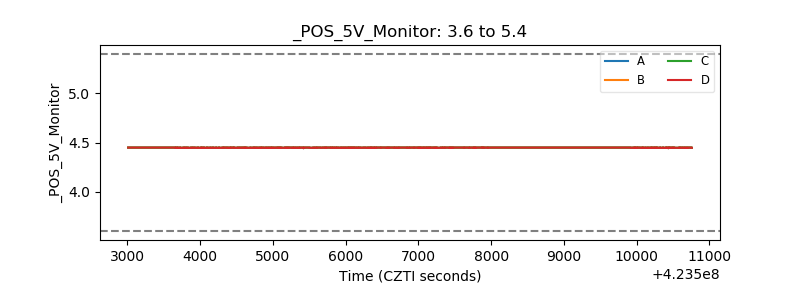 |
| _ROLL_ROT | 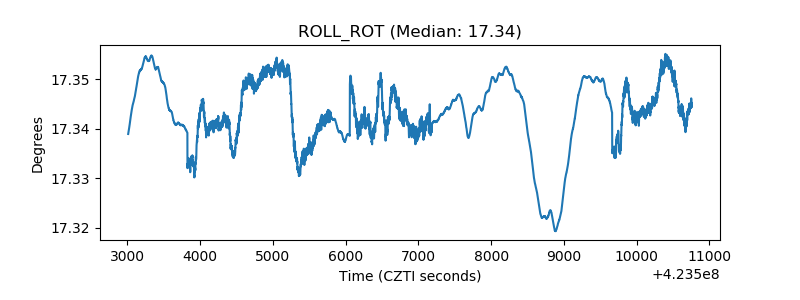 |
| _Roll_DEC | 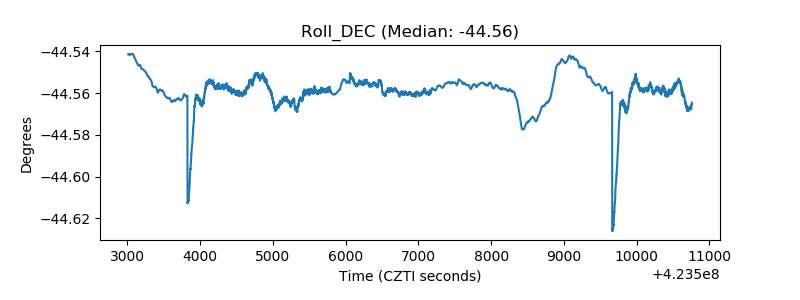 |
| _Roll_RA | 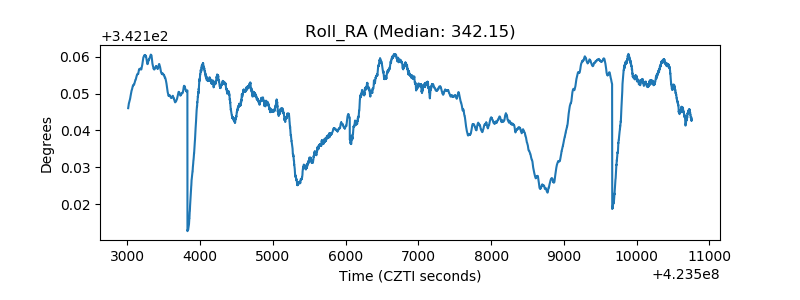 |
| Veto Counter | 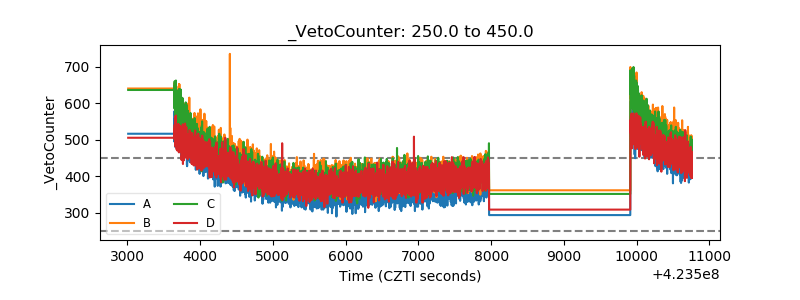 |