| Param | Original file | Final file |
|---|---|---|
| Filename | modeM0/AS1A12_035T02_9000005676_41532cztM0_level2.fits | modeM0/AS1A12_035T02_9000005676_41532cztM0_level2_quad_clean.evt |
| Size (bytes) | 314,012,160 | 91,615,680 |
| Size | 299.5 MB | 87.4 MB |
| Events in quadrant A | 2,843,389 | 641,262 |
| Events in quadrant B | 2,649,689 | 649,764 |
| Events in quadrant C | 3,140,376 | 574,703 |
| Events in quadrant D | 2,608,539 | 565,151 |
| Mode SS | |||
|---|---|---|---|
| Quadrant | BADHDUFLAG | Total packets | Discarded packets |
| A | 0 | 100 | 0 |
| B | 0 | 100 | 0 |
| C | 0 | 100 | 0 |
| D | 0 | 100 | 0 |
| Mode M0 | |||
|---|---|---|---|
| Quadrant | BADHDUFLAG | Total packets | Discarded packets |
| A | 0 | 11391 | 3 |
| B | 0 | 10943 | 2 |
| C | 0 | 12133 | 2 |
| D | 0 | 10962 | 2 |
| Mode M9 | |||
|---|---|---|---|
| Quadrant | BADHDUFLAG | Total packets | Discarded packets |
| A | 0 | 22 | 0 |
| B | 0 | 22 | 0 |
| C | 0 | 22 | 0 |
| D | 0 | 23 | 0 |
| Quadrant | Total seconds | Saturated seconds | Saturation percentage |
|---|---|---|---|
| A | 4896 | 21 | 0.428922% |
| B | 4896 | 47 | 0.959967% |
| C | 4896 | 251 | 5.126634% |
| D | 4896 | 33 | 0.674020% |
Noise dominated data is calculated using 1-second bins in cleaned event files. If a bin has >2000 counts, and if more than 50% of those come from <1% of pixels, then it is considered to be noise-dominated and hence unusable.
| Quadrant | # 1 sec bins | Bins with >0 counts | Bins with >2000 counts | High rate bins dominated by noise | Noise dominated (total time) | Noise dominated (detector-on time) | Marked lightcurve |
|---|---|---|---|---|---|---|---|
| A | 6959 | 4897 | 6 | 6 | 0.09% | 0.12% | 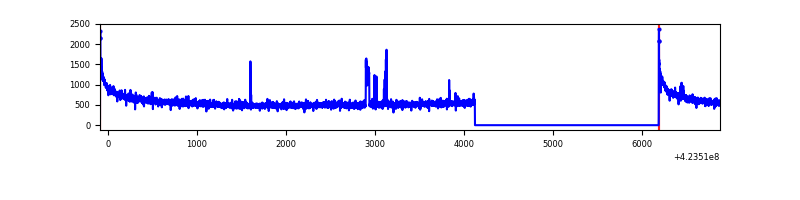 |
| B | 6959 | 4897 | 28 | 28 | 0.40% | 0.57% | 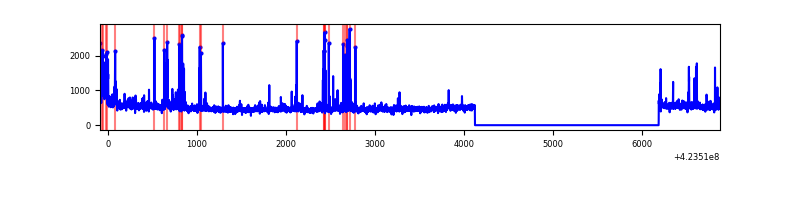 |
| C | 6959 | 4897 | 242 | 242 | 3.48% | 4.94% | 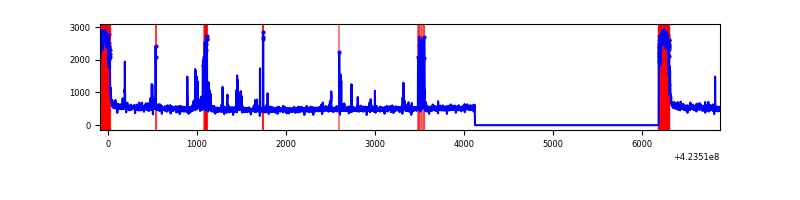 |
| D | 6959 | 4897 | 29 | 29 | 0.42% | 0.59% | 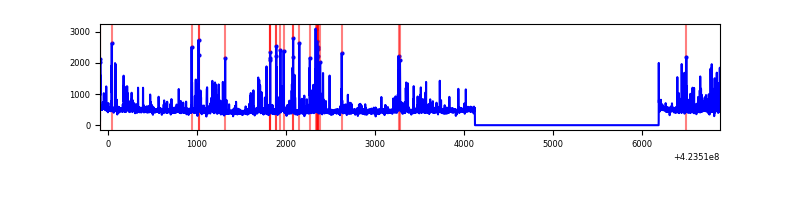 |
Top three noisy pixels from each quadrant. If the there are fewer than three noisy pixels in the level2.evt file, extra rows are filled as -1
| Pixel properties | Quadrant properties | ||||||
|---|---|---|---|---|---|---|---|
| Quadrant | DetID | PixID | Counts | Sigma | Mean | Median | Sigma |
| A | 10 | 83 | 489612 | 4060.76 | 587 | 577 | 120.4 |
| A | 2 | 79 | 70089 | 577.2 | 587 | 577 | 120.4 |
| A | 13 | 6 | 11948 | 94.42 | 587 | 577 | 120.4 |
| B | 5 | 255 | 176368 | 1604.05 | 583 | 569 | 109.6 |
| B | 0 | 186 | 74560 | 675.12 | 583 | 569 | 109.6 |
| B | 0 | 190 | 47125 | 424.79 | 583 | 569 | 109.6 |
| C | 0 | 10 | 585127 | 4614.24 | 550 | 555 | 126.7 |
| C | 15 | 214 | 208906 | 1644.59 | 550 | 555 | 126.7 |
| C | 14 | 254 | 187416 | 1474.96 | 550 | 555 | 126.7 |
| D | 1 | 47 | 110854 | 813.03 | 567 | 553 | 135.7 |
| D | 12 | 6 | 62622 | 457.51 | 567 | 553 | 135.7 |
| D | 2 | 249 | 53567 | 390.77 | 567 | 553 | 135.7 |
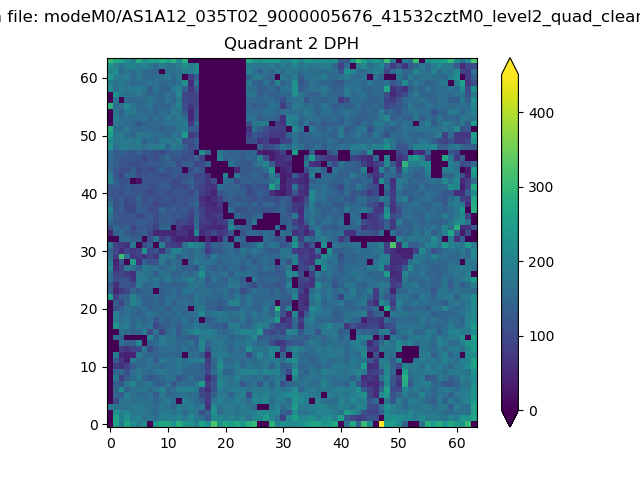
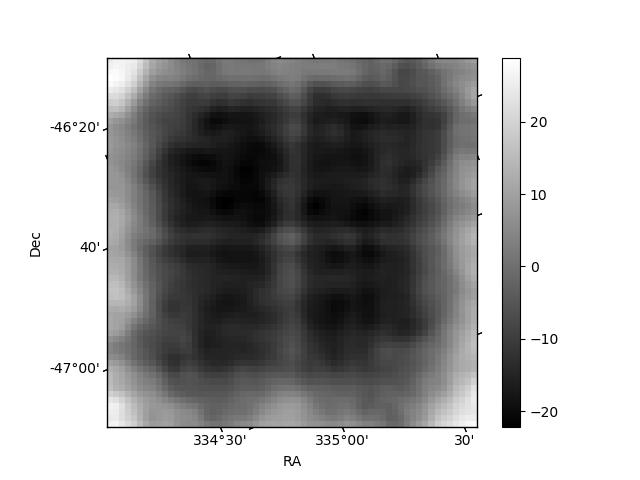
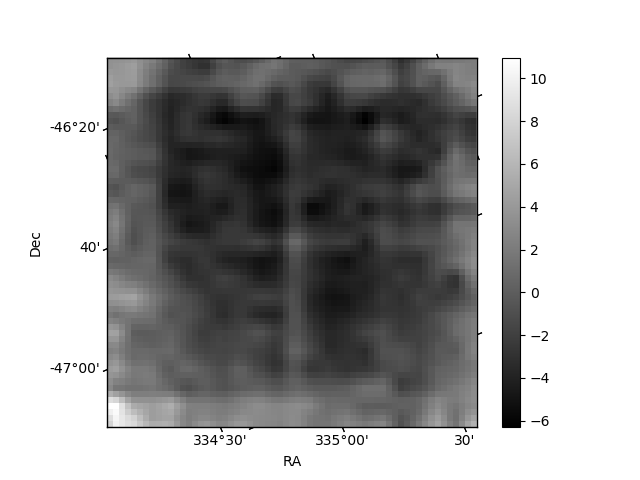
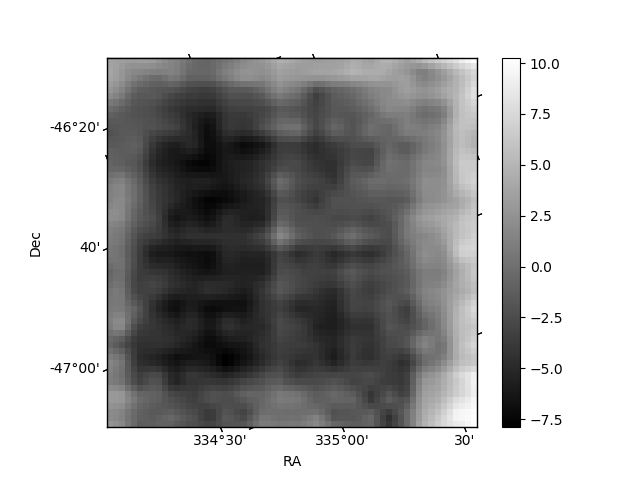
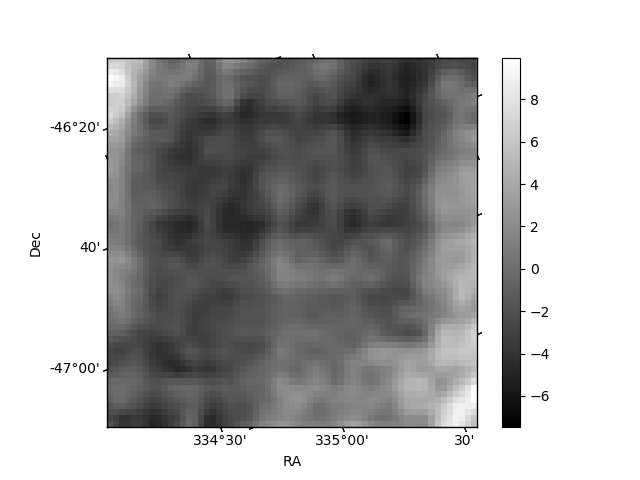
Histogram calculated using DETX and DETY for each event in the final _common_clean file
| Quadrant A | 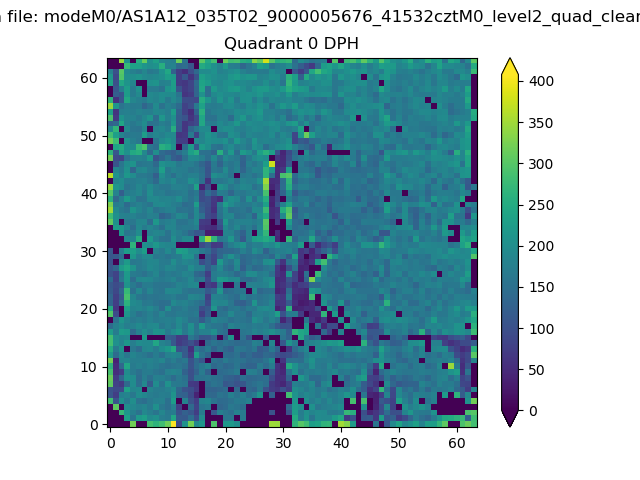 |
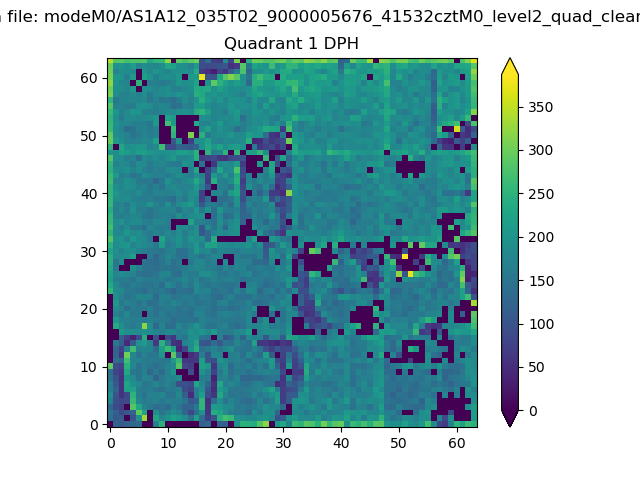 |
Quadrant B |
|---|---|---|---|
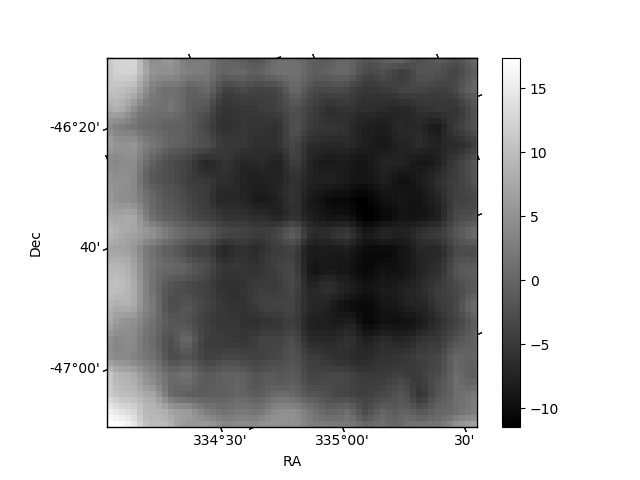
| Quadrant D | 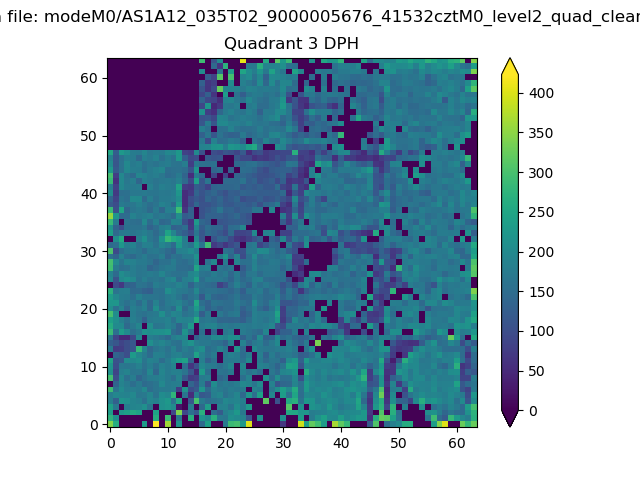 |
 |
Quadrant C |
| Plot type | Count rate plots | Images |
|---|---|---|
| Comparison with Poisson distribution Blue bars denote a histogram of data divided into 1 sec bins. Red curve is a Poisson curve with rate = median count rate of data. |
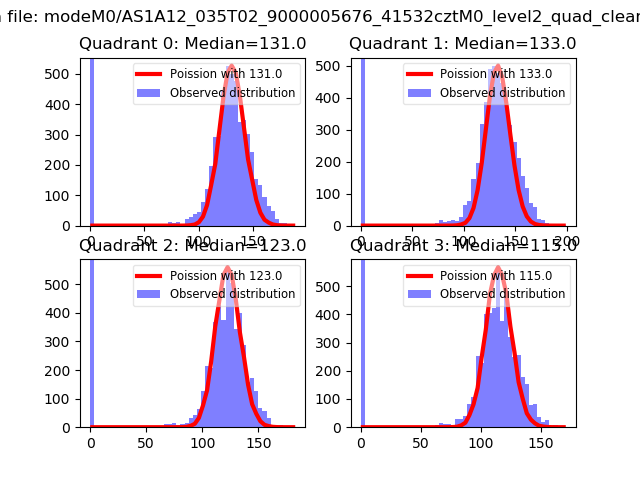 |
 |
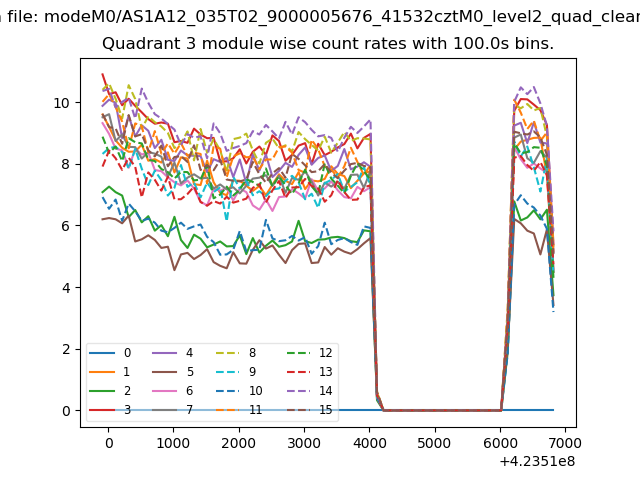
| Quadrant-wise count rates Data is divided into 100 sec bins |
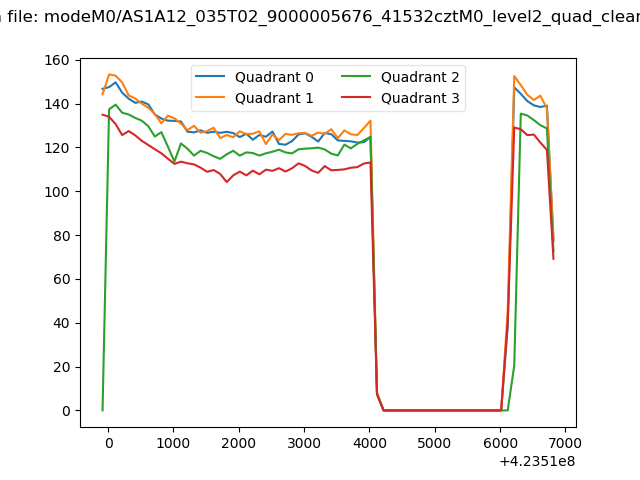 |
|
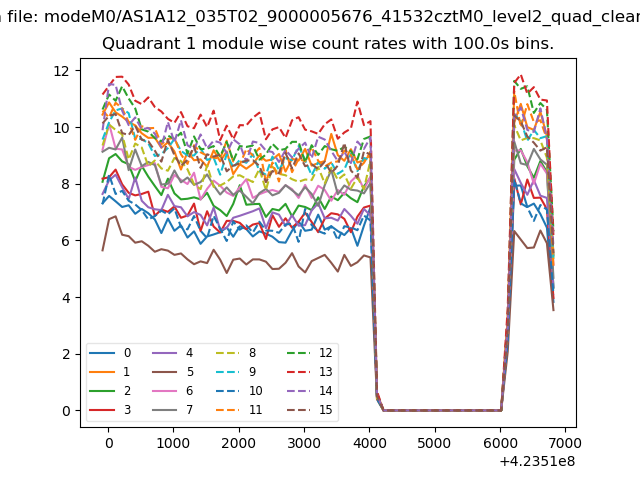
| Module-wise count rates for Quadrant A Data is divided into 100 sec bins |
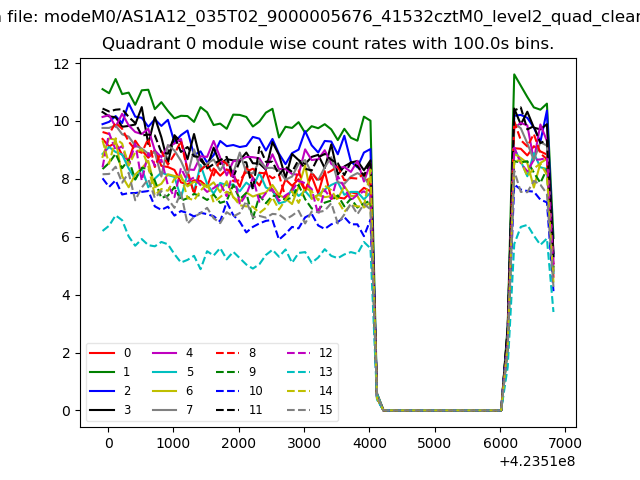 |
 |
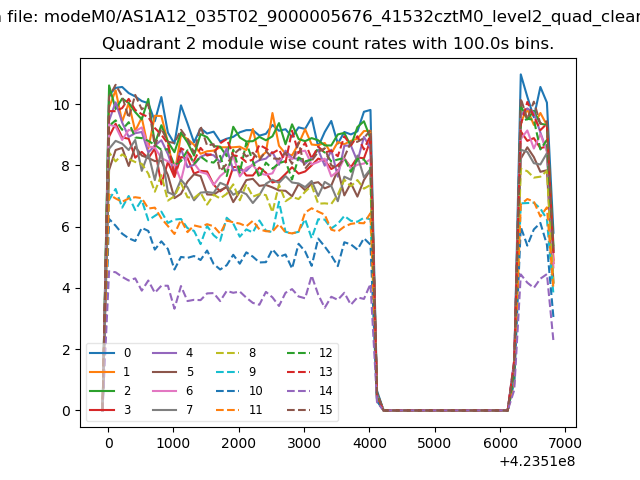
| Module-wise count rates for Quadrant B Data is divided into 100 sec bins |
 |
 |
| Module-wise count rates for Quadrant C Data is divided into 100 sec bins |
 |
 |
| Module-wise count rates for Quadrant D Data is divided into 100 sec bins |
 |
 |
| Parameter | Plot |
|---|---|
| CZT HV Monitor | 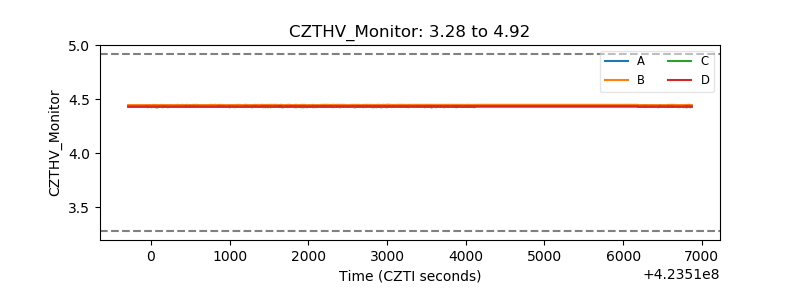 |
| D_VDD | 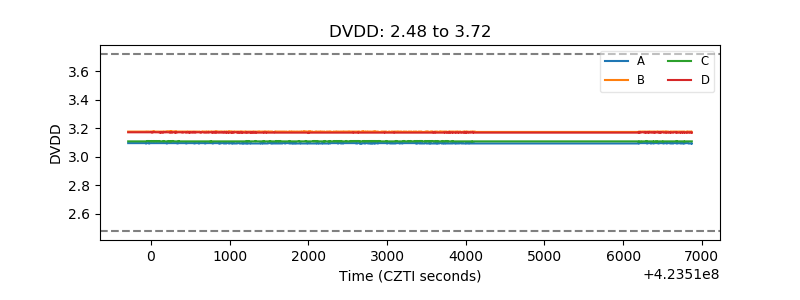 |
| Temperature 1 |  |
| Veto HV Monitor | 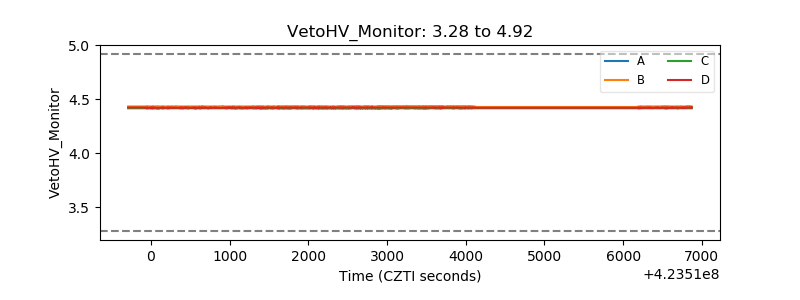 |
| Veto LLD | 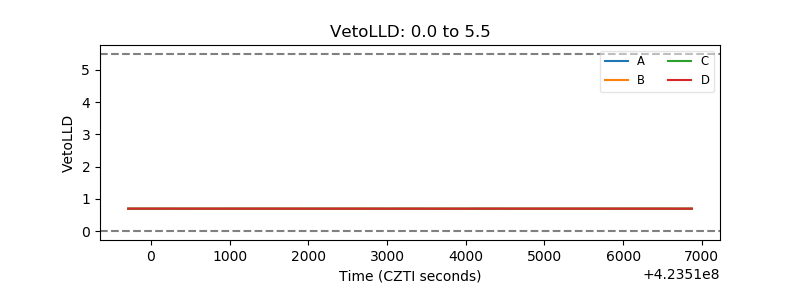 |
| Alpha Counter | 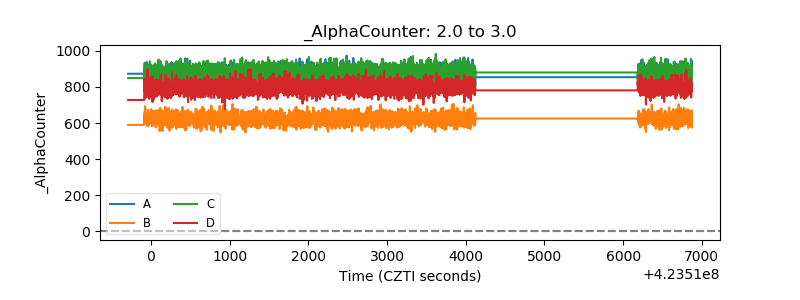 |
| _CPM_Rate | 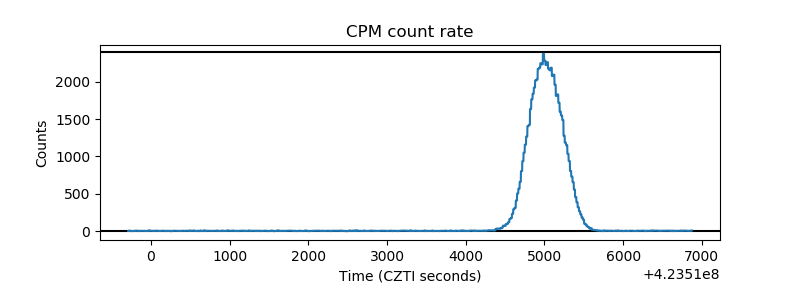 |
| CZT Counter | 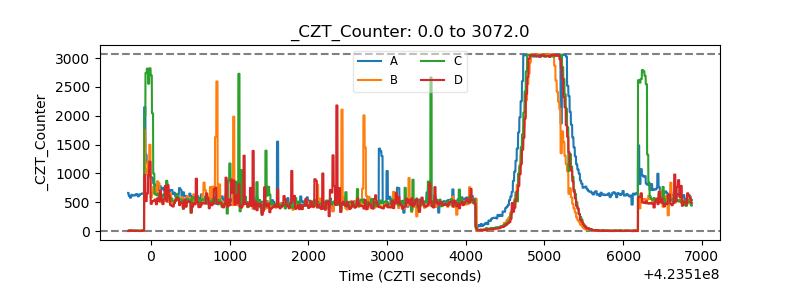 |
| +2.5 Volts monitor | 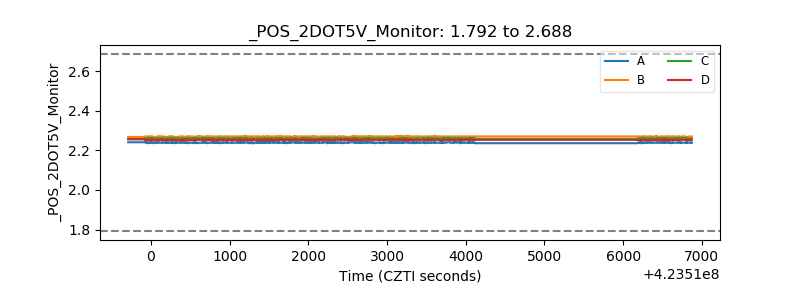 |
| +5 Volts monitor | 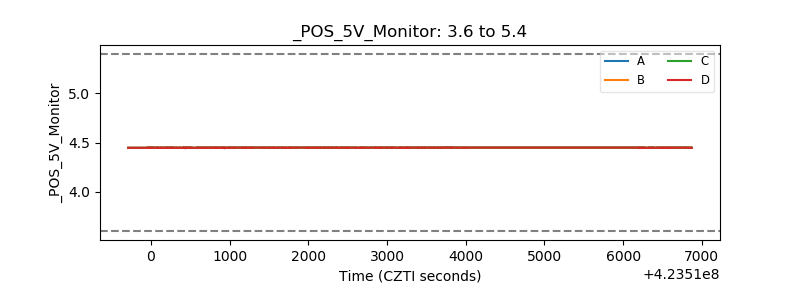 |
| _ROLL_ROT | 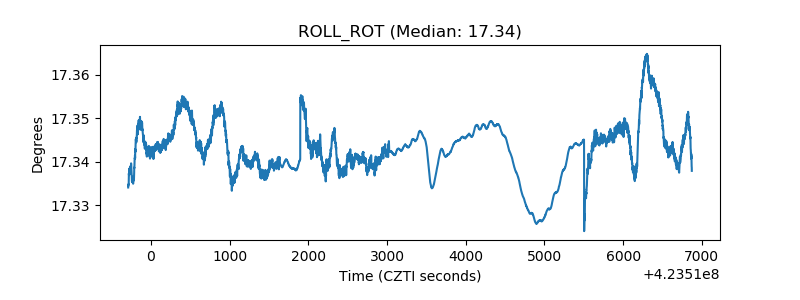 |
| _Roll_DEC | 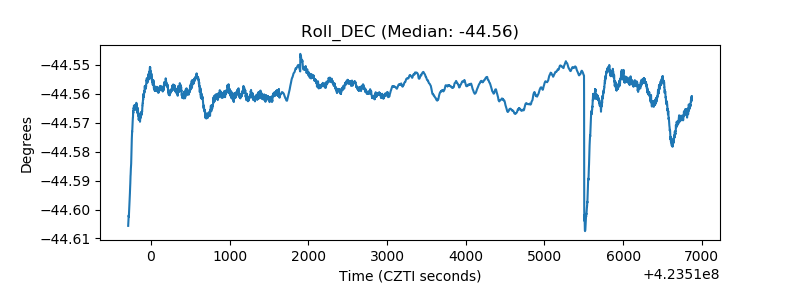 |
| _Roll_RA | 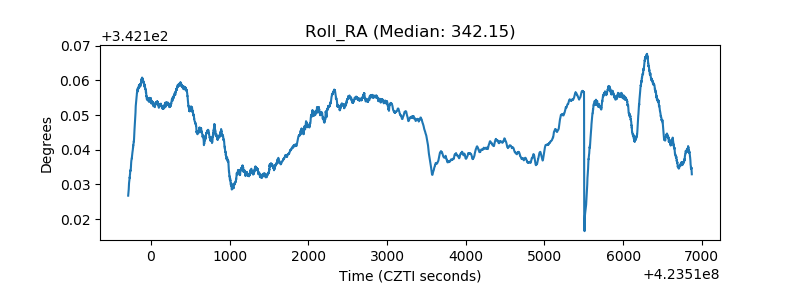 |
| Veto Counter | 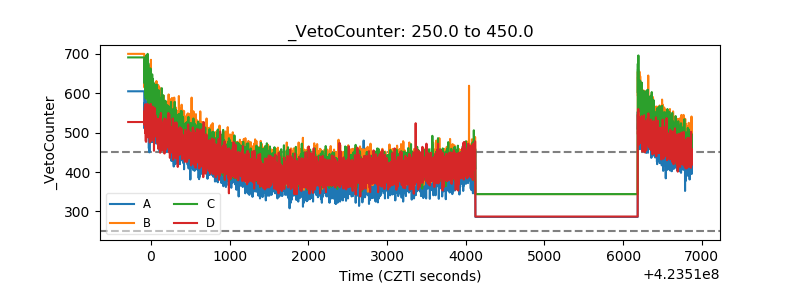 |