| Param | Original file | Final file |
|---|---|---|
| Filename | modeM0/AS1A12_035T02_9000005676_41533cztM0_level2.fits | modeM0/AS1A12_035T02_9000005676_41533cztM0_level2_quad_clean.evt |
| Size (bytes) | 326,952,000 | 89,723,520 |
| Size | 311.8 MB | 85.6 MB |
| Events in quadrant A | 2,814,571 | 625,966 |
| Events in quadrant B | 2,386,286 | 640,830 |
| Events in quadrant C | 3,083,306 | 570,369 |
| Events in quadrant D | 3,436,485 | 535,575 |
| Mode SS | |||
|---|---|---|---|
| Quadrant | BADHDUFLAG | Total packets | Discarded packets |
| A | 0 | 102 | 0 |
| B | 0 | 102 | 0 |
| C | 0 | 102 | 0 |
| D | 0 | 102 | 0 |
| Mode M0 | |||
|---|---|---|---|
| Quadrant | BADHDUFLAG | Total packets | Discarded packets |
| A | 0 | 11330 | 3 |
| B | 0 | 10158 | 2 |
| C | 0 | 12030 | 2 |
| D | 0 | 13471 | 2 |
| Mode M9 | |||
|---|---|---|---|
| Quadrant | BADHDUFLAG | Total packets | Discarded packets |
| A | 0 | 21 | 0 |
| B | 0 | 21 | 0 |
| C | 0 | 21 | 0 |
| D | 0 | 22 | 0 |
| Quadrant | Total seconds | Saturated seconds | Saturation percentage |
|---|---|---|---|
| A | 4903 | 17 | 0.346726% |
| B | 4903 | 10 | 0.203957% |
| C | 4903 | 234 | 4.772588% |
| D | 4903 | 244 | 4.976545% |
Noise dominated data is calculated using 1-second bins in cleaned event files. If a bin has >2000 counts, and if more than 50% of those come from <1% of pixels, then it is considered to be noise-dominated and hence unusable.
| Quadrant | # 1 sec bins | Bins with >0 counts | Bins with >2000 counts | High rate bins dominated by noise | Noise dominated (total time) | Noise dominated (detector-on time) | Marked lightcurve |
|---|---|---|---|---|---|---|---|
| A | 7026 | 4904 | 6 | 6 | 0.09% | 0.12% | 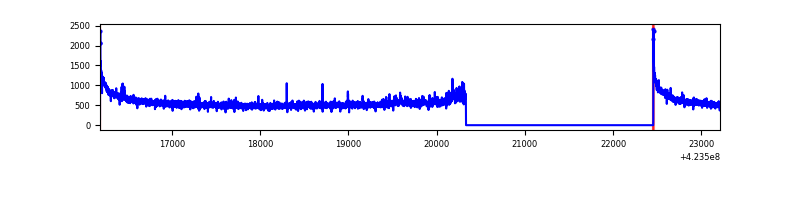 |
| B | 7026 | 4904 | 1 | 1 | 0.01% | 0.02% | 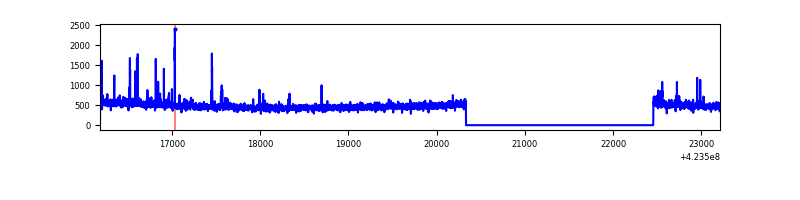 |
| C | 7026 | 4904 | 229 | 229 | 3.26% | 4.67% | 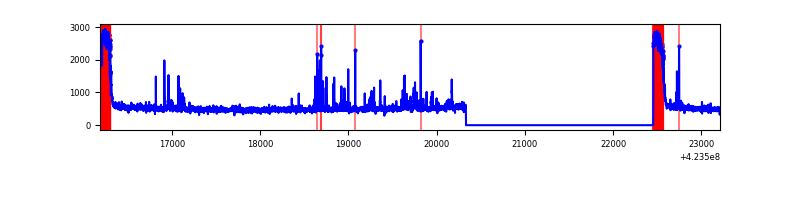 |
| D | 7026 | 4904 | 242 | 242 | 3.44% | 4.93% | 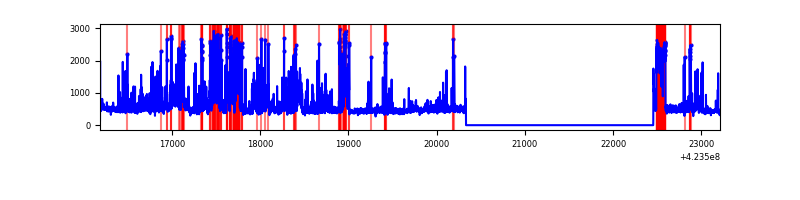 |
Top three noisy pixels from each quadrant. If the there are fewer than three noisy pixels in the level2.evt file, extra rows are filled as -1
| Pixel properties | Quadrant properties | ||||||
|---|---|---|---|---|---|---|---|
| Quadrant | DetID | PixID | Counts | Sigma | Mean | Median | Sigma |
| A | 10 | 83 | 482175 | 4081.22 | 577 | 566 | 118.0 |
| A | 14 | 235 | 68493 | 575.62 | 577 | 566 | 118.0 |
| A | 2 | 79 | 16762 | 137.25 | 577 | 566 | 118.0 |
| B | 0 | 245 | 44200 | 398.25 | 576 | 562 | 109.6 |
| B | 5 | 255 | 24534 | 218.77 | 576 | 562 | 109.6 |
| B | 0 | 189 | 19016 | 168.41 | 576 | 562 | 109.6 |
| C | 0 | 10 | 588262 | 4663.62 | 547 | 551 | 126.0 |
| C | 15 | 214 | 211234 | 1671.82 | 547 | 551 | 126.0 |
| C | 14 | 254 | 142929 | 1129.8 | 547 | 551 | 126.0 |
| D | 12 | 128 | 555151 | 4150.57 | 549 | 534 | 133.6 |
| D | 13 | 249 | 370762 | 2770.66 | 549 | 534 | 133.6 |
| D | 12 | 6 | 181232 | 1352.28 | 549 | 534 | 133.6 |
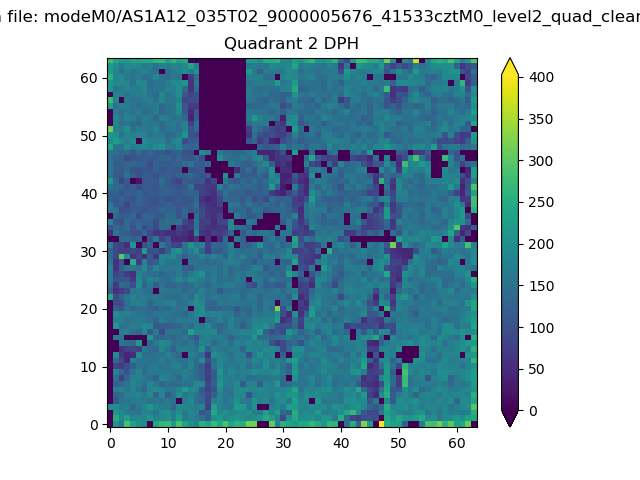
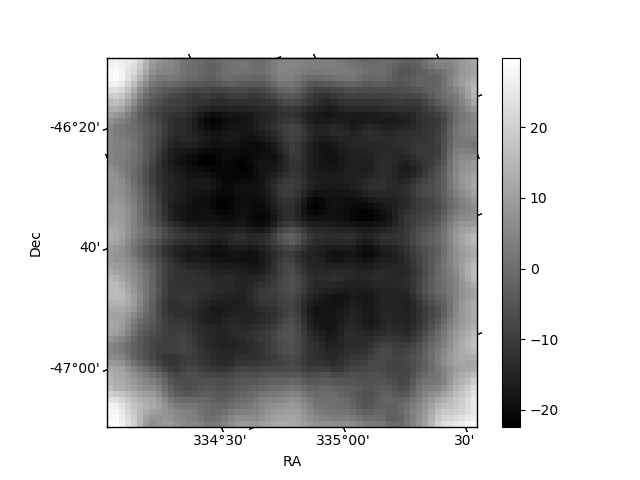
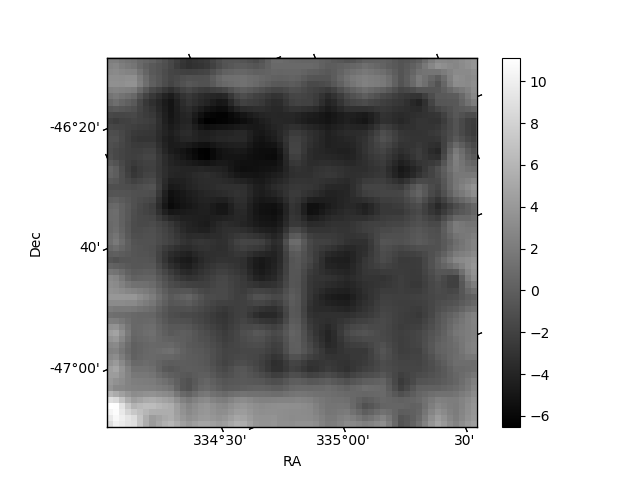
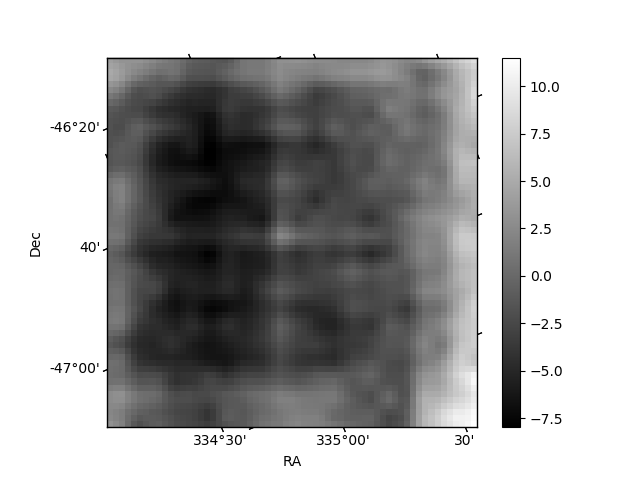
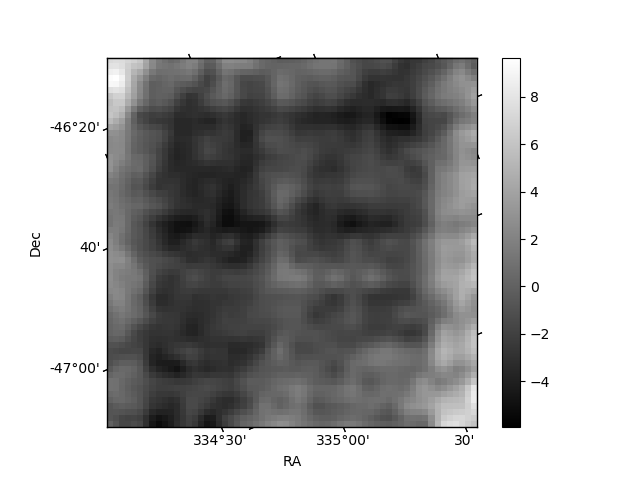
Histogram calculated using DETX and DETY for each event in the final _common_clean file
| Quadrant A | 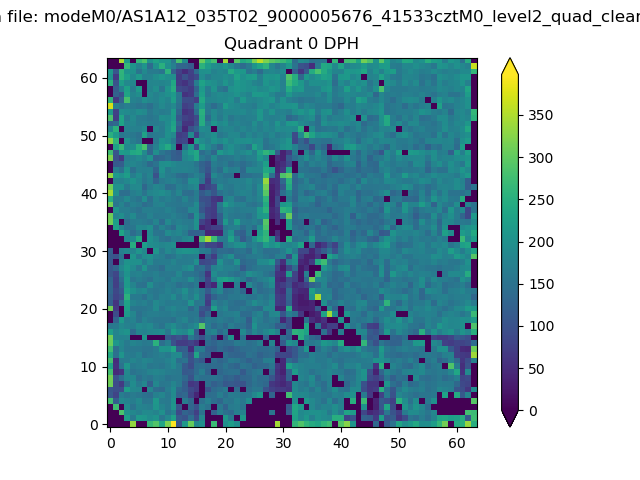 |
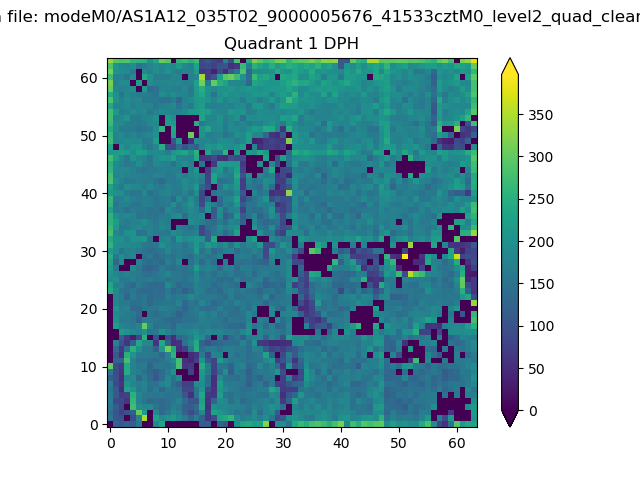 |
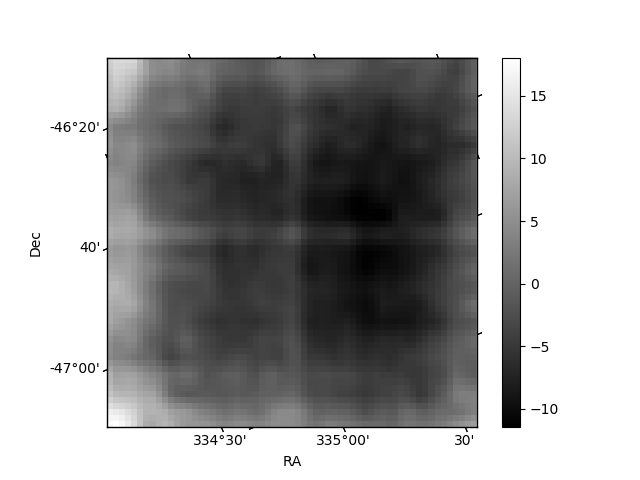
Quadrant B |
|---|---|---|---|
| Quadrant D | 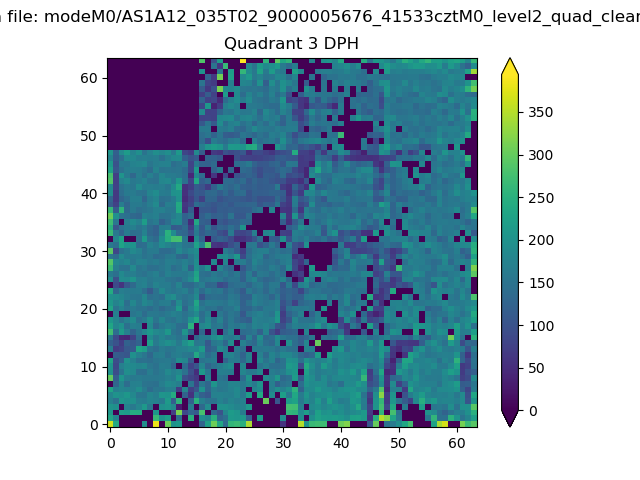 |
 |
Quadrant C |
| Plot type | Count rate plots | Images |
|---|---|---|
| Comparison with Poisson distribution Blue bars denote a histogram of data divided into 1 sec bins. Red curve is a Poisson curve with rate = median count rate of data. |
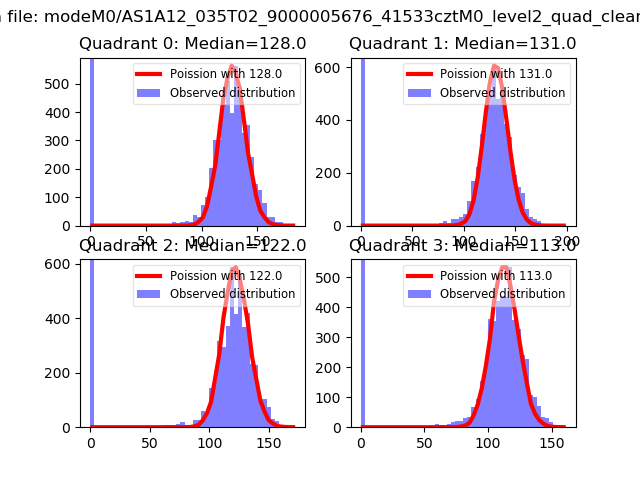 |
 |
| Quadrant-wise count rates Data is divided into 100 sec bins |
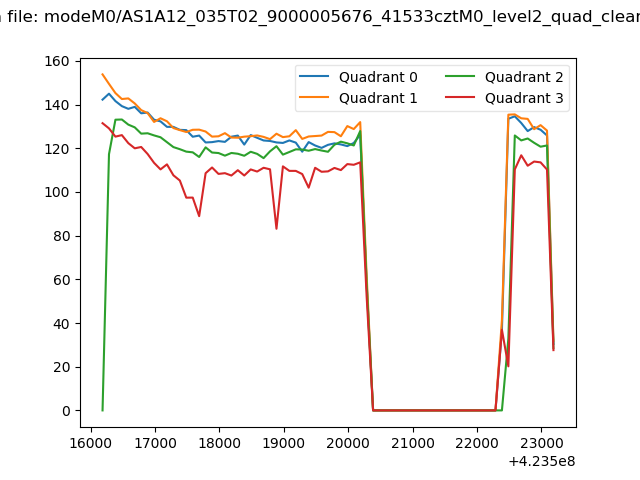 |
|
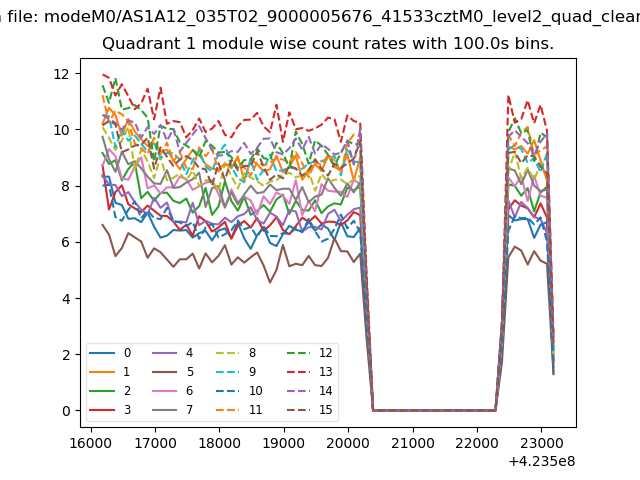
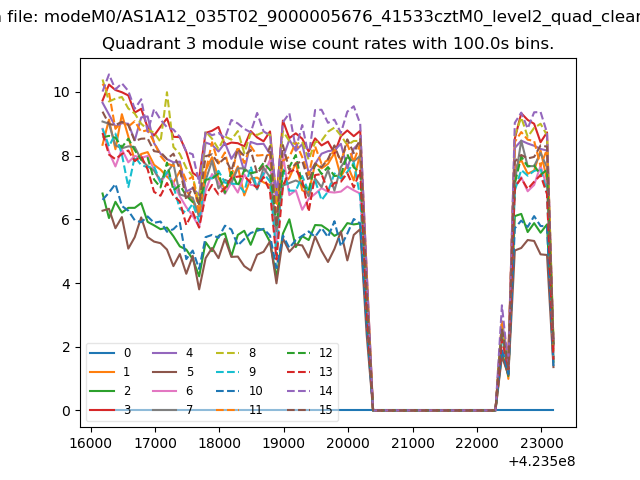
| Module-wise count rates for Quadrant A Data is divided into 100 sec bins |
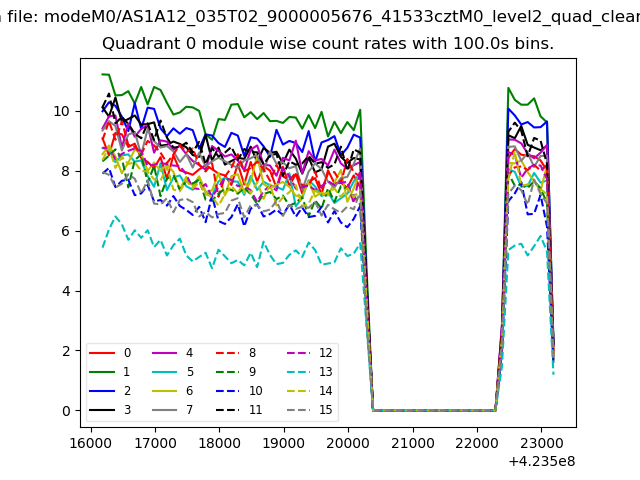 |
 |
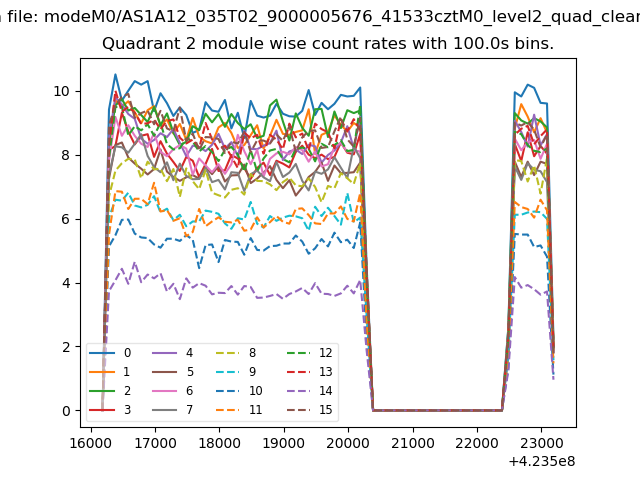
| Module-wise count rates for Quadrant B Data is divided into 100 sec bins |
 |
 |
| Module-wise count rates for Quadrant C Data is divided into 100 sec bins |
 |
 |
| Module-wise count rates for Quadrant D Data is divided into 100 sec bins |
 |
 |
| Parameter | Plot |
|---|---|
| CZT HV Monitor |  |
| D_VDD | 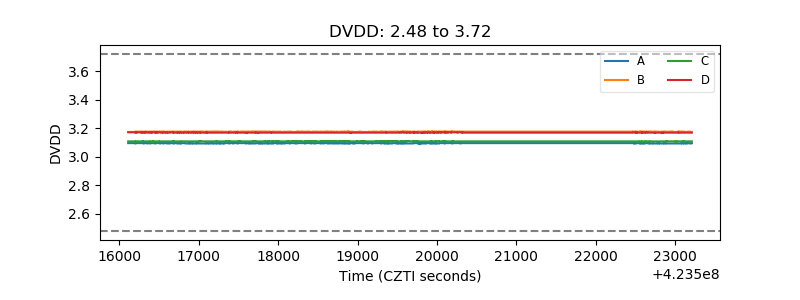 |
| Temperature 1 | 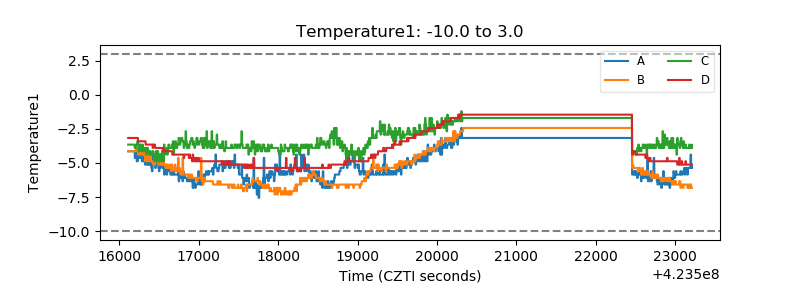 |
| Veto HV Monitor | 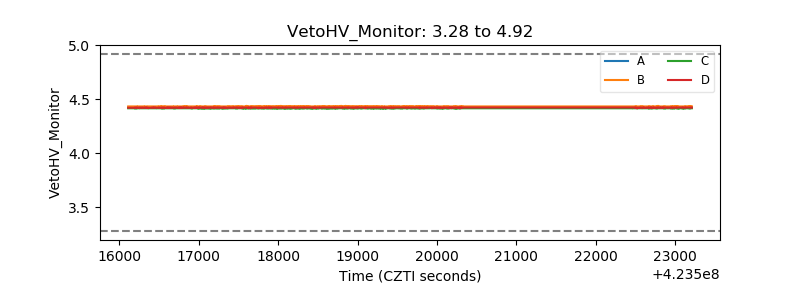 |
| Veto LLD | 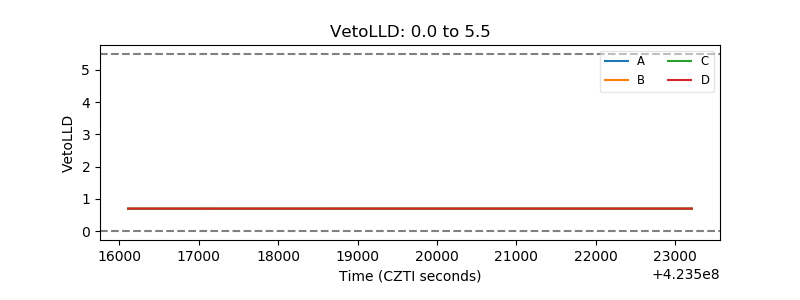 |
| Alpha Counter | 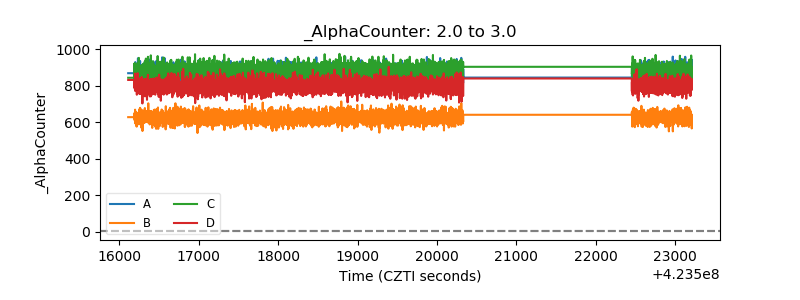 |
| _CPM_Rate | 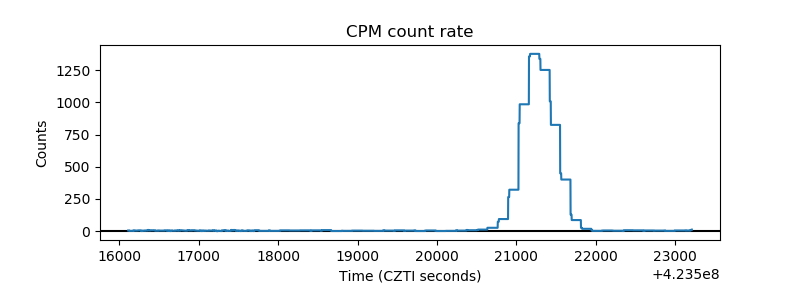 |
| CZT Counter | 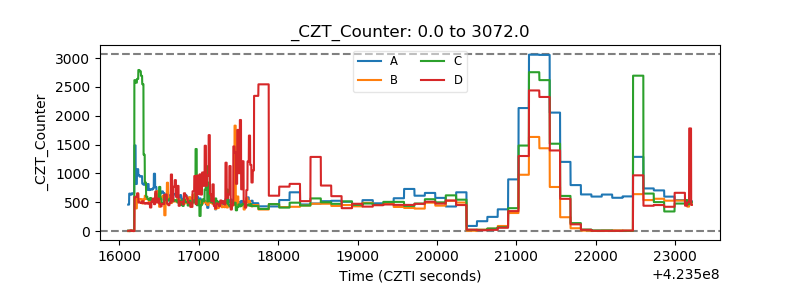 |
| +2.5 Volts monitor | 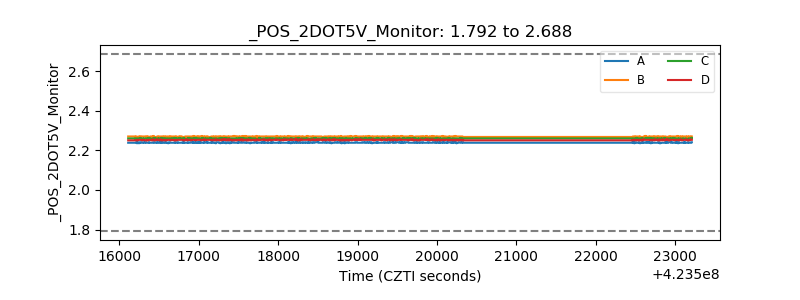 |
| +5 Volts monitor | 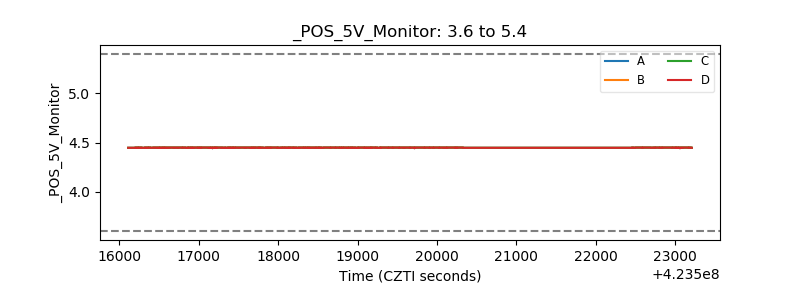 |
| _ROLL_ROT | 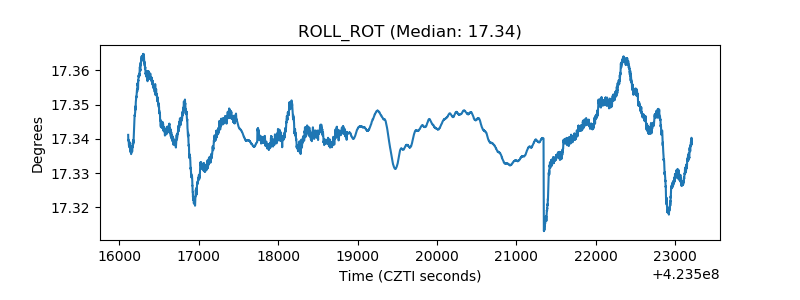 |
| _Roll_DEC | 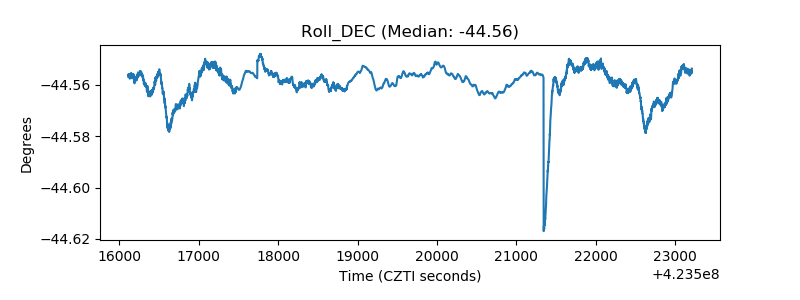 |
| _Roll_RA | 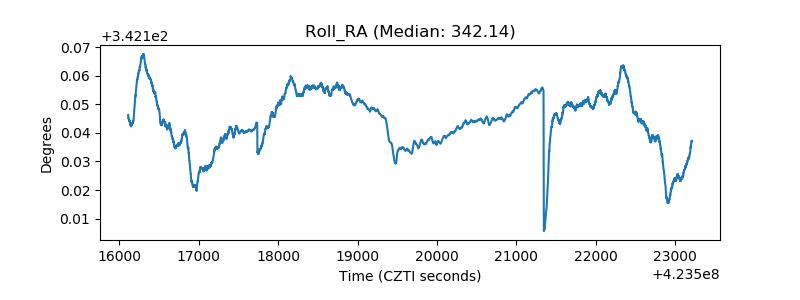 |
| Veto Counter | 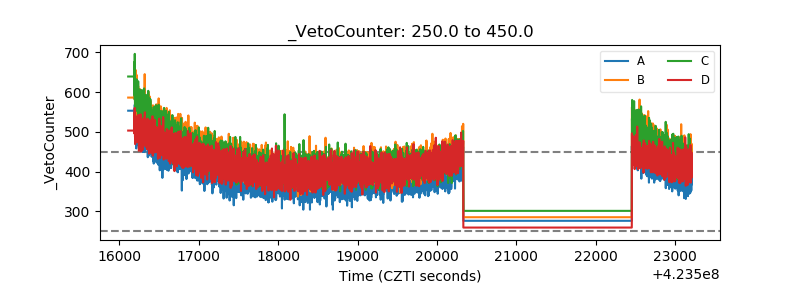 |