| Param | Original file | Final file |
|---|---|---|
| Filename | modeM0/AS1A12_035T02_9000005676_41534cztM0_level2.fits | modeM0/AS1A12_035T02_9000005676_41534cztM0_level2_quad_clean.evt |
| Size (bytes) | 307,817,280 | 84,862,080 |
| Size | 293.6 MB | 80.9 MB |
| Events in quadrant A | 2,631,839 | 585,990 |
| Events in quadrant B | 2,213,755 | 600,845 |
| Events in quadrant C | 3,063,674 | 538,314 |
| Events in quadrant D | 3,107,289 | 504,723 |
| Mode SS | |||
|---|---|---|---|
| Quadrant | BADHDUFLAG | Total packets | Discarded packets |
| A | 0 | 98 | 0 |
| B | 0 | 98 | 0 |
| C | 0 | 98 | 0 |
| D | 0 | 98 | 0 |
| Mode M0 | |||
|---|---|---|---|
| Quadrant | BADHDUFLAG | Total packets | Discarded packets |
| A | 0 | 10744 | 3 |
| B | 0 | 9837 | 2 |
| C | 0 | 12028 | 2 |
| D | 0 | 12587 | 2 |
| Mode M9 | |||
|---|---|---|---|
| Quadrant | BADHDUFLAG | Total packets | Discarded packets |
| A | 0 | 36 | 0 |
| B | 0 | 36 | 0 |
| C | 0 | 36 | 0 |
| D | 0 | 37 | 0 |
| Quadrant | Total seconds | Saturated seconds | Saturation percentage |
|---|---|---|---|
| A | 4846 | 16 | 0.330169% |
| B | 4846 | 13 | 0.268262% |
| C | 4846 | 257 | 5.303343% |
| D | 4846 | 239 | 4.931903% |
Noise dominated data is calculated using 1-second bins in cleaned event files. If a bin has >2000 counts, and if more than 50% of those come from <1% of pixels, then it is considered to be noise-dominated and hence unusable.
| Quadrant | # 1 sec bins | Bins with >0 counts | Bins with >2000 counts | High rate bins dominated by noise | Noise dominated (total time) | Noise dominated (detector-on time) | Marked lightcurve |
|---|---|---|---|---|---|---|---|
| A | 6969 | 4846 | 5 | 5 | 0.07% | 0.10% | 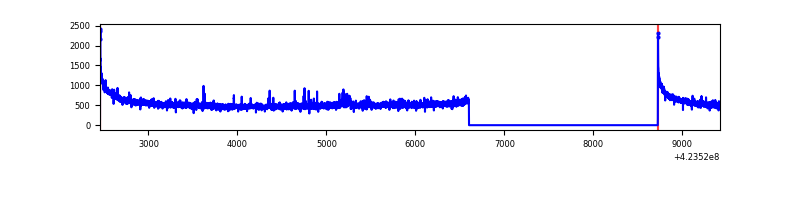 |
| B | 6969 | 4846 | 5 | 5 | 0.07% | 0.10% | 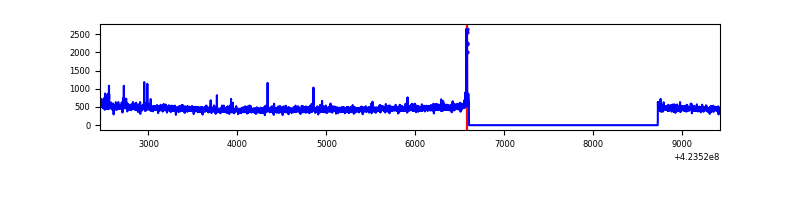 |
| C | 6969 | 4847 | 260 | 260 | 3.73% | 5.36% | 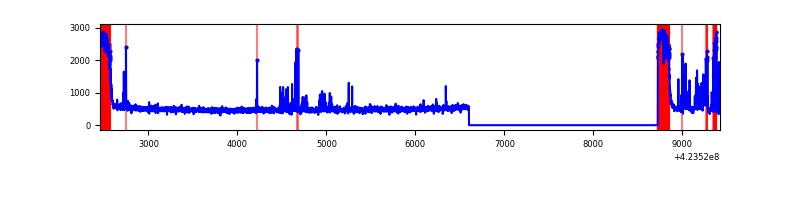 |
| D | 6969 | 4847 | 239 | 239 | 3.43% | 4.93% | 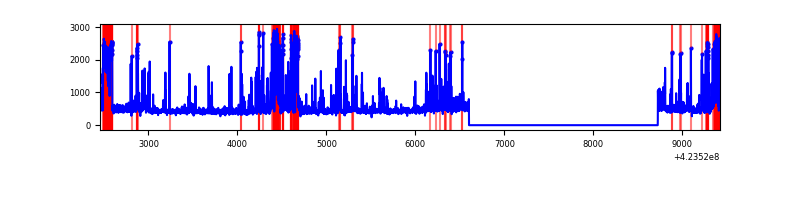 |
Top three noisy pixels from each quadrant. If the there are fewer than three noisy pixels in the level2.evt file, extra rows are filled as -1
| Pixel properties | Quadrant properties | ||||||
|---|---|---|---|---|---|---|---|
| Quadrant | DetID | PixID | Counts | Sigma | Mean | Median | Sigma |
| A | 10 | 83 | 471433 | 4204.94 | 548 | 537 | 112.0 |
| A | 14 | 235 | 17835 | 154.47 | 548 | 537 | 112.0 |
| A | 2 | 79 | 16704 | 144.37 | 548 | 537 | 112.0 |
| B | 5 | 255 | 29325 | 274.3 | 548 | 534 | 105.0 |
| B | 12 | 111 | 12799 | 116.85 | 548 | 534 | 105.0 |
| B | 0 | 245 | 12321 | 112.3 | 548 | 534 | 105.0 |
| C | 0 | 10 | 613404 | 5063.88 | 522 | 527 | 121.0 |
| C | 15 | 214 | 207922 | 1713.59 | 522 | 527 | 121.0 |
| C | 9 | 54 | 137588 | 1132.46 | 522 | 527 | 121.0 |
| D | 12 | 218 | 358202 | 2790.94 | 526 | 511 | 128.2 |
| D | 12 | 128 | 202870 | 1578.94 | 526 | 511 | 128.2 |
| D | 1 | 47 | 149587 | 1163.19 | 526 | 511 | 128.2 |
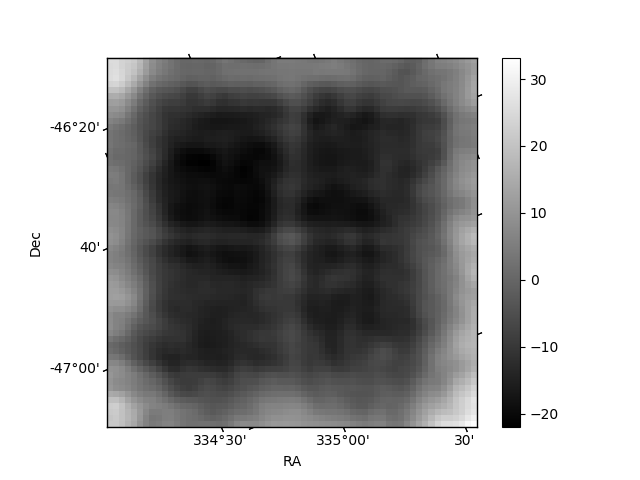
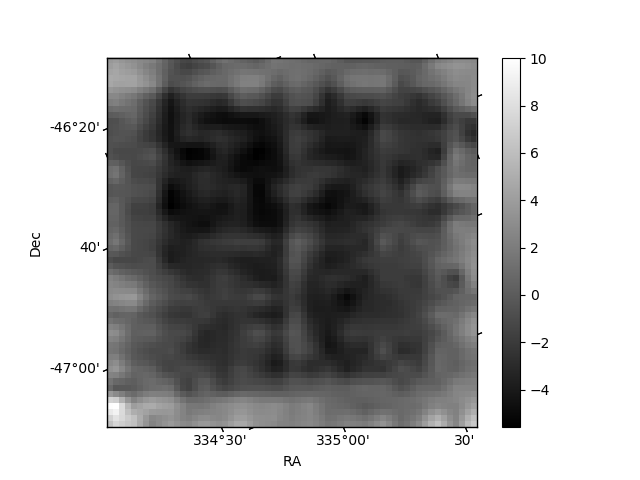
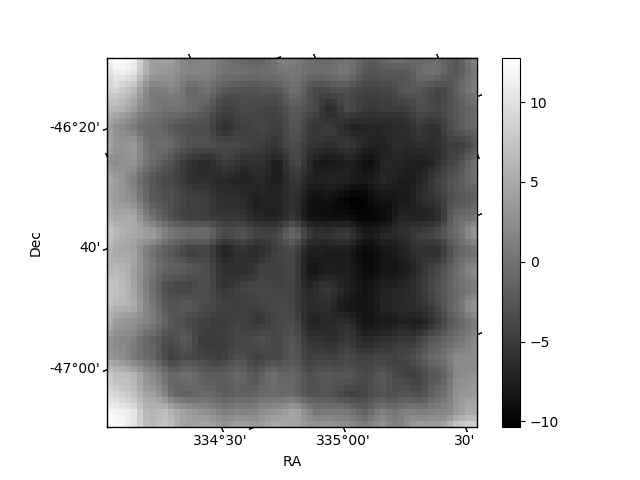
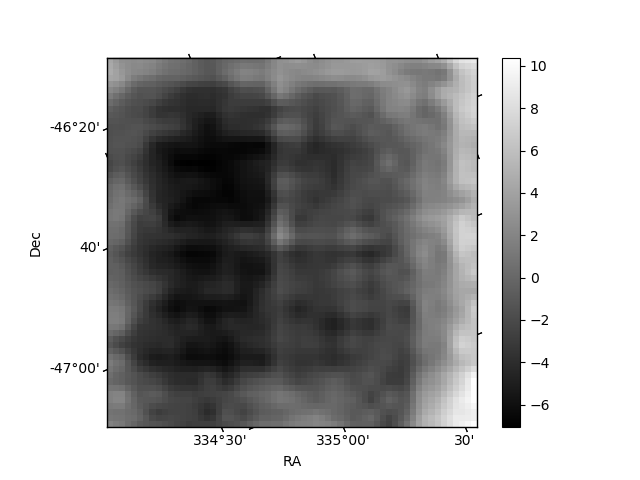
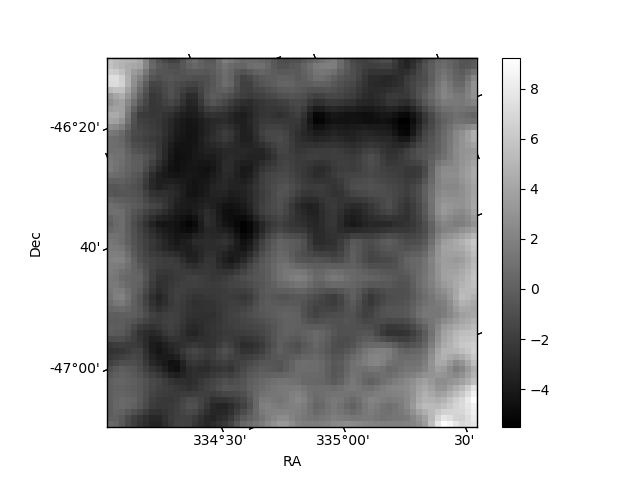
Histogram calculated using DETX and DETY for each event in the final _common_clean file
| Quadrant A | 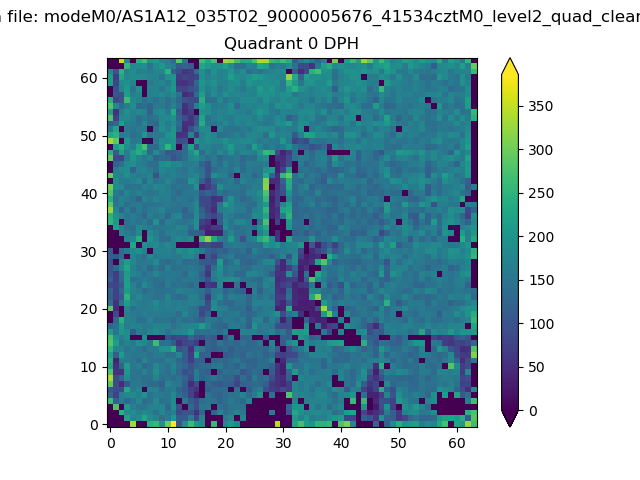 |
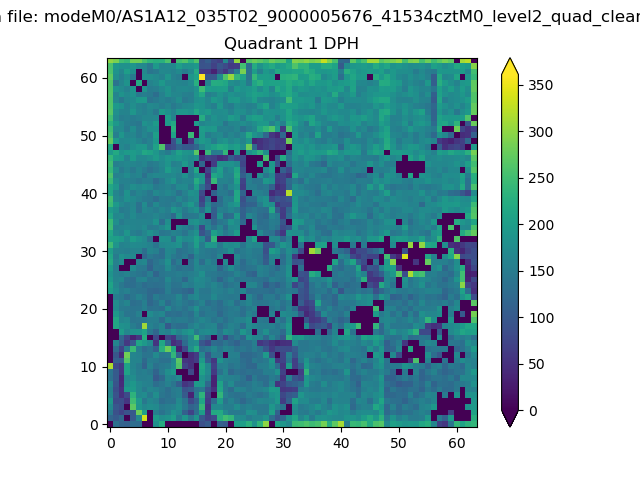 |
Quadrant B |
|---|---|---|---|
| Quadrant D | 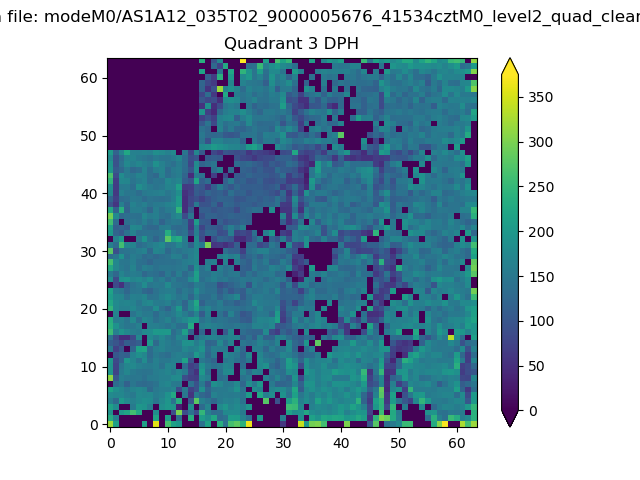 |
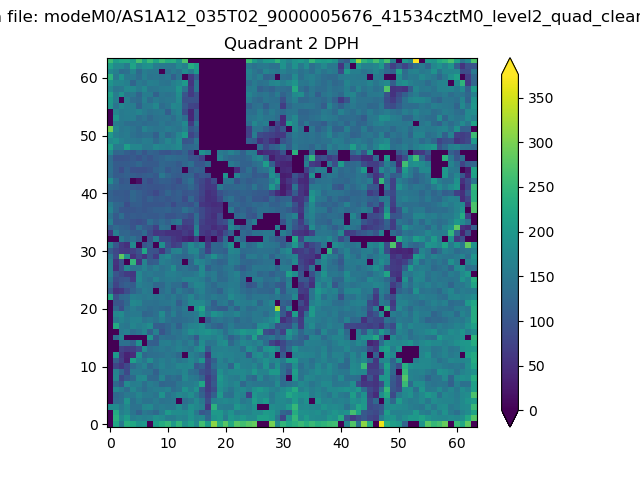 |
Quadrant C |
| Plot type | Count rate plots | Images |
|---|---|---|
| Comparison with Poisson distribution Blue bars denote a histogram of data divided into 1 sec bins. Red curve is a Poisson curve with rate = median count rate of data. |
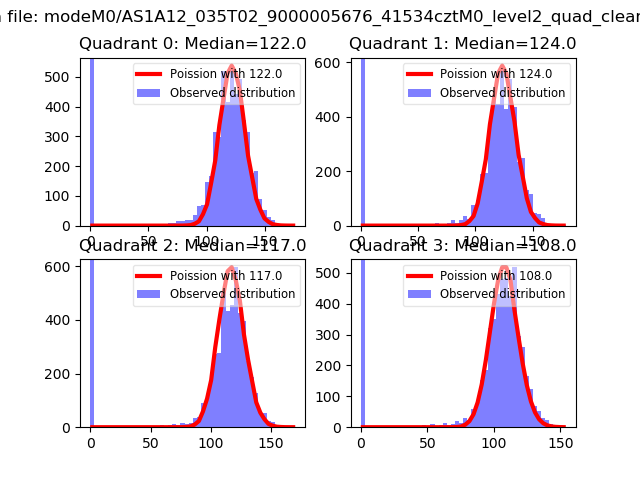 |
 |
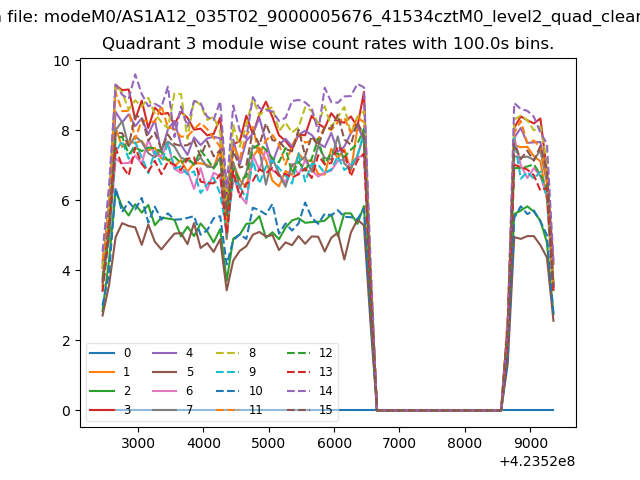
| Quadrant-wise count rates Data is divided into 100 sec bins |
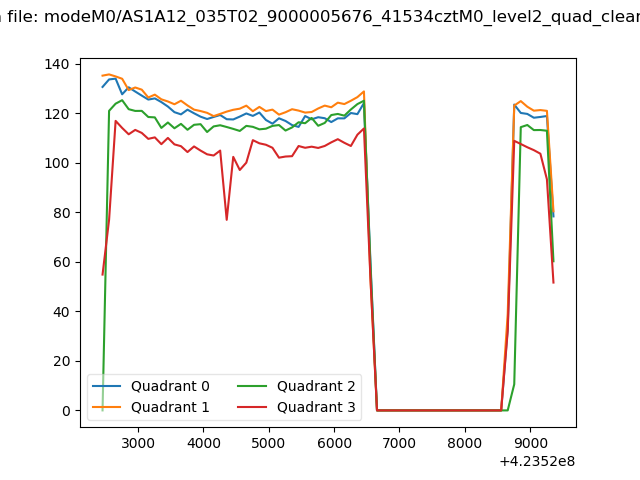 |
|
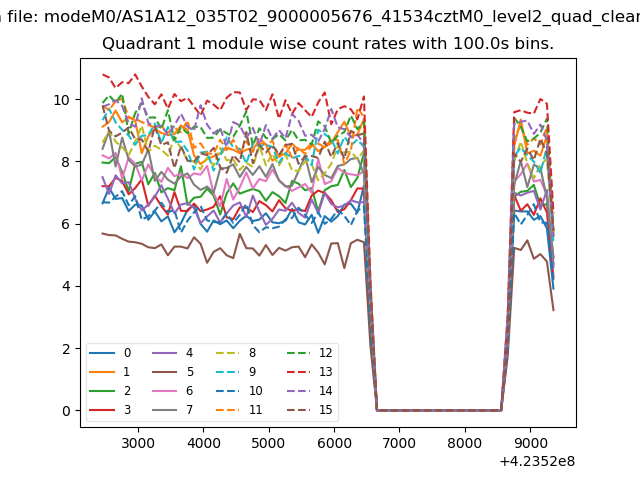
| Module-wise count rates for Quadrant A Data is divided into 100 sec bins |
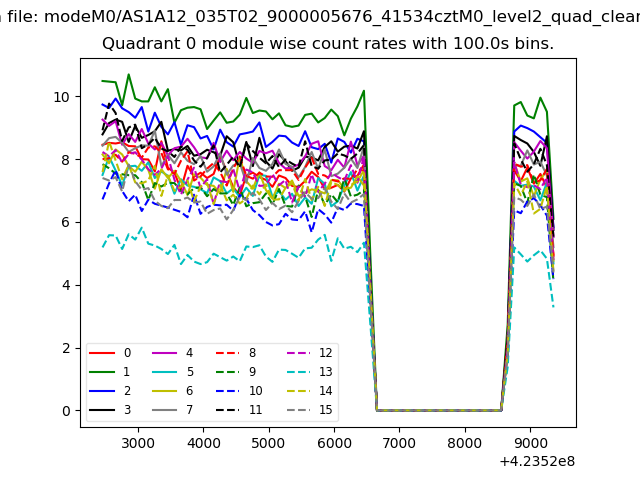 |
 |
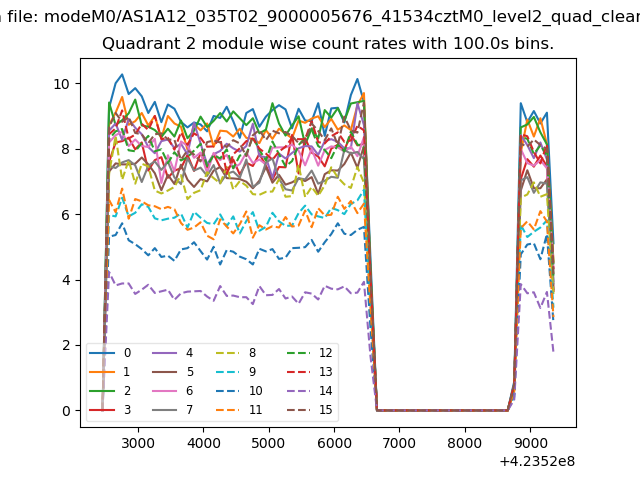
| Module-wise count rates for Quadrant B Data is divided into 100 sec bins |
 |
 |
| Module-wise count rates for Quadrant C Data is divided into 100 sec bins |
 |
 |
| Module-wise count rates for Quadrant D Data is divided into 100 sec bins |
 |
 |
| Parameter | Plot |
|---|---|
| CZT HV Monitor |  |
| D_VDD | 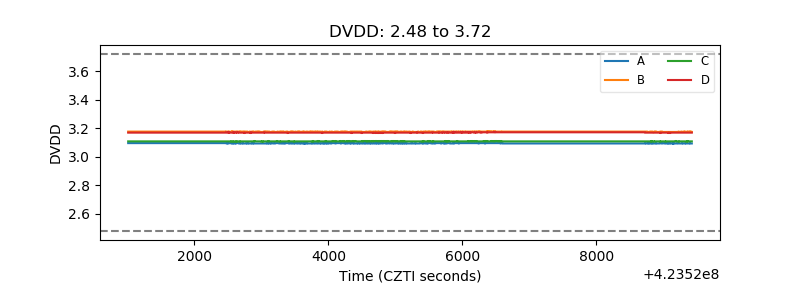 |
| Temperature 1 | 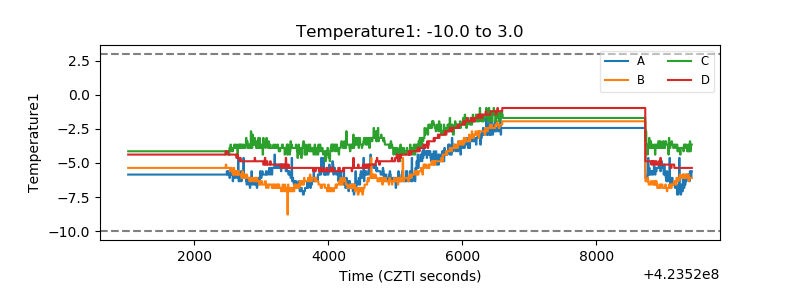 |
| Veto HV Monitor | 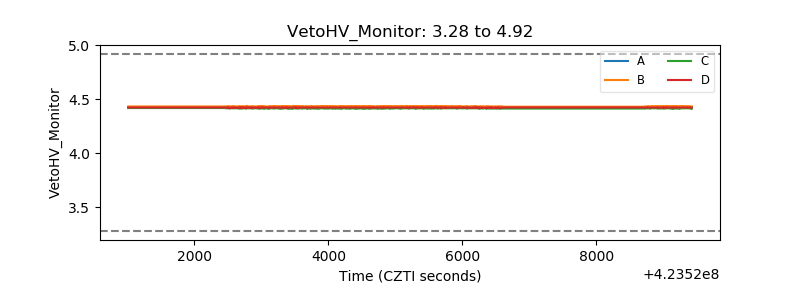 |
| Veto LLD | 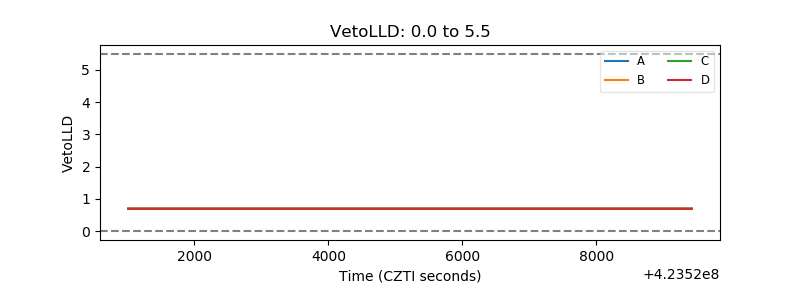 |
| Alpha Counter | 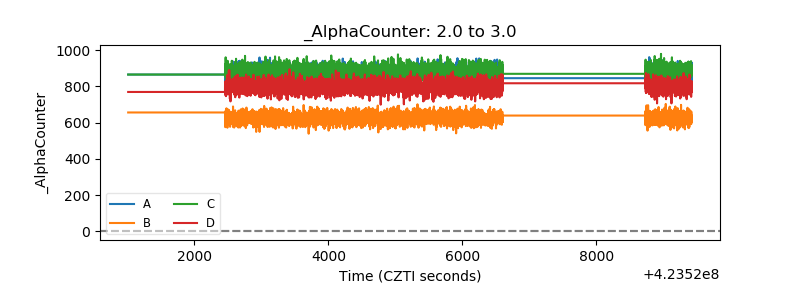 |
| _CPM_Rate | 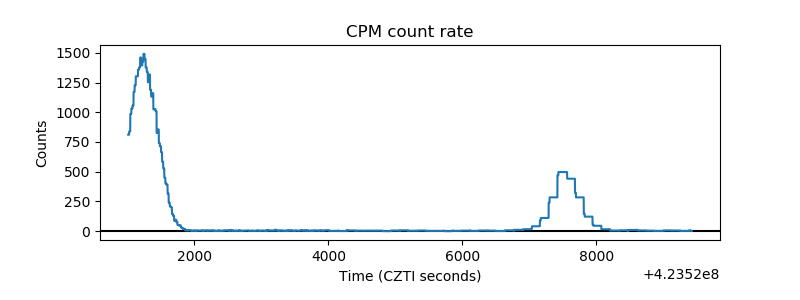 |
| CZT Counter | 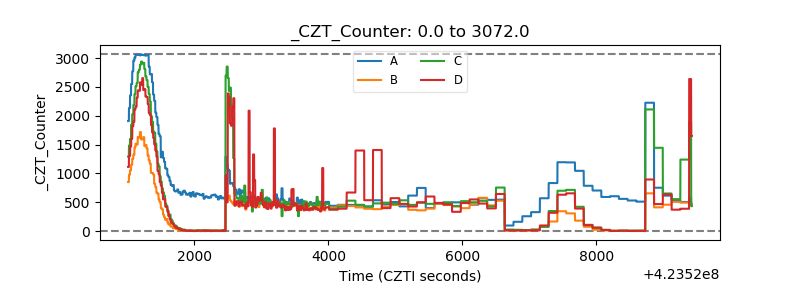 |
| +2.5 Volts monitor | 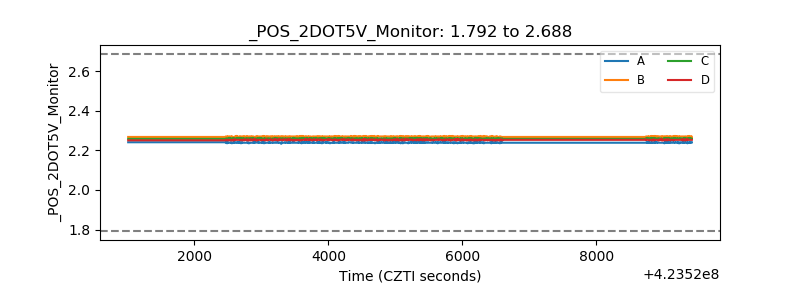 |
| +5 Volts monitor | 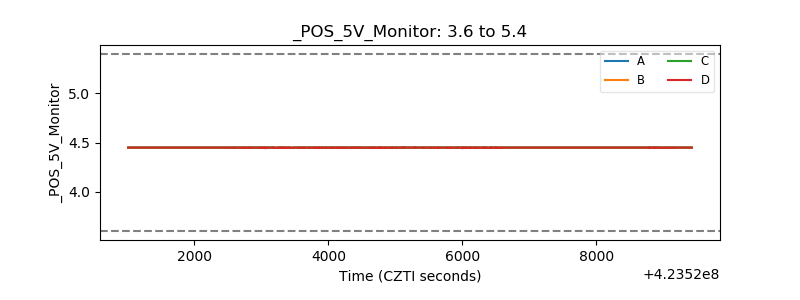 |
| _ROLL_ROT | 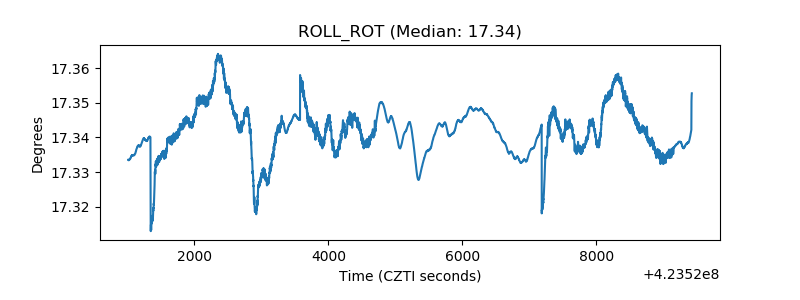 |
| _Roll_DEC | 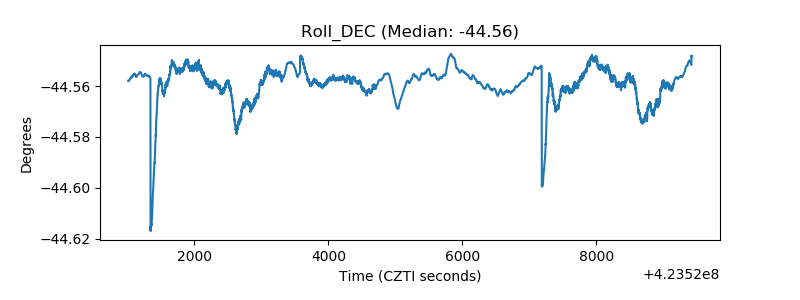 |
| _Roll_RA | 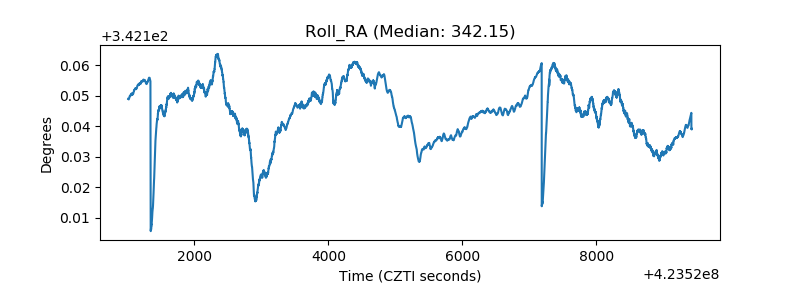 |
| Veto Counter | 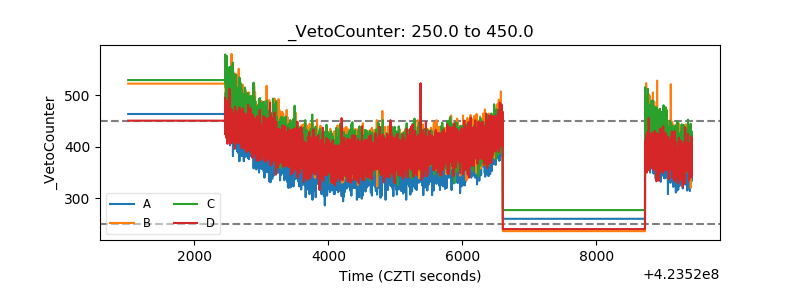 |