| Param | Original file | Final file |
|---|---|---|
| Filename | modeM0/AS1A12_035T02_9000005676_41541cztM0_level2.fits | modeM0/AS1A12_035T02_9000005676_41541cztM0_level2_quad_clean.evt |
| Size (bytes) | 1,285,799,040 | 327,107,520 |
| Size | 1.2 GB | 312.0 MB |
| Events in quadrant A | 10,950,556 | 2,223,591 |
| Events in quadrant B | 12,350,165 | 2,159,806 |
| Events in quadrant C | 10,569,533 | 2,137,214 |
| Events in quadrant D | 12,138,086 | 1,970,615 |
| Mode SS | |||
|---|---|---|---|
| Quadrant | BADHDUFLAG | Total packets | Discarded packets |
| A | 0 | 418 | 0 |
| B | 0 | 418 | 0 |
| C | 0 | 418 | 0 |
| D | 0 | 418 | 0 |
| Mode M0 | |||
|---|---|---|---|
| Quadrant | BADHDUFLAG | Total packets | Discarded packets |
| A | 0 | 44265 | 6 |
| B | 0 | 50728 | 5 |
| C | 0 | 44289 | 5 |
| D | 0 | 50558 | 5 |
| Mode M9 | |||
|---|---|---|---|
| Quadrant | BADHDUFLAG | Total packets | Discarded packets |
| A | 0 | 61 | 0 |
| B | 0 | 61 | 0 |
| C | 0 | 61 | 0 |
| D | 0 | 62 | 0 |
| Quadrant | Total seconds | Saturated seconds | Saturation percentage |
|---|---|---|---|
| A | 20513 | 88 | 0.428996% |
| B | 20513 | 730 | 3.558719% |
| C | 20513 | 393 | 1.915858% |
| D | 20513 | 500 | 2.437479% |
Noise dominated data is calculated using 1-second bins in cleaned event files. If a bin has >2000 counts, and if more than 50% of those come from <1% of pixels, then it is considered to be noise-dominated and hence unusable.
| Quadrant | # 1 sec bins | Bins with >0 counts | Bins with >2000 counts | High rate bins dominated by noise | Noise dominated (total time) | Noise dominated (detector-on time) | Marked lightcurve |
|---|---|---|---|---|---|---|---|
| A | 26065 | 20517 | 50 | 50 | 0.19% | 0.24% | 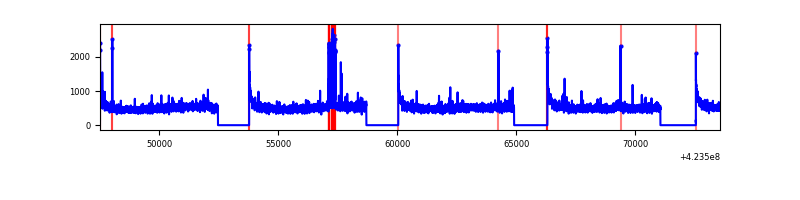 |
| B | 26064 | 20514 | 564 | 564 | 2.16% | 2.75% | 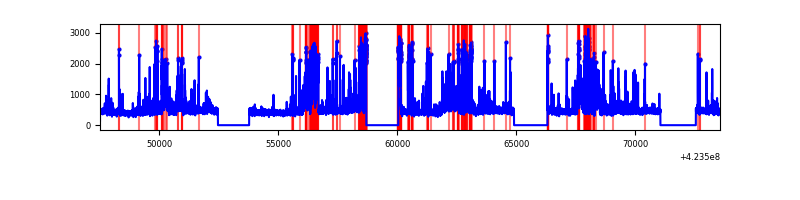 |
| C | 26064 | 20514 | 389 | 389 | 1.49% | 1.90% | 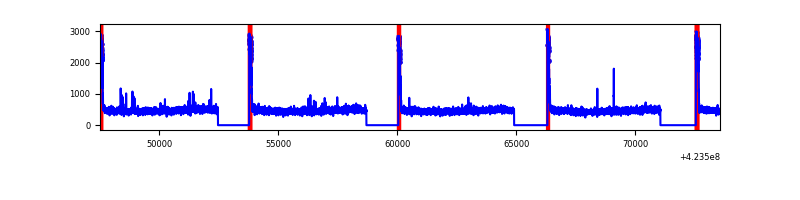 |
| D | 26064 | 20514 | 475 | 475 | 1.82% | 2.32% | 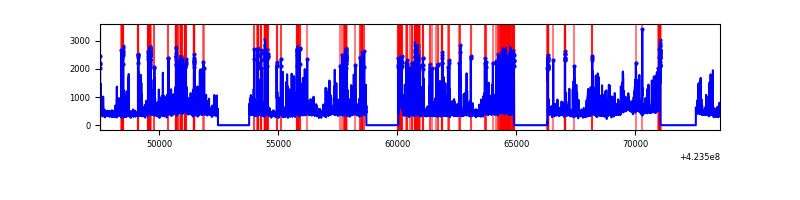 |
Top three noisy pixels from each quadrant. If the there are fewer than three noisy pixels in the level2.evt file, extra rows are filled as -1
| Pixel properties | Quadrant properties | ||||||
|---|---|---|---|---|---|---|---|
| Quadrant | DetID | PixID | Counts | Sigma | Mean | Median | Sigma |
| A | 10 | 83 | 1775426 | 3838.02 | 2266 | 2219 | 462.0 |
| A | 2 | 79 | 341817 | 735.04 | 2266 | 2219 | 462.0 |
| A | 13 | 254 | 35121 | 71.21 | 2266 | 2219 | 462.0 |
| B | 5 | 255 | 2004952 | 4733.03 | 2211 | 2148 | 423.2 |
| B | 0 | 186 | 1233734 | 2910.49 | 2211 | 2148 | 423.2 |
| B | 0 | 245 | 191991 | 448.64 | 2211 | 2148 | 423.2 |
| C | 0 | 10 | 1110441 | 2196.08 | 2181 | 2193 | 504.6 |
| C | 15 | 214 | 886418 | 1752.16 | 2181 | 2193 | 504.6 |
| C | 14 | 254 | 33764 | 62.56 | 2181 | 2193 | 504.6 |
| D | 2 | 249 | 938894 | 1749.5 | 2198 | 2131 | 535.4 |
| D | 13 | 249 | 590271 | 1098.41 | 2198 | 2131 | 535.4 |
| D | 5 | 222 | 581750 | 1082.5 | 2198 | 2131 | 535.4 |
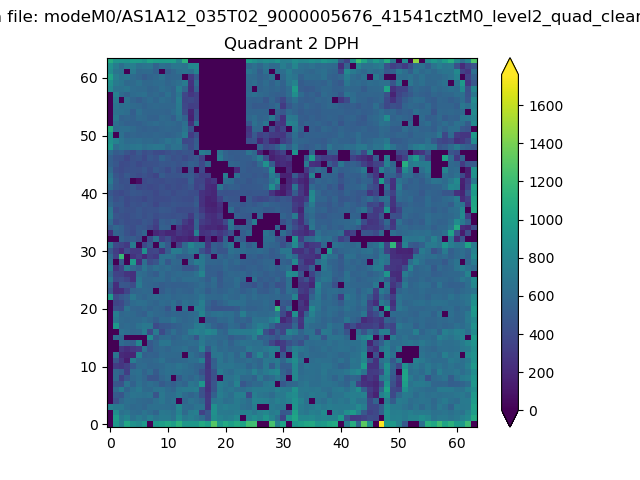
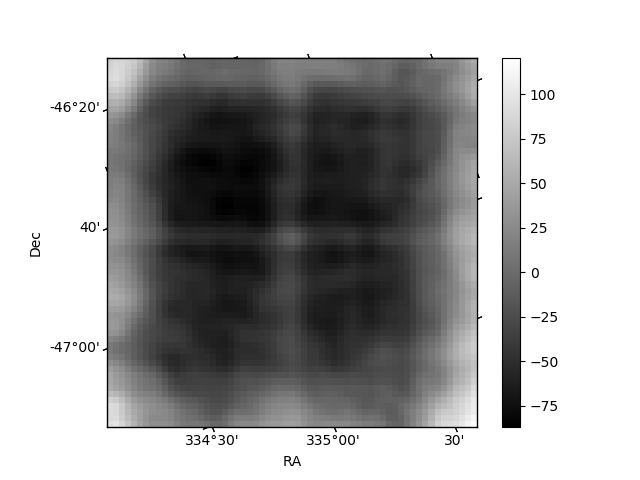
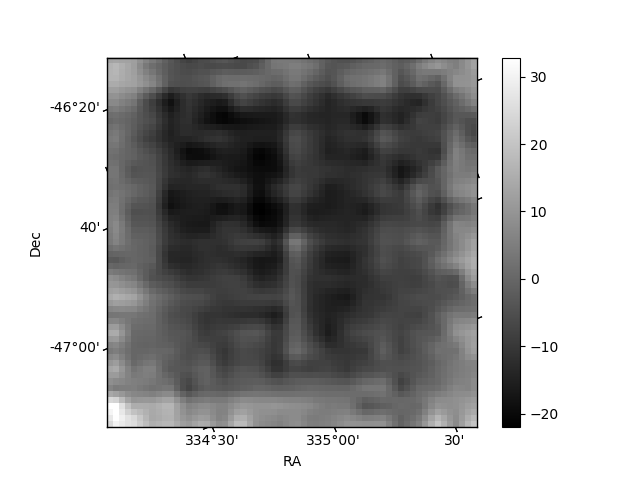
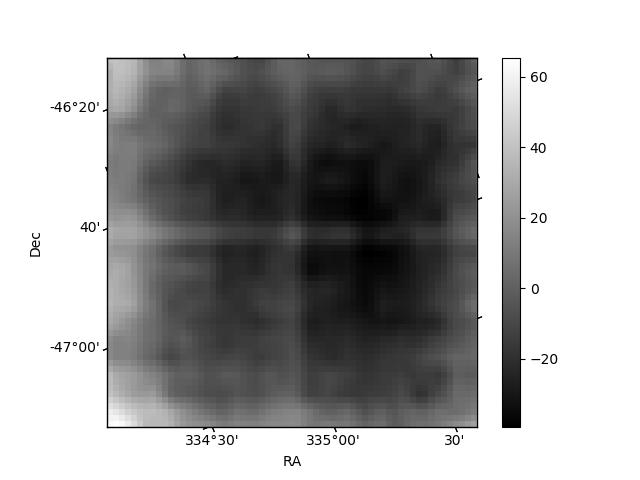
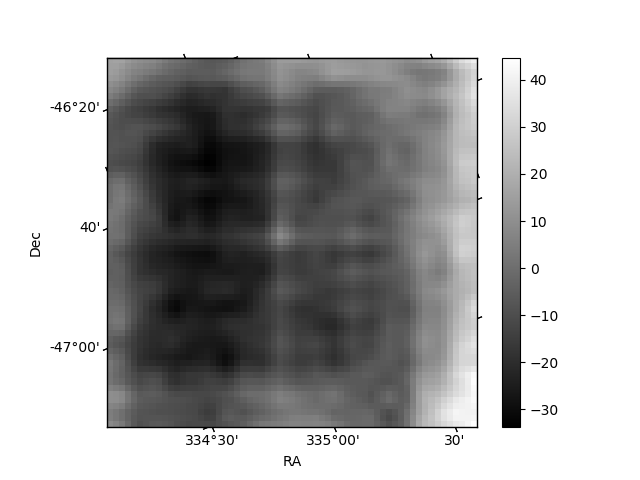
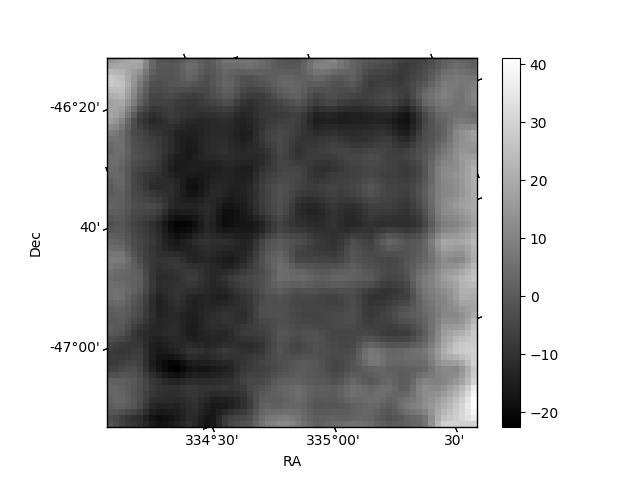
Histogram calculated using DETX and DETY for each event in the final _common_clean file
| Quadrant A | 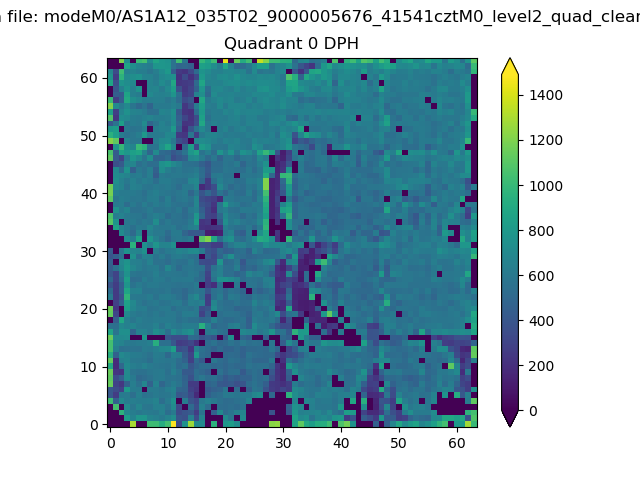 |
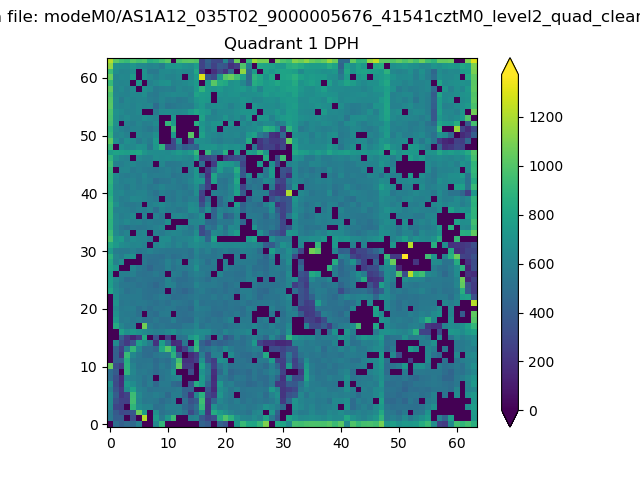 |
Quadrant B |
|---|---|---|---|
| Quadrant D | 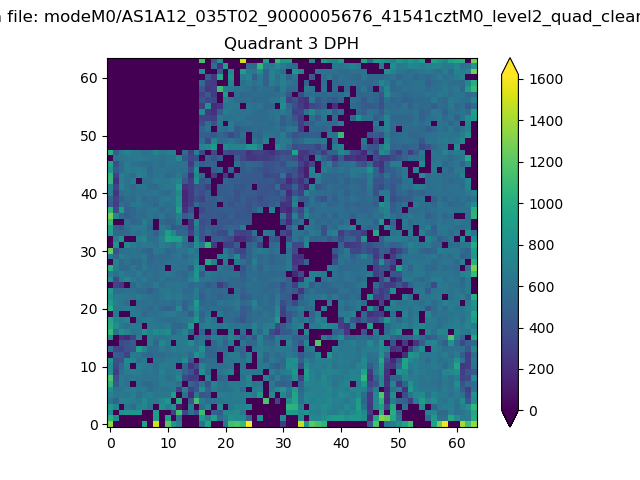 |
 |
Quadrant C |
| Plot type | Count rate plots | Images |
|---|---|---|
| Comparison with Poisson distribution Blue bars denote a histogram of data divided into 1 sec bins. Red curve is a Poisson curve with rate = median count rate of data. |
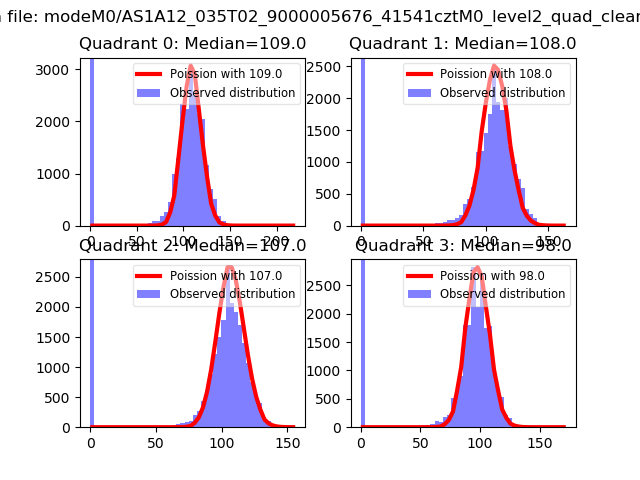 |
 |
| Quadrant-wise count rates Data is divided into 100 sec bins |
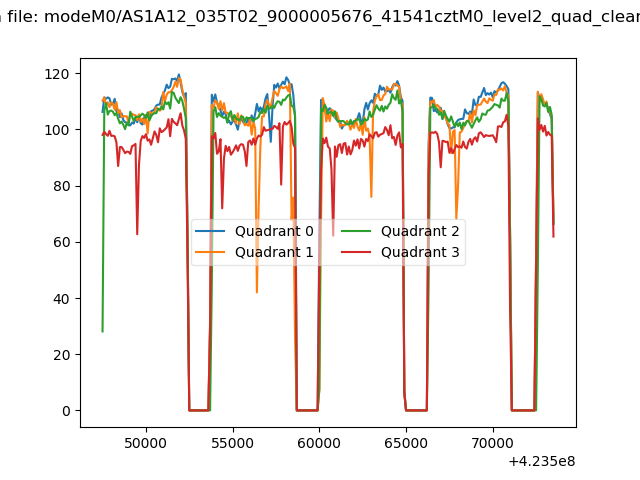 |
|
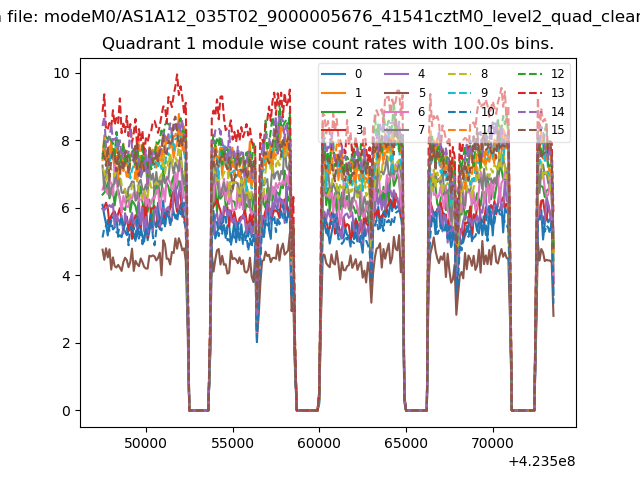
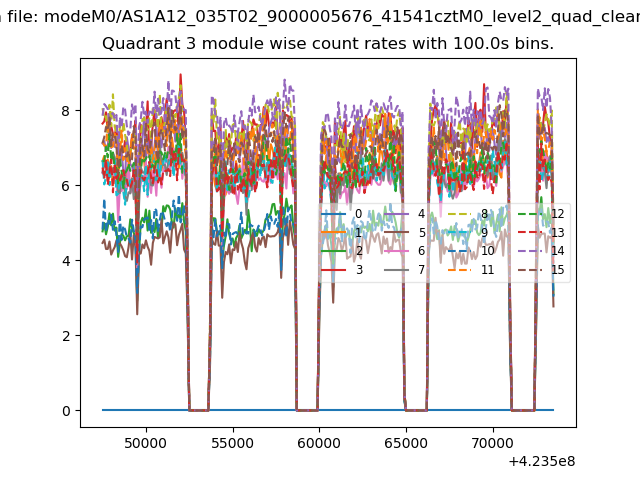
| Module-wise count rates for Quadrant A Data is divided into 100 sec bins |
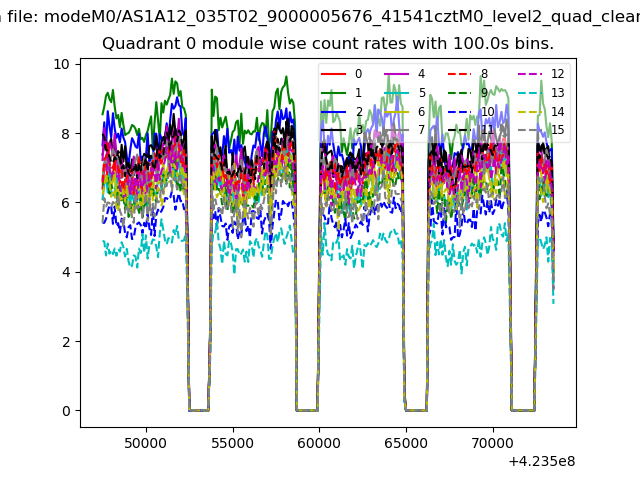 |
 |
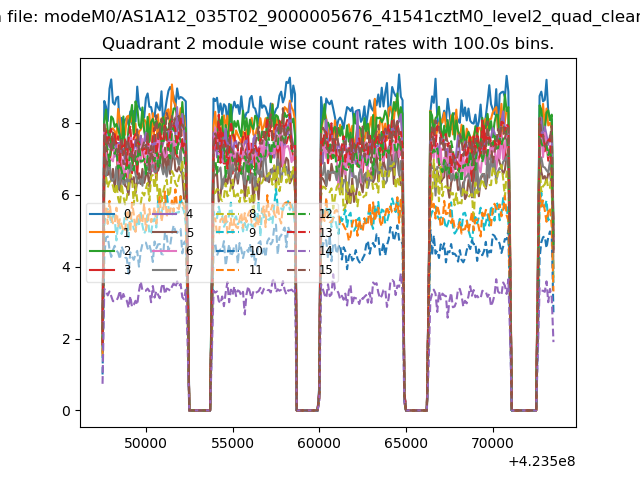
| Module-wise count rates for Quadrant B Data is divided into 100 sec bins |
 |
 |
| Module-wise count rates for Quadrant C Data is divided into 100 sec bins |
 |
 |
| Module-wise count rates for Quadrant D Data is divided into 100 sec bins |
 |
 |
| Parameter | Plot |
|---|---|
| CZT HV Monitor | 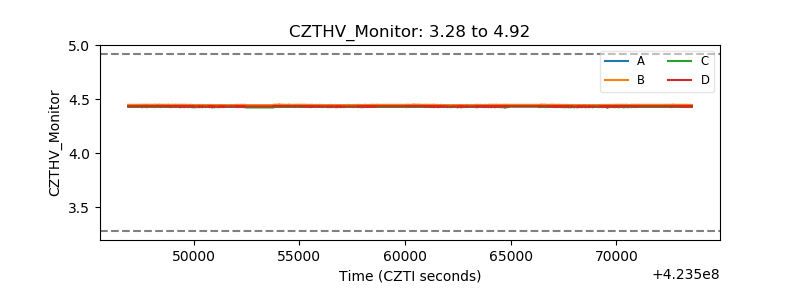 |
| D_VDD | 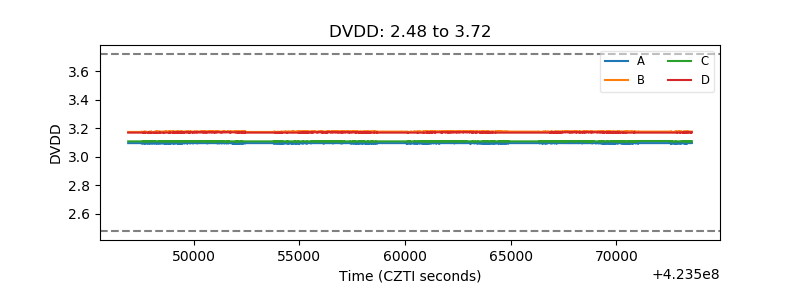 |
| Temperature 1 | 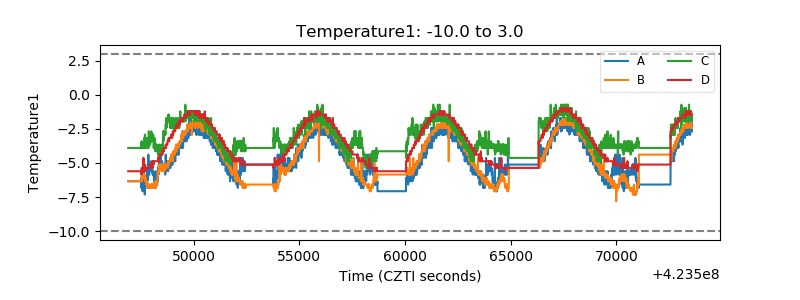 |
| Veto HV Monitor | 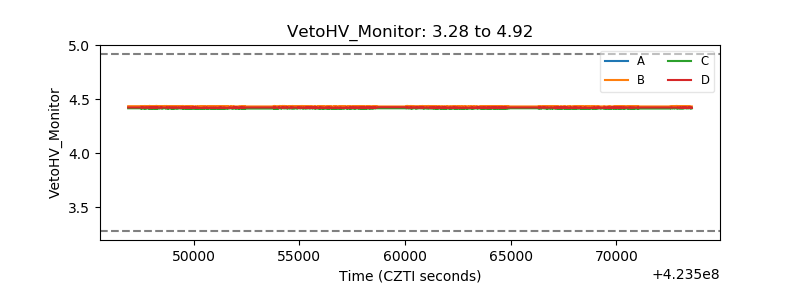 |
| Veto LLD | 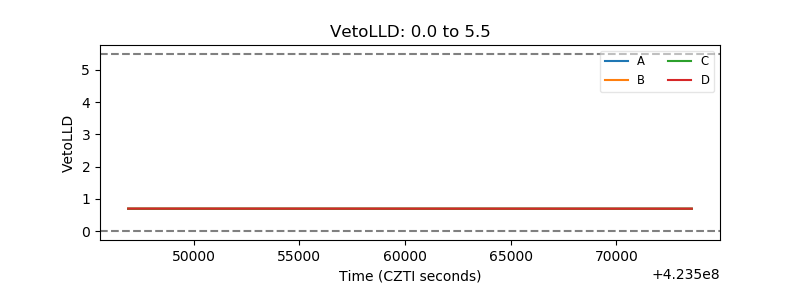 |
| Alpha Counter | 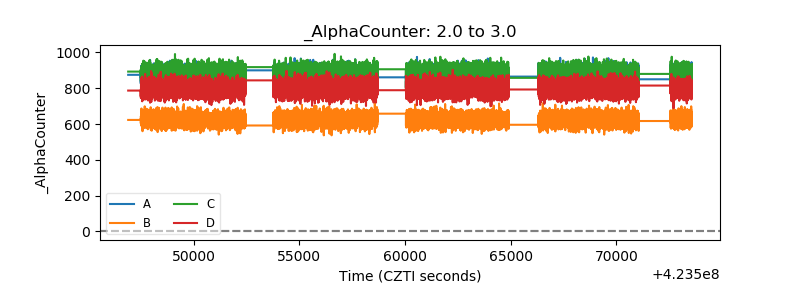 |
| _CPM_Rate | 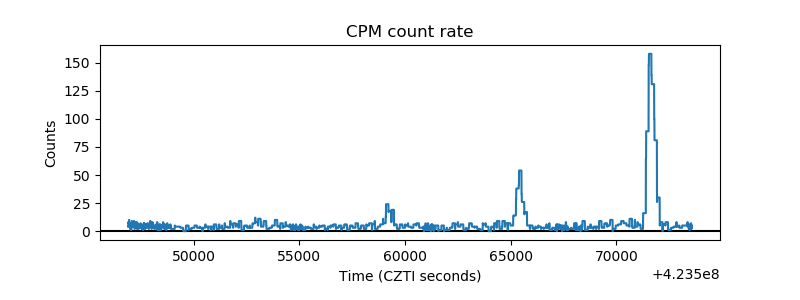 |
| CZT Counter | 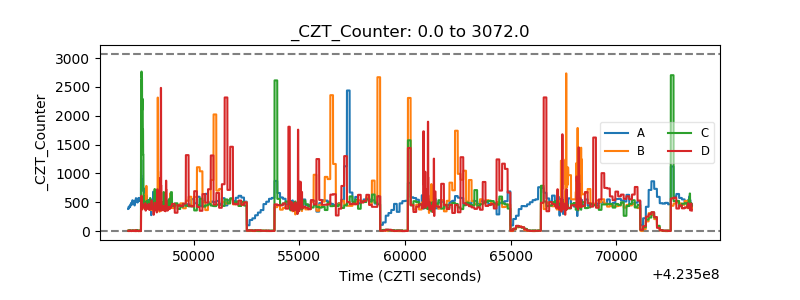 |
| +2.5 Volts monitor | 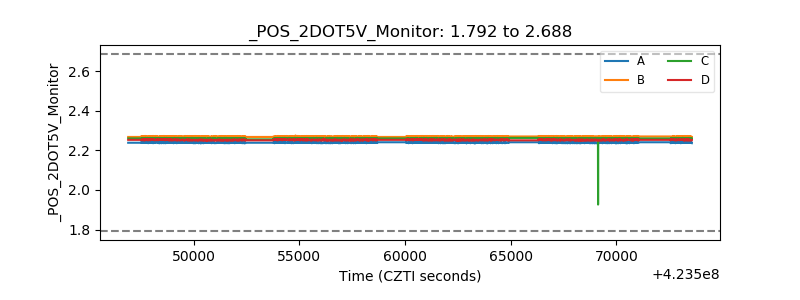 |
| +5 Volts monitor | 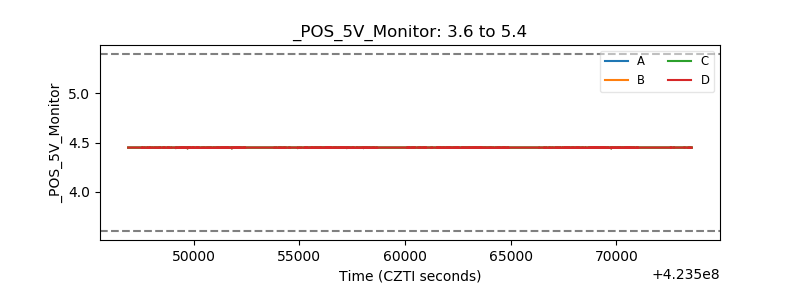 |
| _ROLL_ROT | 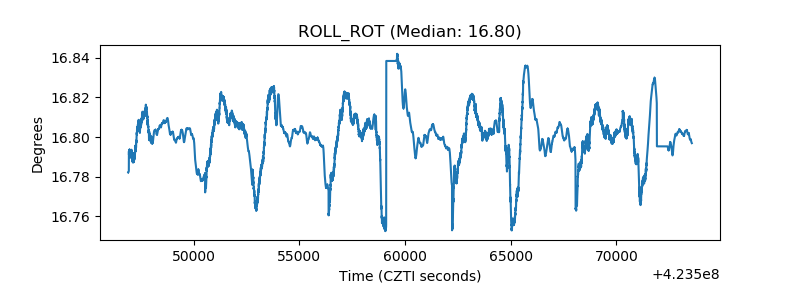 |
| _Roll_DEC | 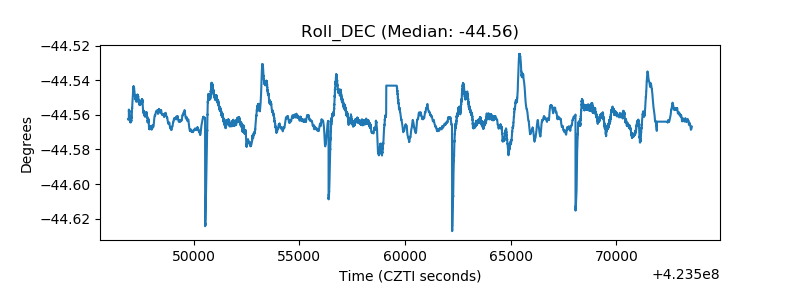 |
| _Roll_RA | 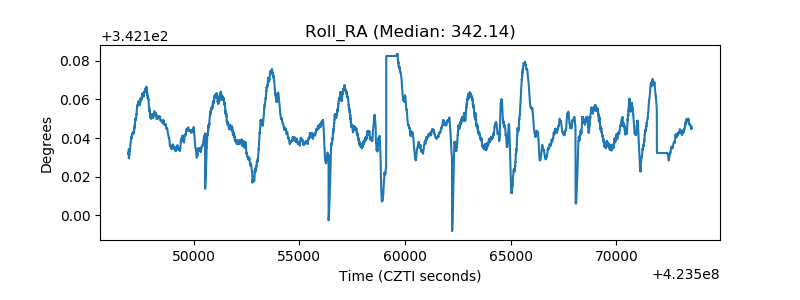 |
| Veto Counter | 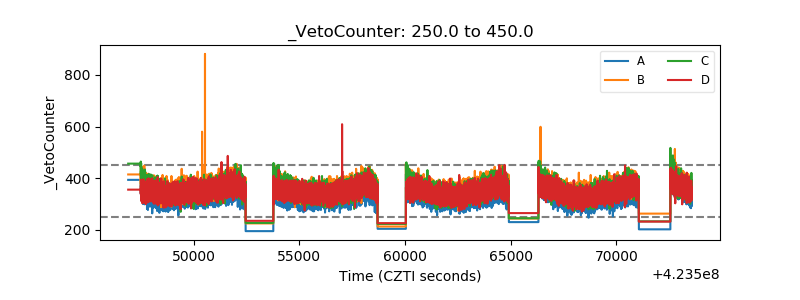 |