| Param | Original file | Final file |
|---|---|---|
| Filename | modeM0/AS1A12_035T02_9000005676_41542cztM0_level2.fits | modeM0/AS1A12_035T02_9000005676_41542cztM0_level2_quad_clean.evt |
| Size (bytes) | 341,622,720 | 91,506,240 |
| Size | 325.8 MB | 87.3 MB |
| Events in quadrant A | 3,026,823 | 616,194 |
| Events in quadrant B | 3,124,326 | 622,946 |
| Events in quadrant C | 3,042,949 | 583,791 |
| Events in quadrant D | 3,013,544 | 554,438 |
| Mode SS | |||
|---|---|---|---|
| Quadrant | BADHDUFLAG | Total packets | Discarded packets |
| A | 0 | 114 | 0 |
| B | 0 | 114 | 0 |
| C | 0 | 114 | 0 |
| D | 0 | 114 | 0 |
| Mode M0 | |||
|---|---|---|---|
| Quadrant | BADHDUFLAG | Total packets | Discarded packets |
| A | 0 | 12369 | 3 |
| B | 0 | 13010 | 2 |
| C | 0 | 12631 | 2 |
| D | 0 | 13002 | 2 |
| Mode M9 | |||
|---|---|---|---|
| Quadrant | BADHDUFLAG | Total packets | Discarded packets |
| A | 0 | 20 | 0 |
| B | 0 | 20 | 0 |
| C | 0 | 20 | 0 |
| D | 0 | 21 | 0 |
| Quadrant | Total seconds | Saturated seconds | Saturation percentage |
|---|---|---|---|
| A | 5625 | 16 | 0.284444% |
| B | 5625 | 62 | 1.102222% |
| C | 5625 | 187 | 3.324444% |
| D | 5625 | 114 | 2.026667% |
Noise dominated data is calculated using 1-second bins in cleaned event files. If a bin has >2000 counts, and if more than 50% of those come from <1% of pixels, then it is considered to be noise-dominated and hence unusable.
| Quadrant | # 1 sec bins | Bins with >0 counts | Bins with >2000 counts | High rate bins dominated by noise | Noise dominated (total time) | Noise dominated (detector-on time) | Marked lightcurve |
|---|---|---|---|---|---|---|---|
| A | 7267 | 5626 | 2 | 2 | 0.03% | 0.04% | 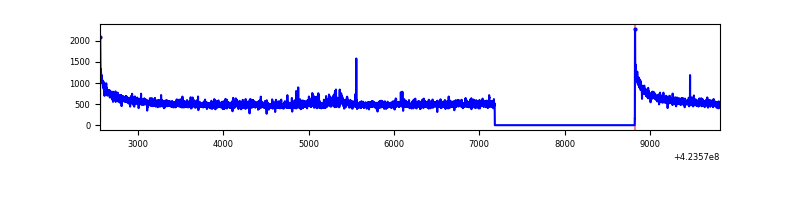 |
| B | 7267 | 5626 | 29 | 29 | 0.40% | 0.52% | 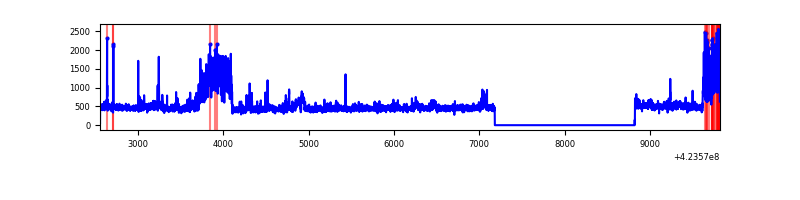 |
| C | 7267 | 5626 | 186 | 186 | 2.56% | 3.31% | 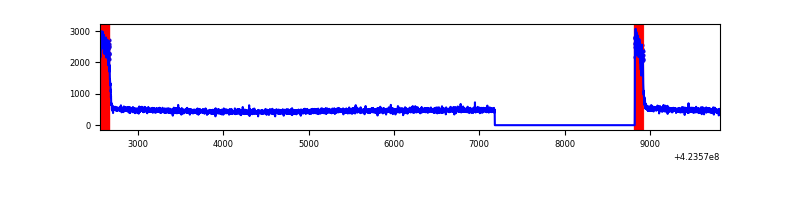 |
| D | 7267 | 5626 | 109 | 109 | 1.50% | 1.94% | 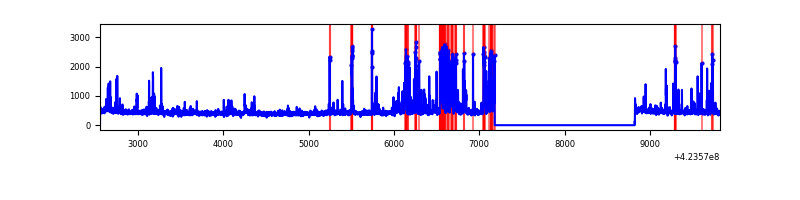 |
Top three noisy pixels from each quadrant. If the there are fewer than three noisy pixels in the level2.evt file, extra rows are filled as -1
| Pixel properties | Quadrant properties | ||||||
|---|---|---|---|---|---|---|---|
| Quadrant | DetID | PixID | Counts | Sigma | Mean | Median | Sigma |
| A | 10 | 83 | 545811 | 4252.12 | 623 | 609 | 128.2 |
| A | 14 | 235 | 44979 | 346.05 | 623 | 609 | 128.2 |
| A | 2 | 79 | 13896 | 103.63 | 623 | 609 | 128.2 |
| B | 0 | 186 | 466322 | 3927.81 | 613 | 596 | 118.6 |
| B | 0 | 189 | 99225 | 831.81 | 613 | 596 | 118.6 |
| B | 0 | 245 | 95257 | 798.35 | 613 | 596 | 118.6 |
| C | 0 | 10 | 488540 | 3517.7 | 592 | 594 | 138.7 |
| C | 15 | 214 | 244811 | 1760.61 | 592 | 594 | 138.7 |
| C | 13 | 61 | 3989 | 24.48 | 592 | 594 | 138.7 |
| D | 2 | 249 | 300059 | 2009.86 | 606 | 589 | 149.0 |
| D | 13 | 249 | 111556 | 744.74 | 606 | 589 | 149.0 |
| D | 5 | 222 | 97004 | 647.08 | 606 | 589 | 149.0 |
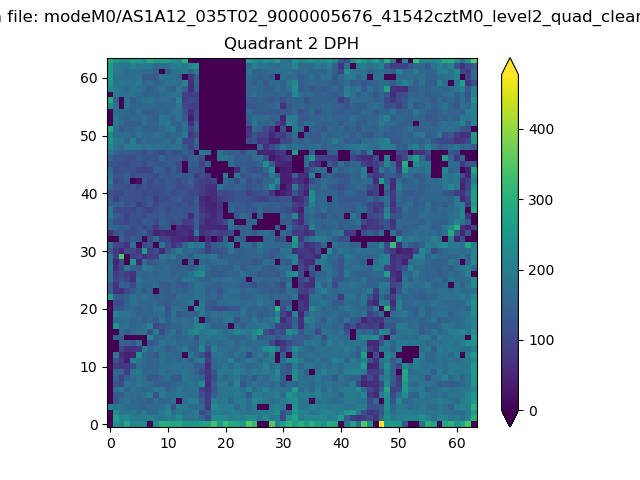
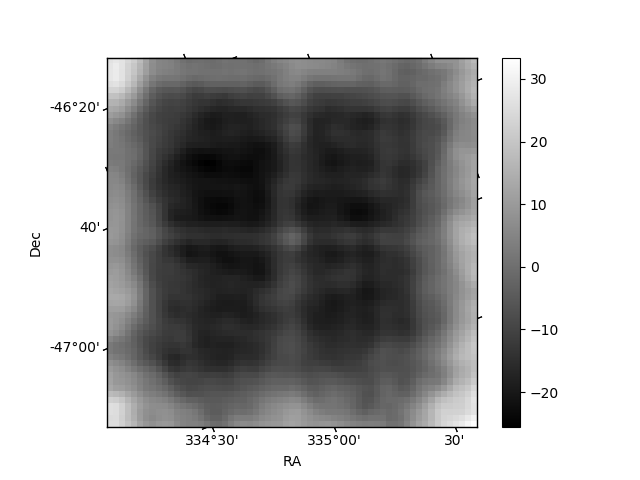
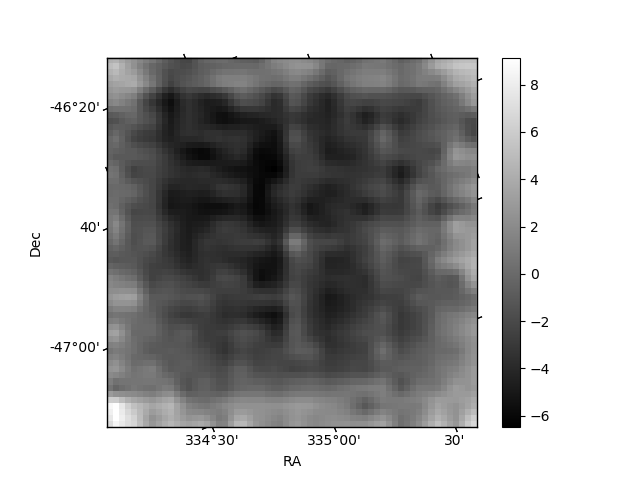
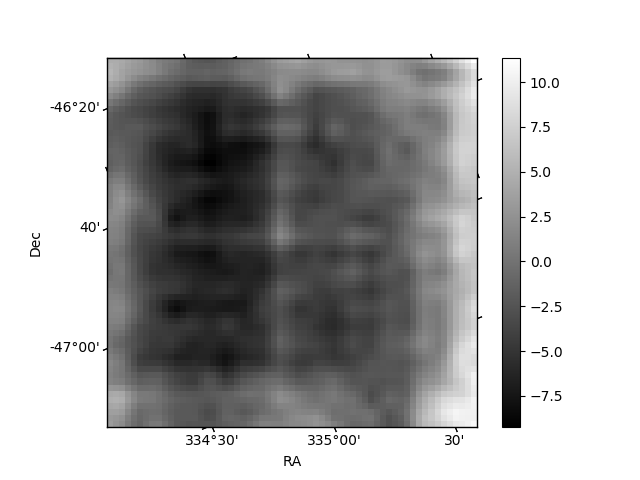
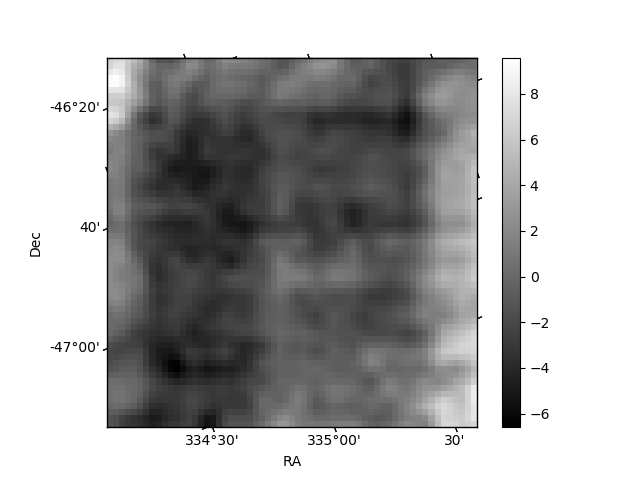
Histogram calculated using DETX and DETY for each event in the final _common_clean file
| Quadrant A | 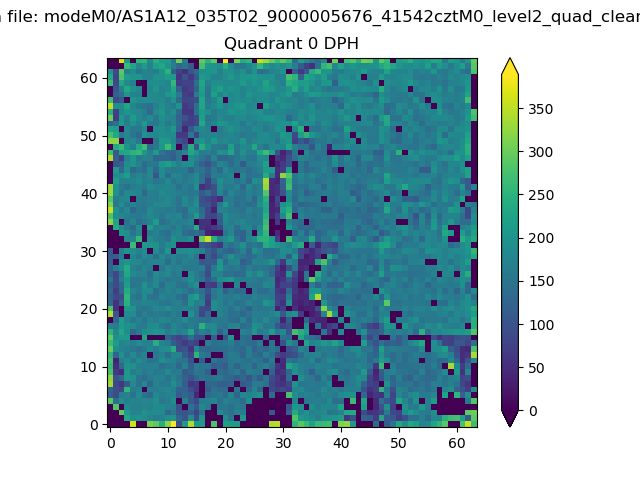 |
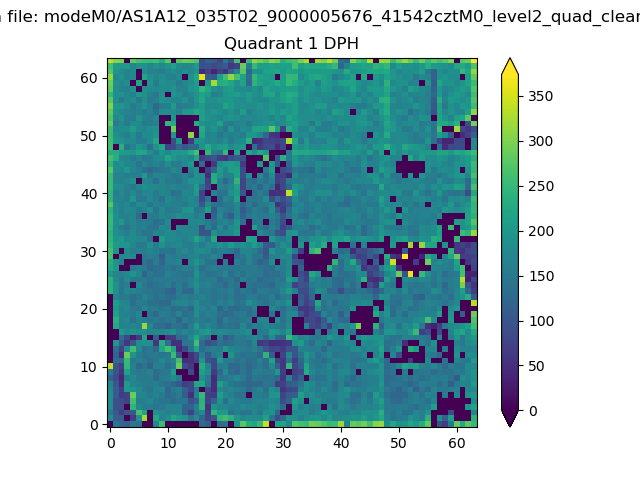 |
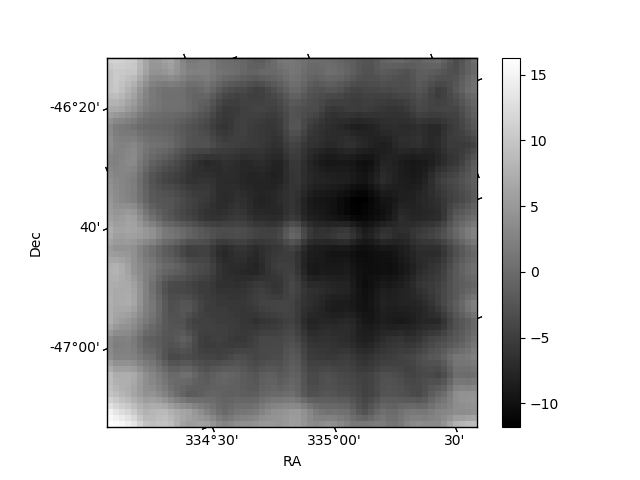
Quadrant B |
|---|---|---|---|
| Quadrant D | 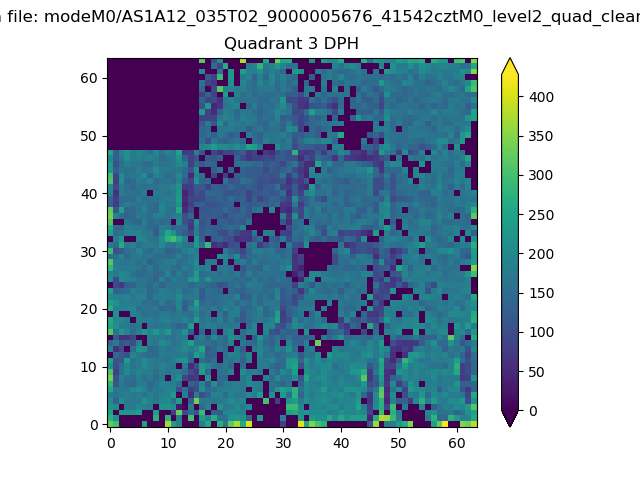 |
 |
Quadrant C |
| Plot type | Count rate plots | Images |
|---|---|---|
| Comparison with Poisson distribution Blue bars denote a histogram of data divided into 1 sec bins. Red curve is a Poisson curve with rate = median count rate of data. |
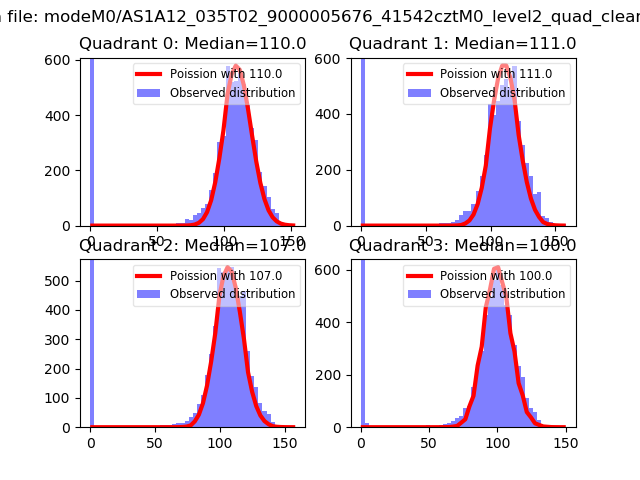 |
 |
| Quadrant-wise count rates Data is divided into 100 sec bins |
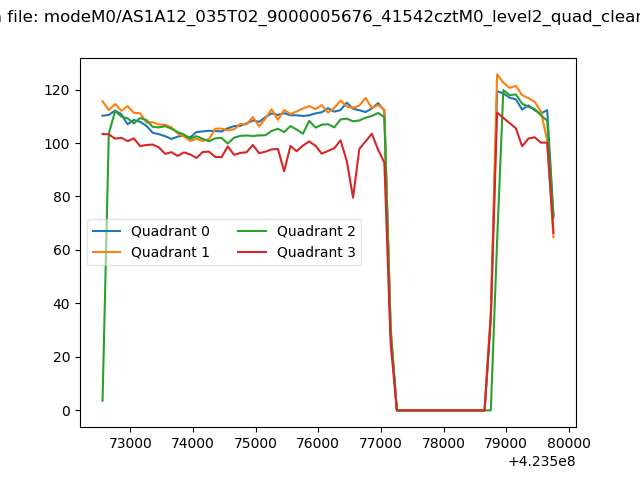 |
|
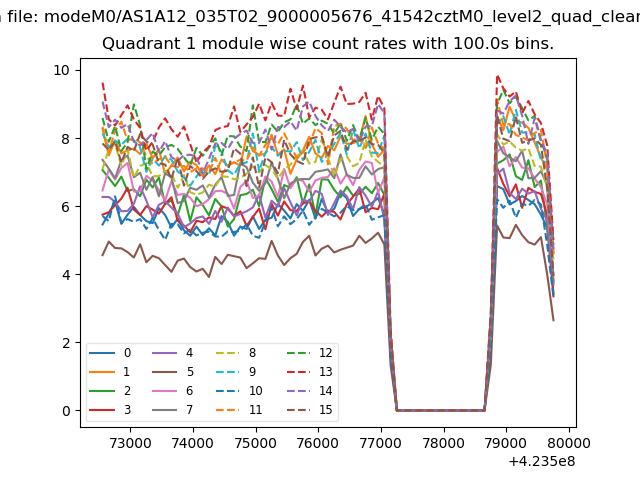
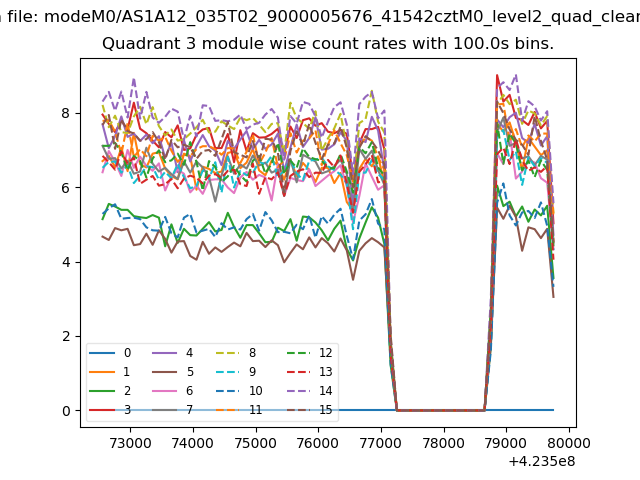
| Module-wise count rates for Quadrant A Data is divided into 100 sec bins |
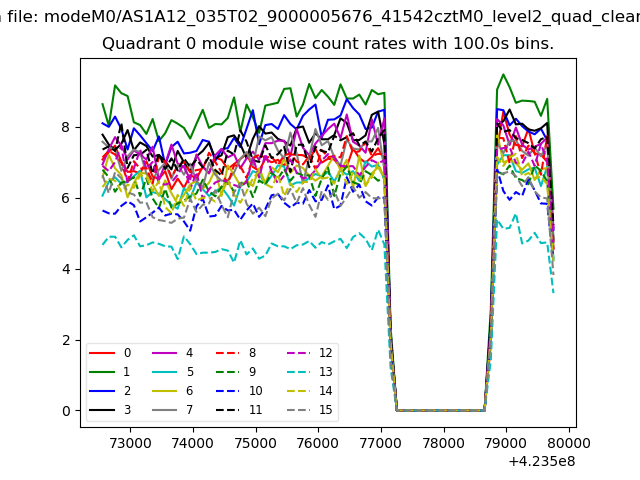 |
 |
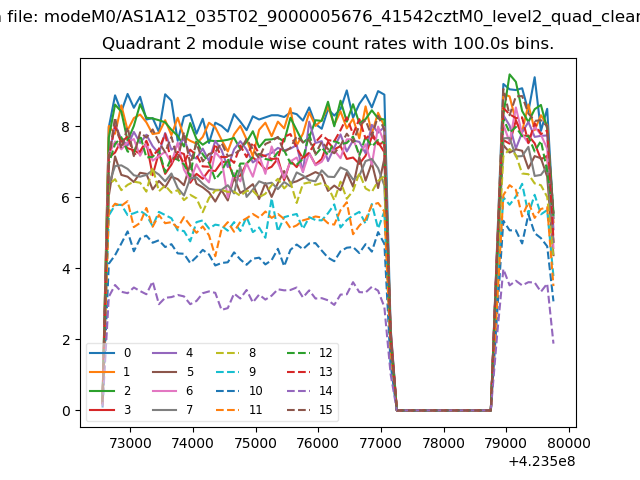
| Module-wise count rates for Quadrant B Data is divided into 100 sec bins |
 |
 |
| Module-wise count rates for Quadrant C Data is divided into 100 sec bins |
 |
 |
| Module-wise count rates for Quadrant D Data is divided into 100 sec bins |
 |
 |
| Parameter | Plot |
|---|---|
| CZT HV Monitor | 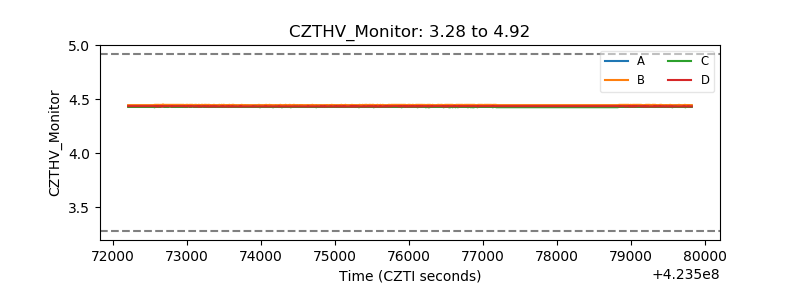 |
| D_VDD | 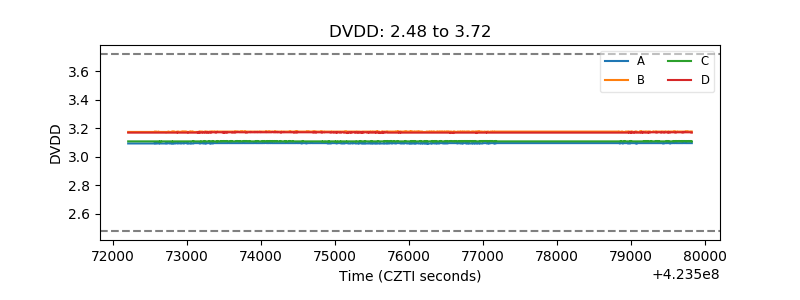 |
| Temperature 1 | 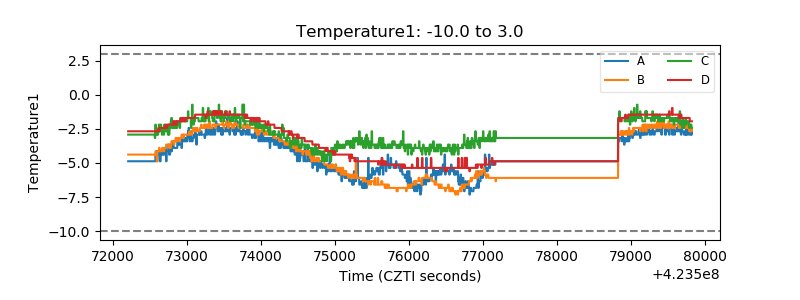 |
| Veto HV Monitor | 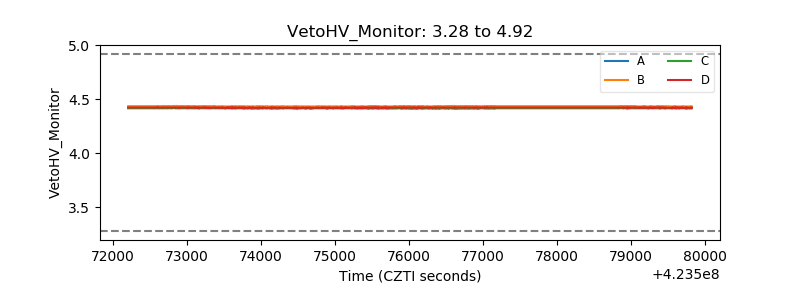 |
| Veto LLD | 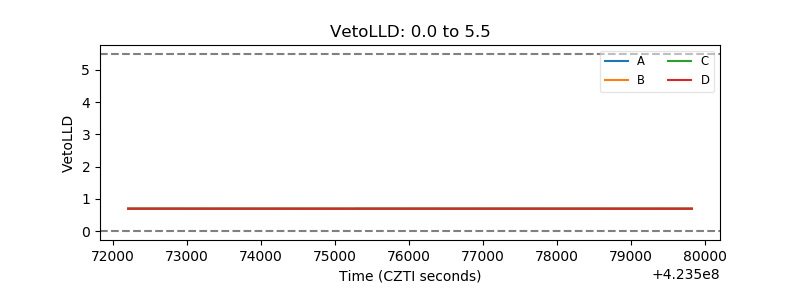 |
| Alpha Counter | 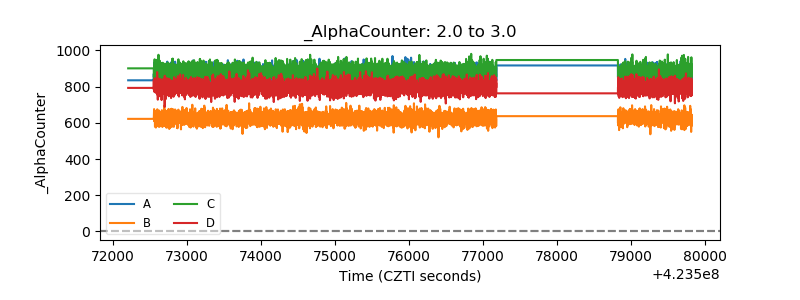 |
| _CPM_Rate | 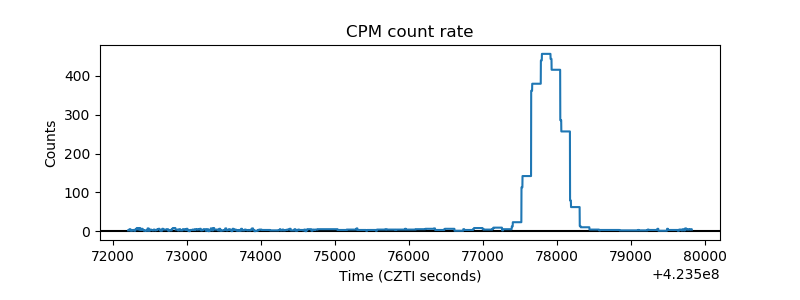 |
| CZT Counter | 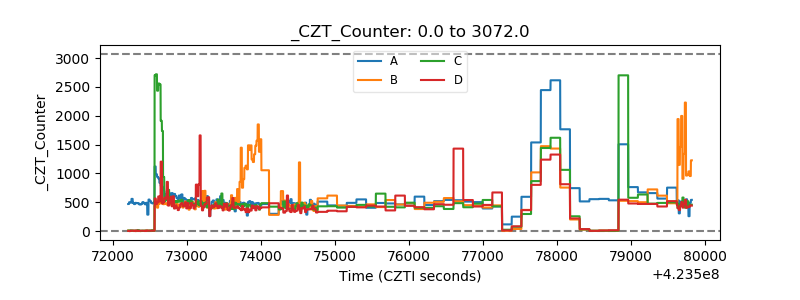 |
| +2.5 Volts monitor | 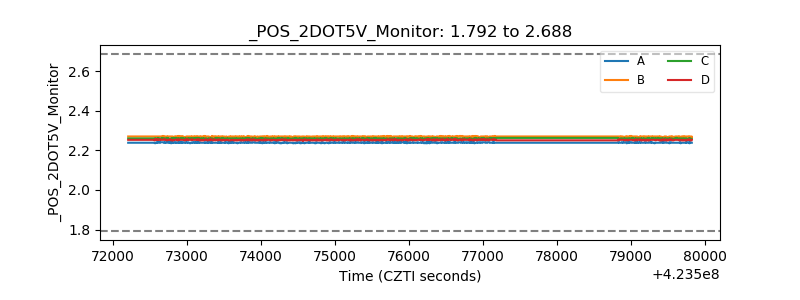 |
| +5 Volts monitor | 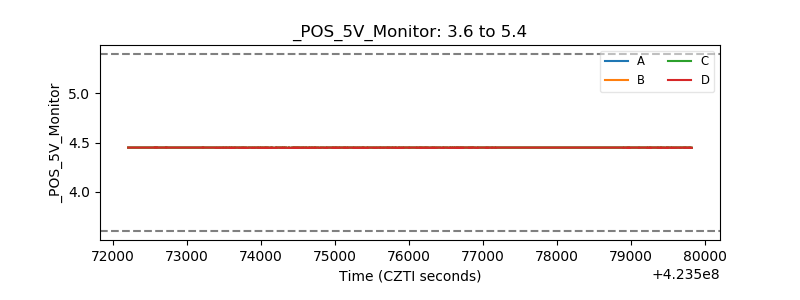 |
| _ROLL_ROT | 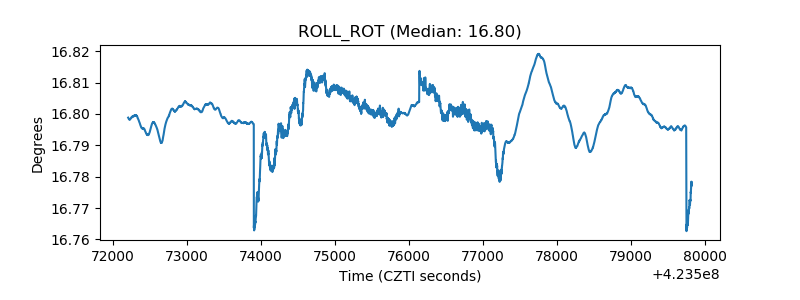 |
| _Roll_DEC | 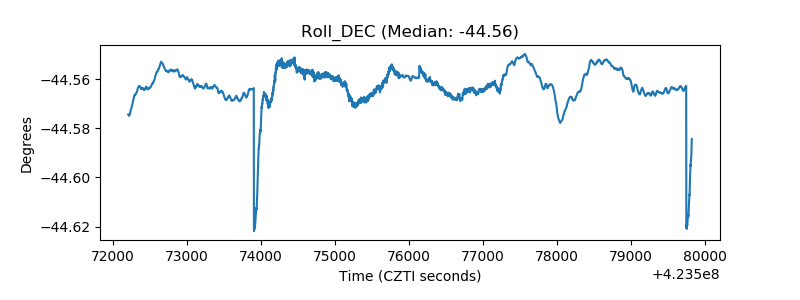 |
| _Roll_RA | 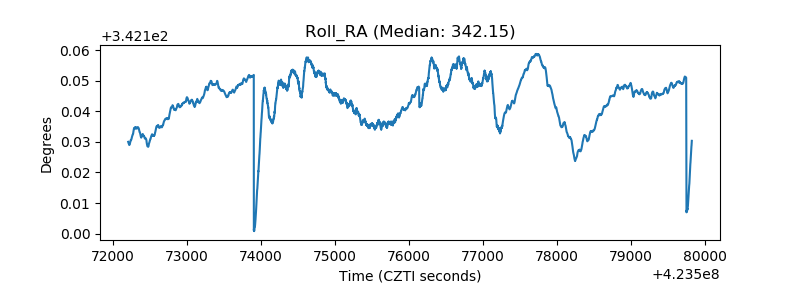 |
| Veto Counter | 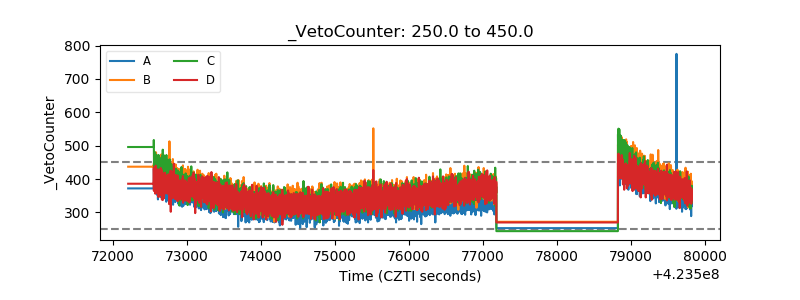 |