| Param | Original file | Final file |
|---|---|---|
| Filename | modeM0/AS1A12_035T02_9000005676_41544cztM0_level2.fits | modeM0/AS1A12_035T02_9000005676_41544cztM0_level2_quad_clean.evt |
| Size (bytes) | 348,958,080 | 91,869,120 |
| Size | 332.8 MB | 87.6 MB |
| Events in quadrant A | 2,989,868 | 628,982 |
| Events in quadrant B | 3,303,531 | 632,951 |
| Events in quadrant C | 3,028,307 | 584,051 |
| Events in quadrant D | 3,170,352 | 553,547 |
| Mode SS | |||
|---|---|---|---|
| Quadrant | BADHDUFLAG | Total packets | Discarded packets |
| A | 0 | 112 | 0 |
| B | 0 | 112 | 0 |
| C | 0 | 112 | 0 |
| D | 0 | 112 | 0 |
| Mode M0 | |||
|---|---|---|---|
| Quadrant | BADHDUFLAG | Total packets | Discarded packets |
| A | 0 | 12185 | 2 |
| B | 0 | 13527 | 2 |
| C | 0 | 12450 | 2 |
| D | 0 | 13294 | 2 |
| Mode M9 | |||
|---|---|---|---|
| Quadrant | BADHDUFLAG | Total packets | Discarded packets |
| A | 0 | 20 | 0 |
| B | 0 | 21 | 0 |
| C | 0 | 21 | 0 |
| D | 0 | 21 | 0 |
| Quadrant | Total seconds | Saturated seconds | Saturation percentage |
|---|---|---|---|
| A | 5457 | 21 | 0.384827% |
| B | 5457 | 119 | 2.180685% |
| C | 5457 | 200 | 3.665017% |
| D | 5457 | 192 | 3.518417% |
Noise dominated data is calculated using 1-second bins in cleaned event files. If a bin has >2000 counts, and if more than 50% of those come from <1% of pixels, then it is considered to be noise-dominated and hence unusable.
| Quadrant | # 1 sec bins | Bins with >0 counts | Bins with >2000 counts | High rate bins dominated by noise | Noise dominated (total time) | Noise dominated (detector-on time) | Marked lightcurve |
|---|---|---|---|---|---|---|---|
| A | 7219 | 5458 | 6 | 6 | 0.08% | 0.11% | 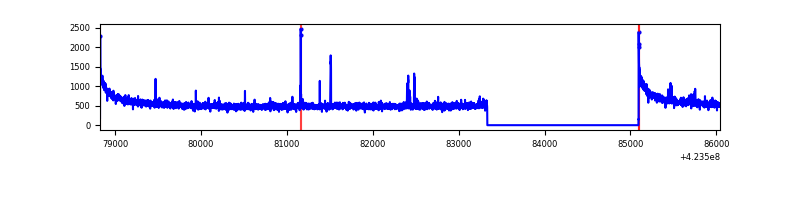 |
| B | 7219 | 5458 | 55 | 55 | 0.76% | 1.01% | 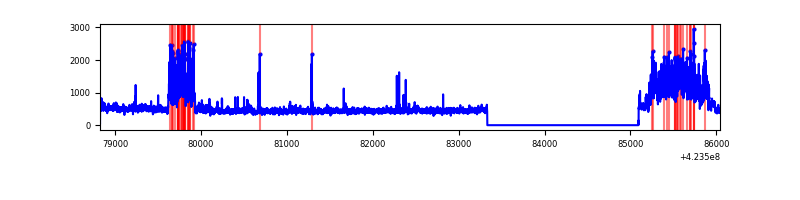 |
| C | 7219 | 5458 | 199 | 199 | 2.76% | 3.65% | 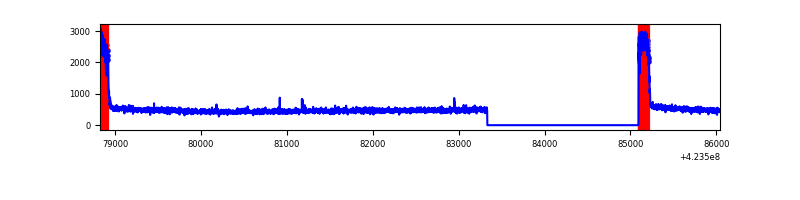 |
| D | 7219 | 5458 | 173 | 173 | 2.40% | 3.17% | 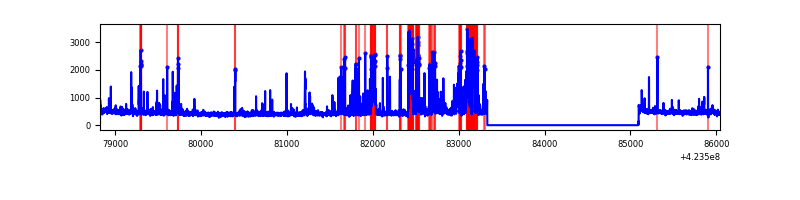 |
Top three noisy pixels from each quadrant. If the there are fewer than three noisy pixels in the level2.evt file, extra rows are filled as -1
| Pixel properties | Quadrant properties | ||||||
|---|---|---|---|---|---|---|---|
| Quadrant | DetID | PixID | Counts | Sigma | Mean | Median | Sigma |
| A | 10 | 83 | 541863 | 4369.03 | 615 | 602 | 123.9 |
| A | 14 | 235 | 44853 | 357.19 | 615 | 602 | 123.9 |
| A | 13 | 248 | 10979 | 83.76 | 615 | 602 | 123.9 |
| B | 0 | 186 | 662515 | 5730.25 | 604 | 587 | 115.5 |
| B | 0 | 189 | 164140 | 1415.86 | 604 | 587 | 115.5 |
| B | 0 | 245 | 60759 | 520.9 | 604 | 587 | 115.5 |
| C | 0 | 10 | 534178 | 3967.64 | 577 | 581 | 134.5 |
| C | 15 | 214 | 233480 | 1731.76 | 577 | 581 | 134.5 |
| C | 14 | 254 | 4697 | 30.61 | 577 | 581 | 134.5 |
| D | 13 | 249 | 575388 | 3993.45 | 589 | 572 | 143.9 |
| D | 2 | 249 | 148538 | 1027.97 | 589 | 572 | 143.9 |
| D | 12 | 6 | 60672 | 417.54 | 589 | 572 | 143.9 |
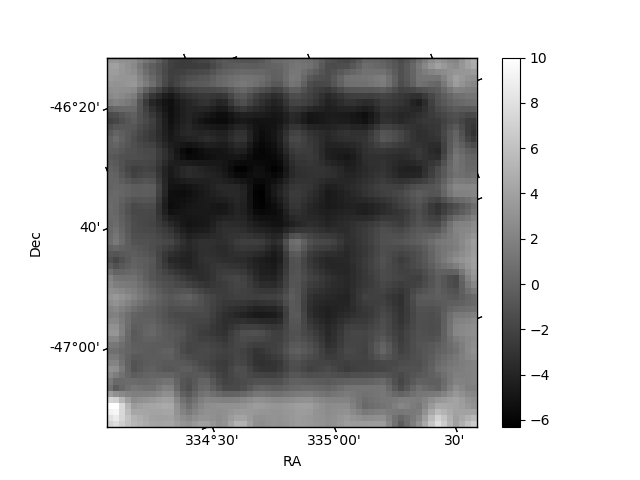
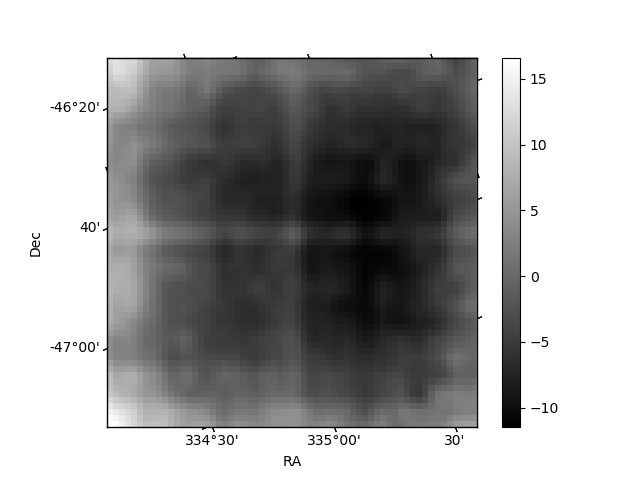
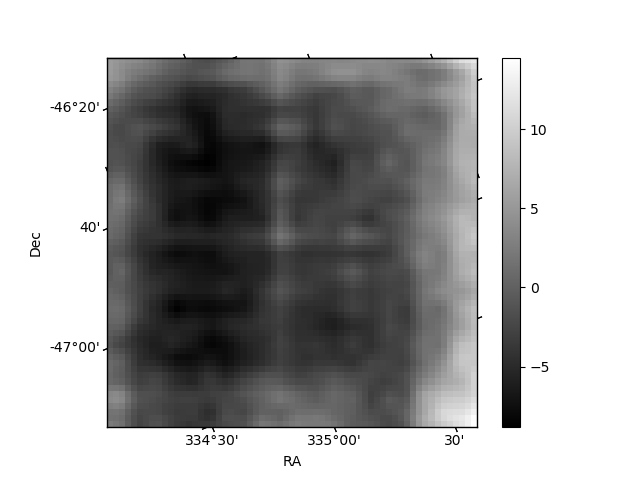
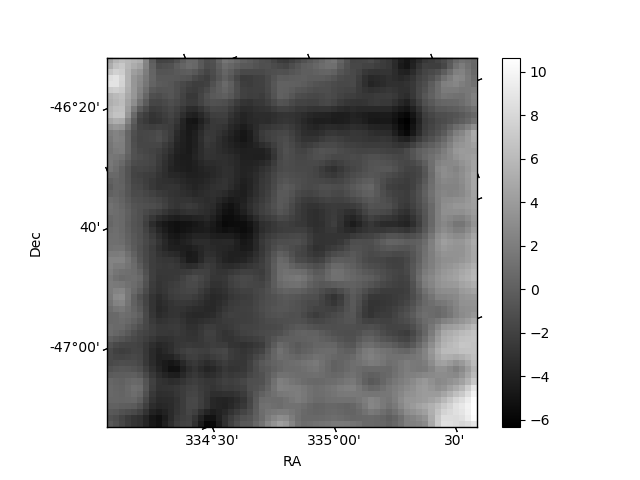
Histogram calculated using DETX and DETY for each event in the final _common_clean file
| Quadrant A | 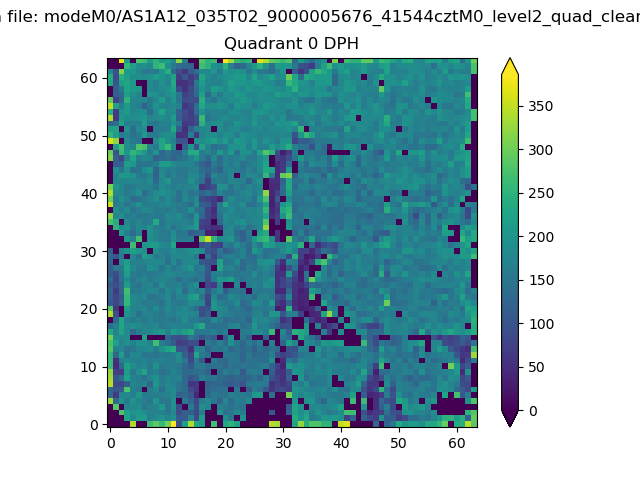 |
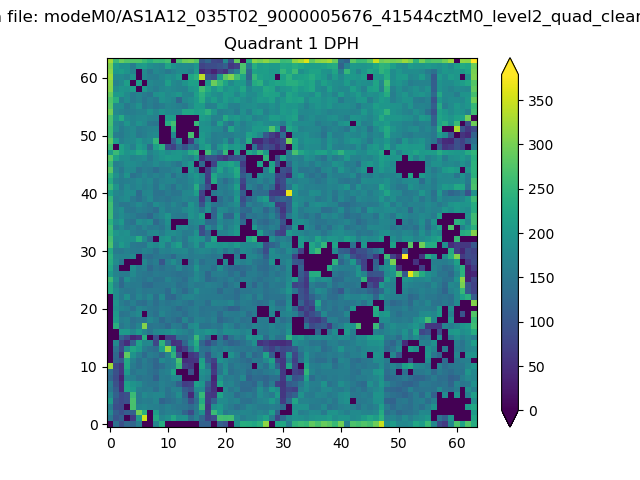 |
Quadrant B |
|---|---|---|---|
| Quadrant D | 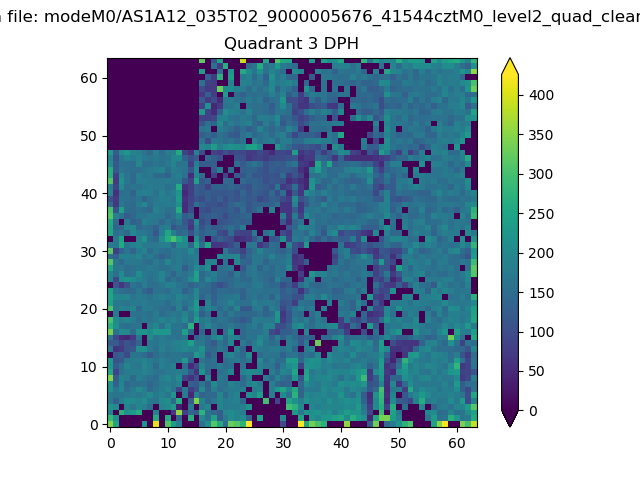 |
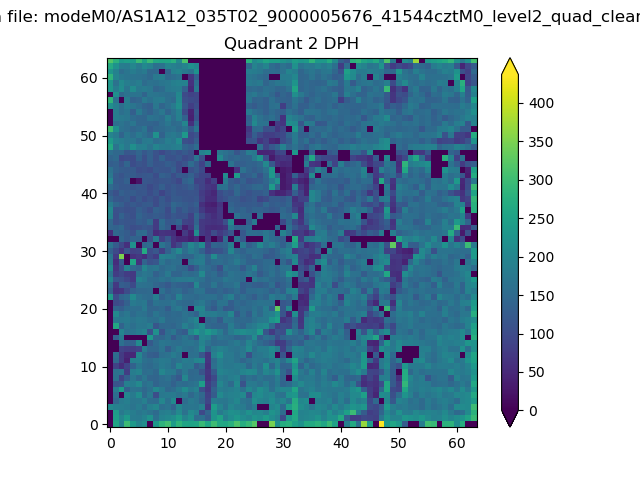 |
Quadrant C |
| Plot type | Count rate plots | Images |
|---|---|---|
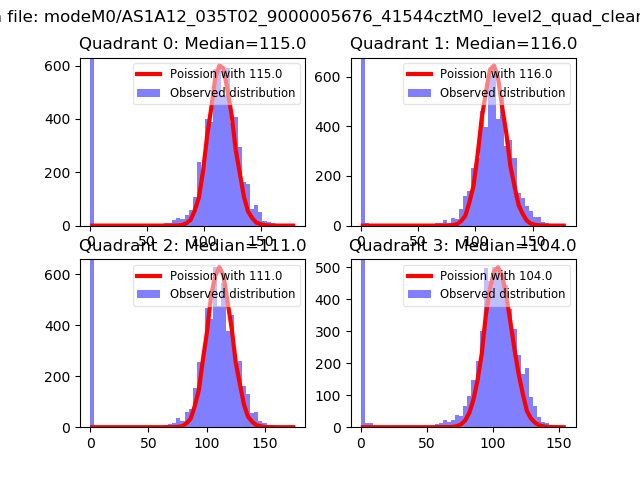
| Comparison with Poisson distribution Blue bars denote a histogram of data divided into 1 sec bins. Red curve is a Poisson curve with rate = median count rate of data. |
 |
 |
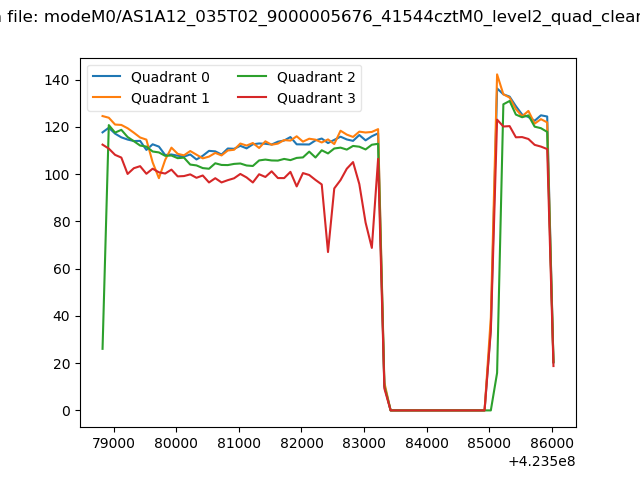
| Quadrant-wise count rates Data is divided into 100 sec bins |
 |
|
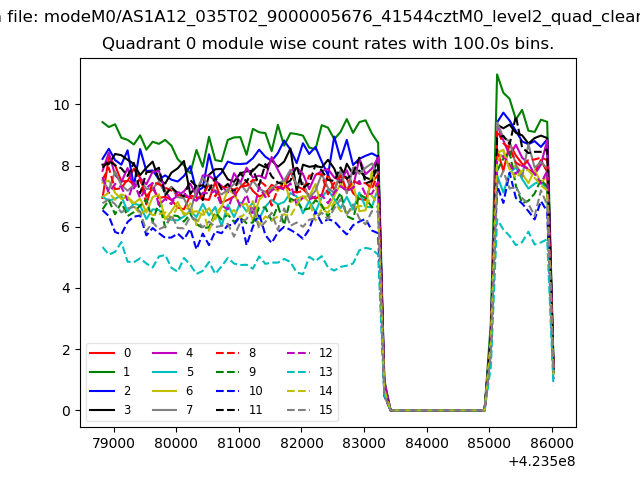
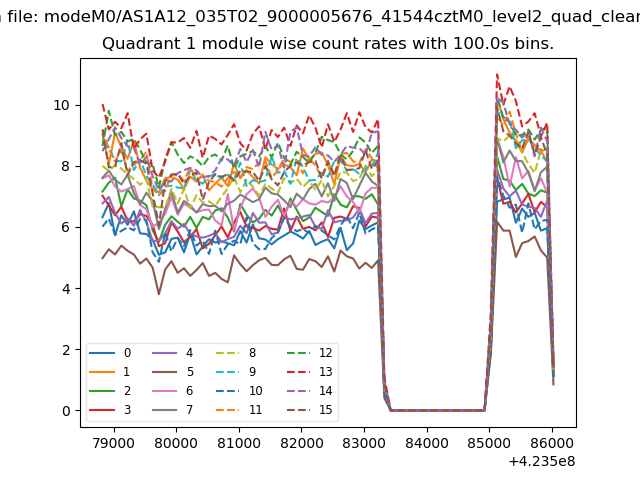
| Module-wise count rates for Quadrant A Data is divided into 100 sec bins |
 |
 |
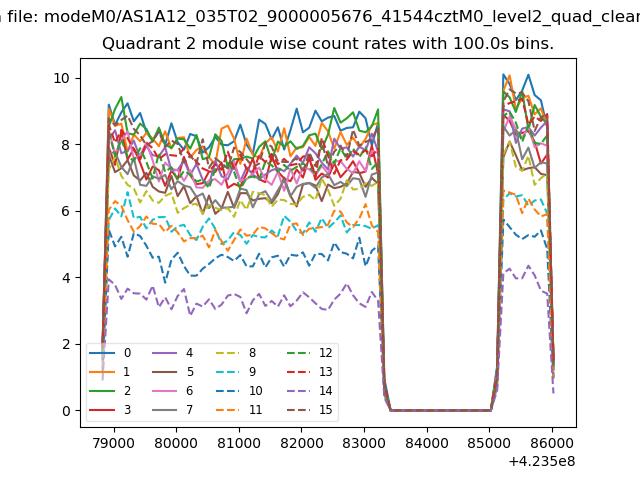
| Module-wise count rates for Quadrant B Data is divided into 100 sec bins |
 |
 |
| Module-wise count rates for Quadrant C Data is divided into 100 sec bins |
 |
 |
| Module-wise count rates for Quadrant D Data is divided into 100 sec bins |
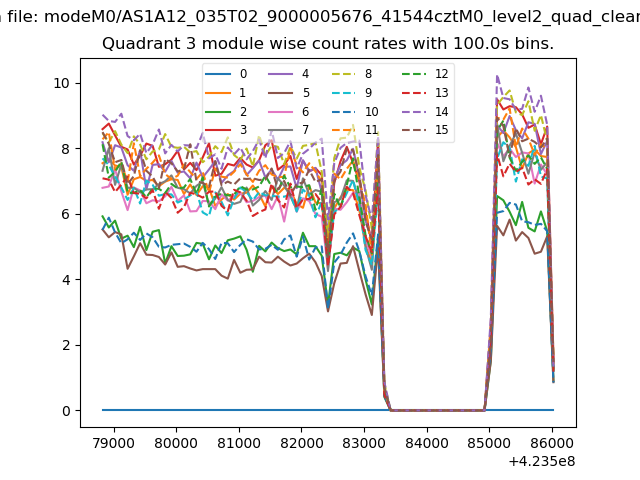 |
 |
| Parameter | Plot |
|---|---|
| CZT HV Monitor | 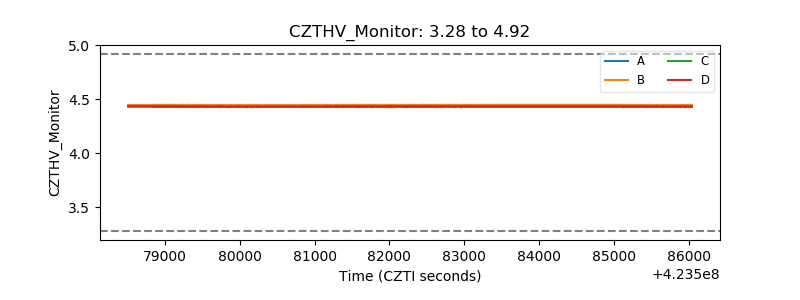 |
| D_VDD | 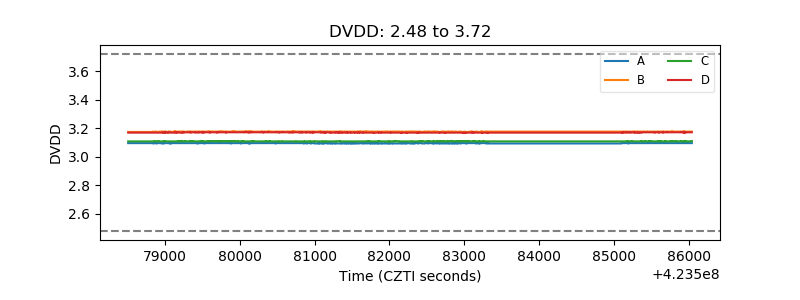 |
| Temperature 1 | 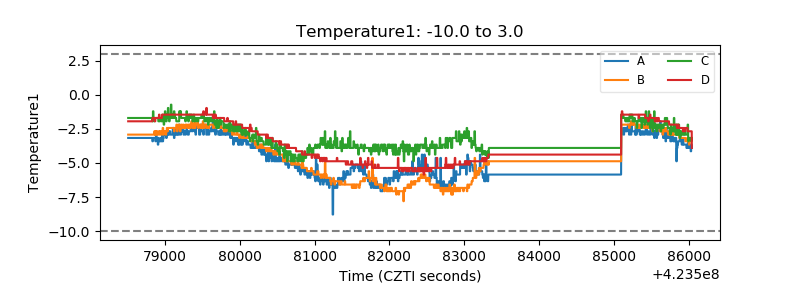 |
| Veto HV Monitor | 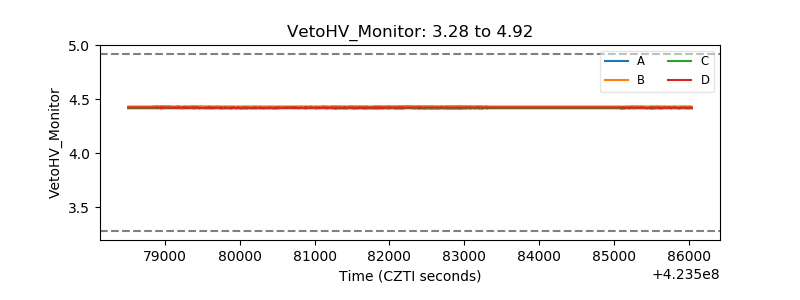 |
| Veto LLD | 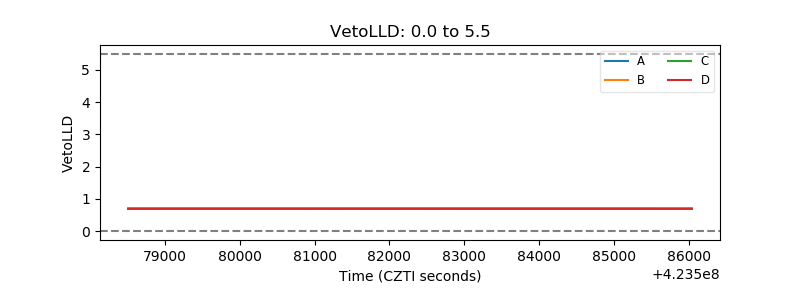 |
| Alpha Counter | 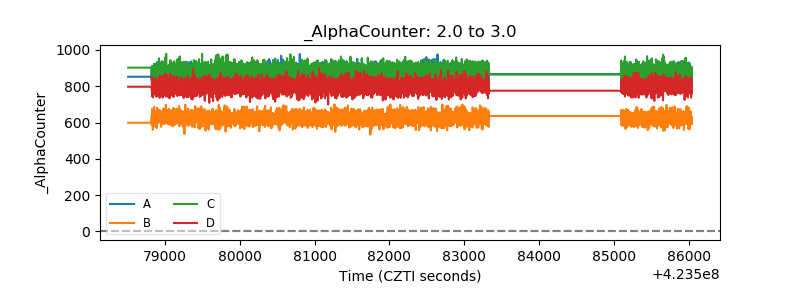 |
| _CPM_Rate | 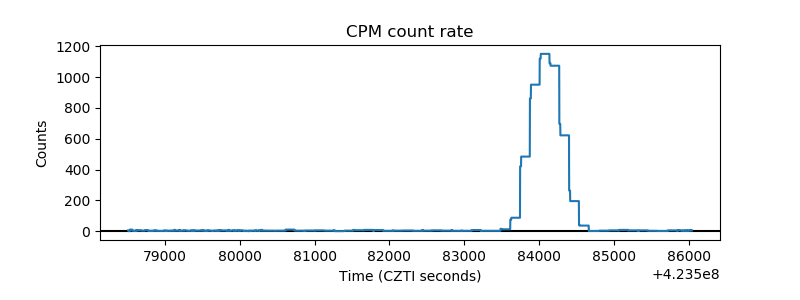 |
| CZT Counter | 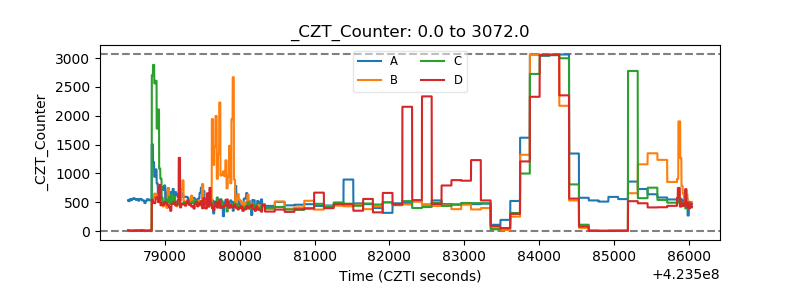 |
| +2.5 Volts monitor |  |
| +5 Volts monitor | 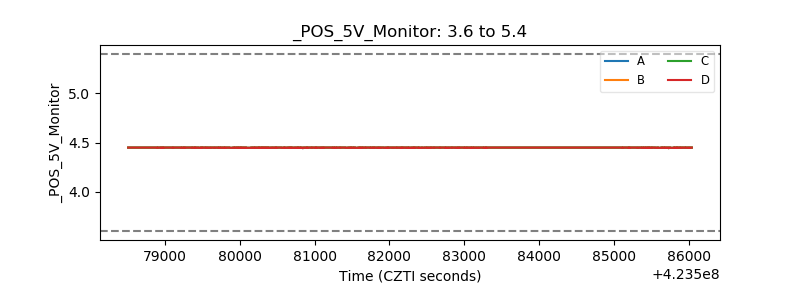 |
| _ROLL_ROT | 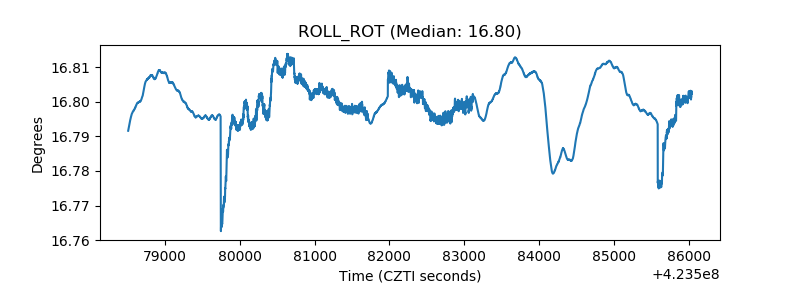 |
| _Roll_DEC | 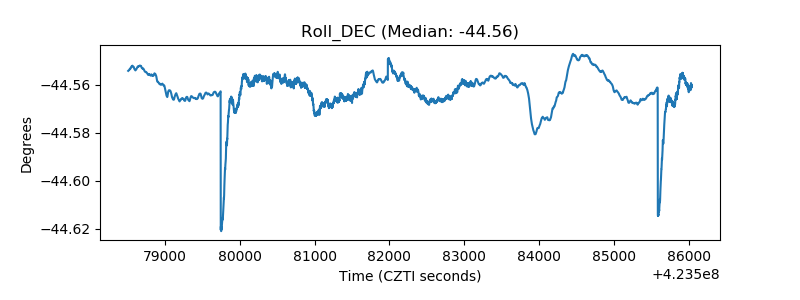 |
| _Roll_RA | 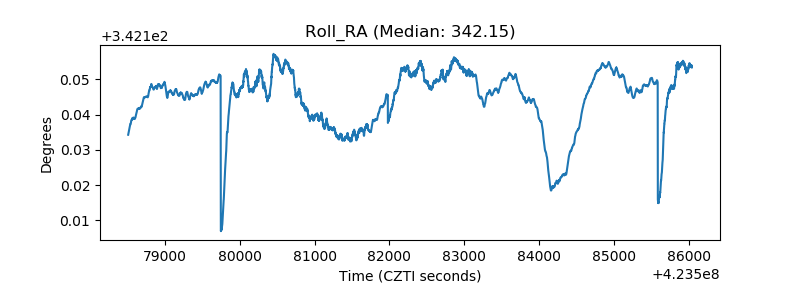 |
| Veto Counter | 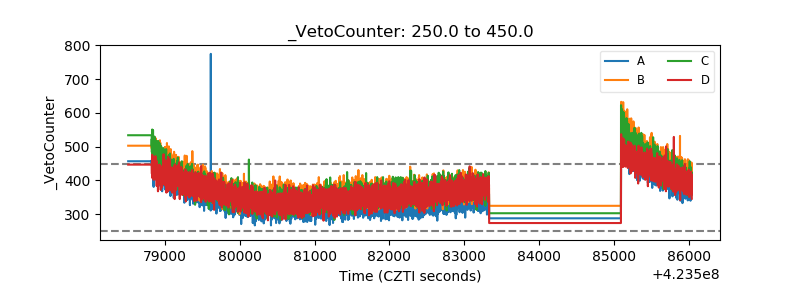 |