| Param | Original file | Final file |
|---|---|---|
| Filename | modeM0/AS1A12_035T02_9000005676_41545cztM0_level2.fits | modeM0/AS1A12_035T02_9000005676_41545cztM0_level2_quad_clean.evt |
| Size (bytes) | 339,886,080 | 92,064,960 |
| Size | 324.1 MB | 87.8 MB |
| Events in quadrant A | 2,916,781 | 639,477 |
| Events in quadrant B | 3,224,310 | 644,475 |
| Events in quadrant C | 2,996,091 | 581,878 |
| Events in quadrant D | 3,041,517 | 559,645 |
| Mode SS | |||
|---|---|---|---|
| Quadrant | BADHDUFLAG | Total packets | Discarded packets |
| A | 0 | 106 | 0 |
| B | 0 | 106 | 0 |
| C | 0 | 106 | 0 |
| D | 0 | 106 | 0 |
| Mode M0 | |||
|---|---|---|---|
| Quadrant | BADHDUFLAG | Total packets | Discarded packets |
| A | 0 | 11844 | 2 |
| B | 0 | 13085 | 2 |
| C | 0 | 12039 | 2 |
| D | 0 | 12627 | 2 |
| Mode M9 | |||
|---|---|---|---|
| Quadrant | BADHDUFLAG | Total packets | Discarded packets |
| A | 0 | 22 | 0 |
| B | 0 | 23 | 0 |
| C | 0 | 23 | 0 |
| D | 0 | 23 | 0 |
| Quadrant | Total seconds | Saturated seconds | Saturation percentage |
|---|---|---|---|
| A | 5172 | 20 | 0.386698% |
| B | 5171 | 96 | 1.856507% |
| C | 5171 | 215 | 4.157803% |
| D | 5171 | 130 | 2.514020% |
Noise dominated data is calculated using 1-second bins in cleaned event files. If a bin has >2000 counts, and if more than 50% of those come from <1% of pixels, then it is considered to be noise-dominated and hence unusable.
| Quadrant | # 1 sec bins | Bins with >0 counts | Bins with >2000 counts | High rate bins dominated by noise | Noise dominated (total time) | Noise dominated (detector-on time) | Marked lightcurve |
|---|---|---|---|---|---|---|---|
| A | 7085 | 5173 | 4 | 4 | 0.06% | 0.08% | 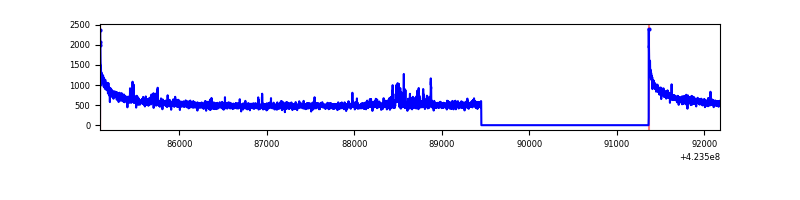 |
| B | 7084 | 5172 | 30 | 30 | 0.42% | 0.58% | 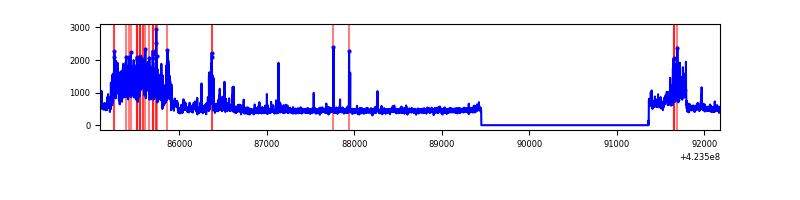 |
| C | 7084 | 5172 | 210 | 210 | 2.96% | 4.06% | 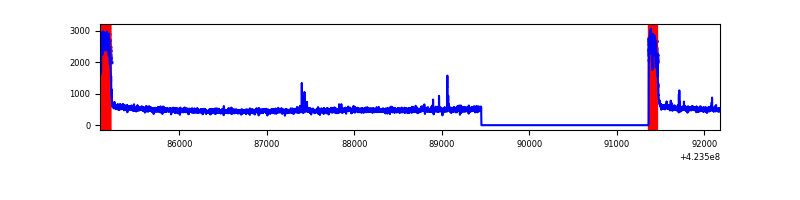 |
| D | 7084 | 5172 | 116 | 116 | 1.64% | 2.24% | 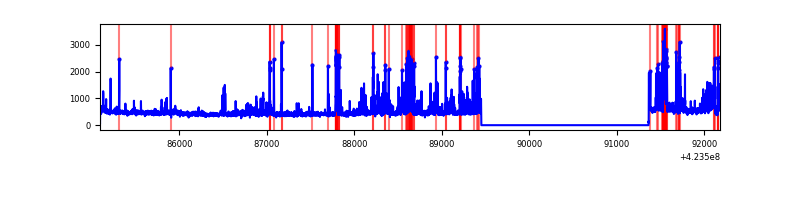 |
Top three noisy pixels from each quadrant. If the there are fewer than three noisy pixels in the level2.evt file, extra rows are filled as -1
| Pixel properties | Quadrant properties | ||||||
|---|---|---|---|---|---|---|---|
| Quadrant | DetID | PixID | Counts | Sigma | Mean | Median | Sigma |
| A | 10 | 83 | 525094 | 4301.0 | 601 | 589 | 121.9 |
| A | 14 | 235 | 57063 | 463.09 | 601 | 589 | 121.9 |
| A | 13 | 254 | 8684 | 66.38 | 601 | 589 | 121.9 |
| B | 0 | 186 | 563855 | 5017.22 | 593 | 578 | 112.3 |
| B | 0 | 189 | 150716 | 1337.31 | 593 | 578 | 112.3 |
| B | 0 | 245 | 83607 | 739.56 | 593 | 578 | 112.3 |
| C | 0 | 10 | 561199 | 4326.22 | 560 | 564 | 129.6 |
| C | 15 | 214 | 222232 | 1710.53 | 560 | 564 | 129.6 |
| C | 9 | 54 | 11602 | 85.18 | 560 | 564 | 129.6 |
| D | 13 | 249 | 372348 | 2665.7 | 575 | 560 | 139.5 |
| D | 2 | 249 | 185739 | 1327.72 | 575 | 560 | 139.5 |
| D | 12 | 6 | 97533 | 695.29 | 575 | 560 | 139.5 |
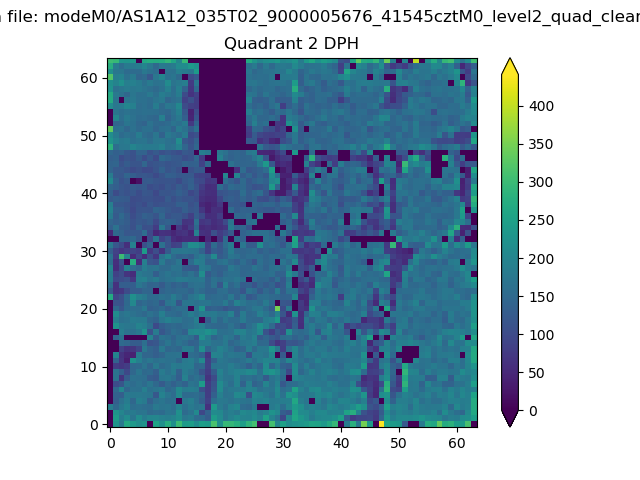
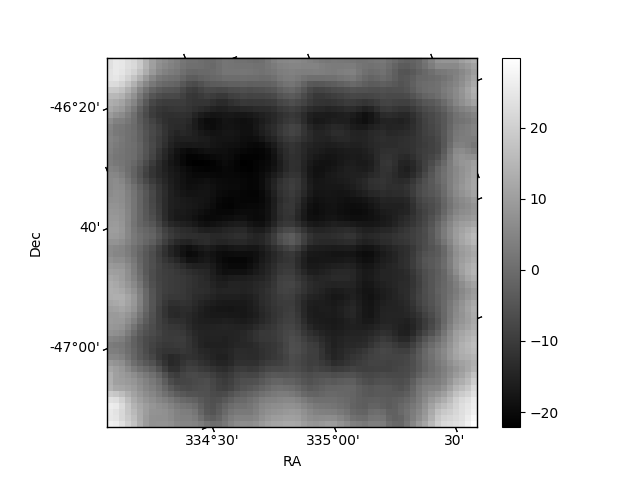
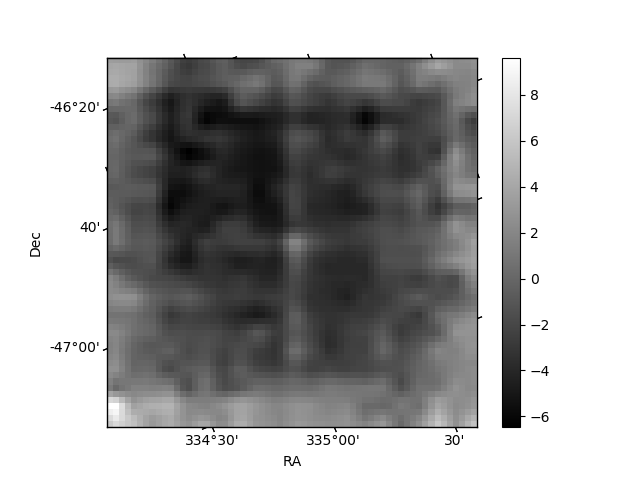
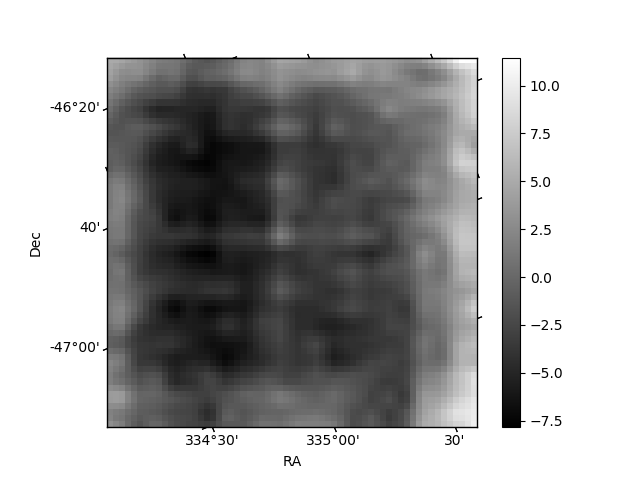
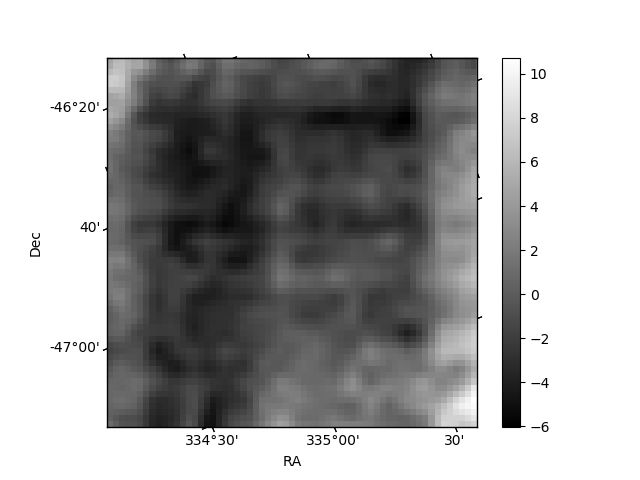
Histogram calculated using DETX and DETY for each event in the final _common_clean file
| Quadrant A | 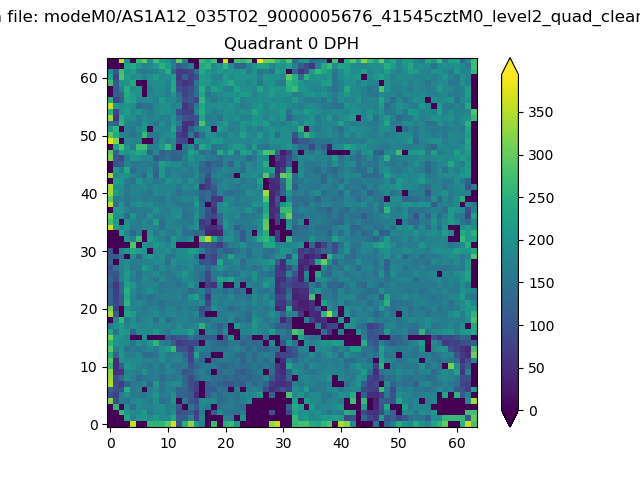 |
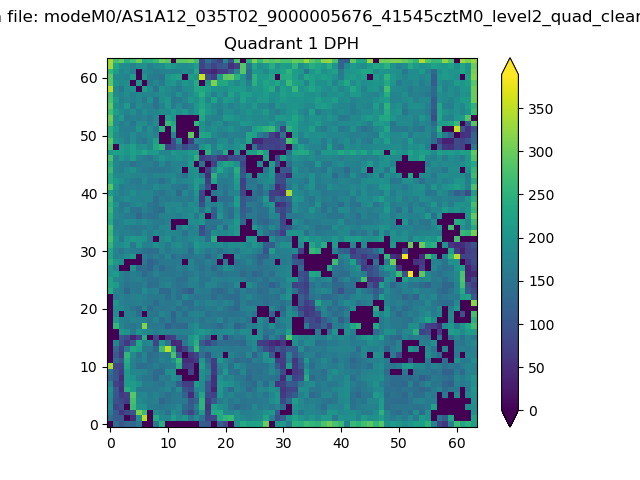 |
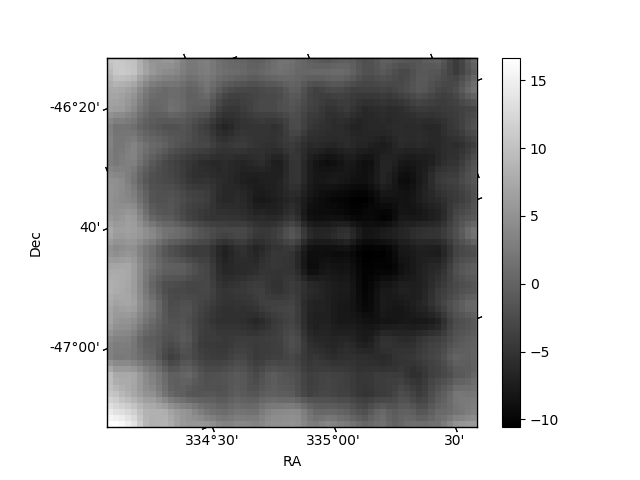
Quadrant B |
|---|---|---|---|
| Quadrant D | 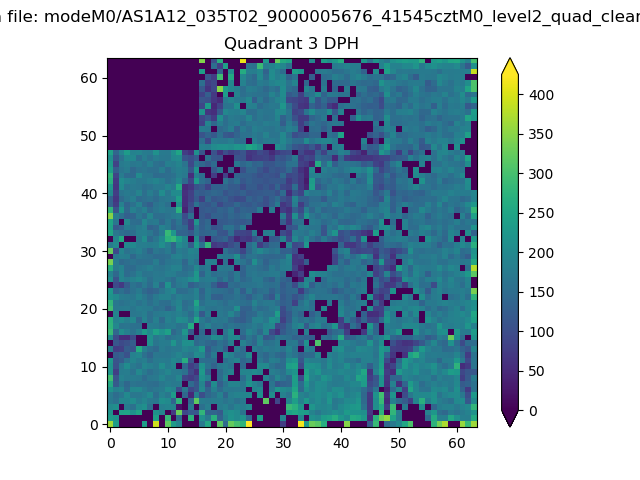 |
 |
Quadrant C |
| Plot type | Count rate plots | Images |
|---|---|---|
| Comparison with Poisson distribution Blue bars denote a histogram of data divided into 1 sec bins. Red curve is a Poisson curve with rate = median count rate of data. |
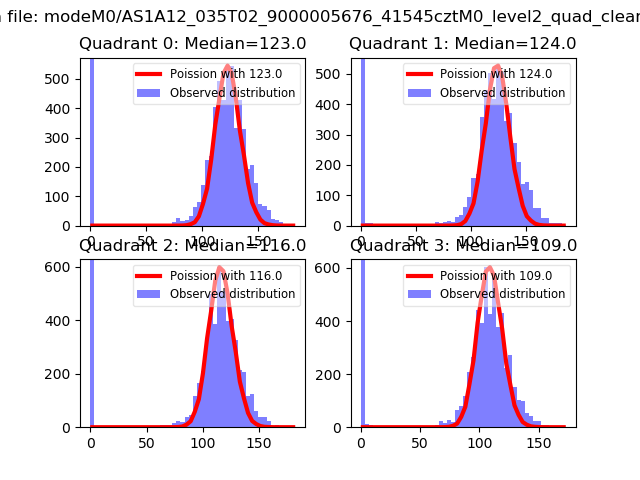 |
 |
| Quadrant-wise count rates Data is divided into 100 sec bins |
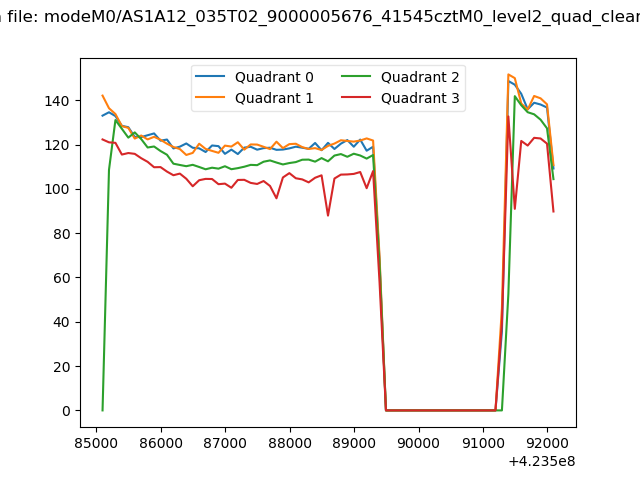 |
|
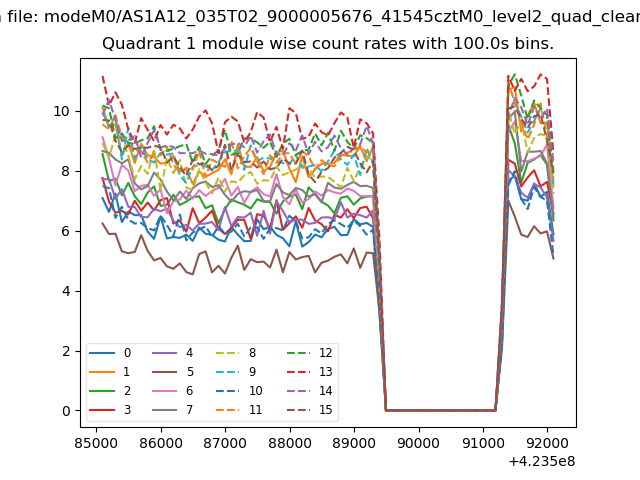
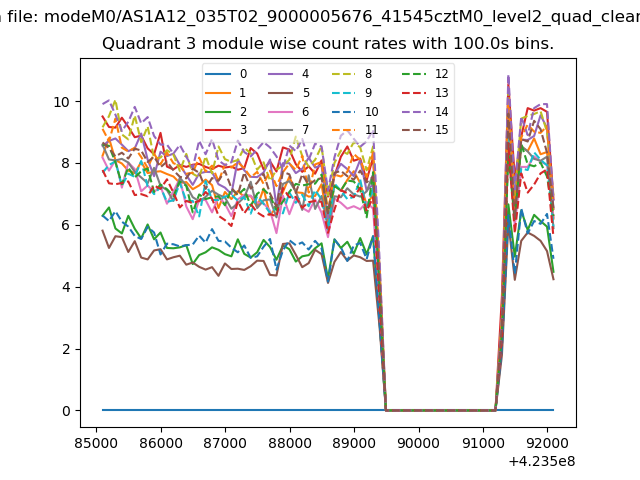
| Module-wise count rates for Quadrant A Data is divided into 100 sec bins |
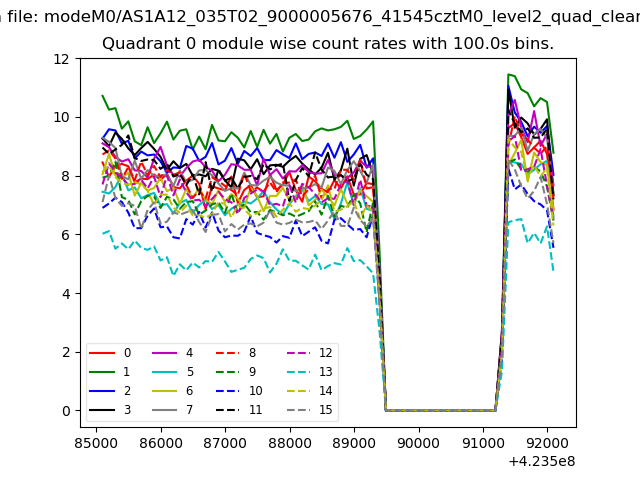 |
 |
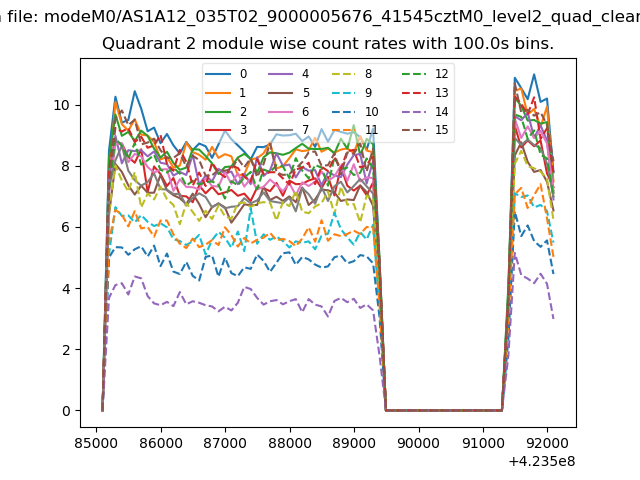
| Module-wise count rates for Quadrant B Data is divided into 100 sec bins |
 |
 |
| Module-wise count rates for Quadrant C Data is divided into 100 sec bins |
 |
 |
| Module-wise count rates for Quadrant D Data is divided into 100 sec bins |
 |
 |
| Parameter | Plot |
|---|---|
| CZT HV Monitor | 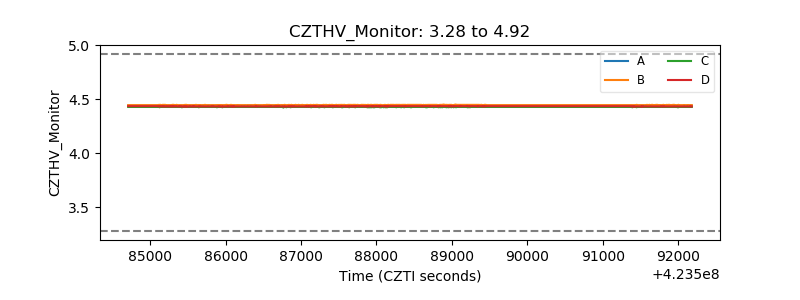 |
| D_VDD | 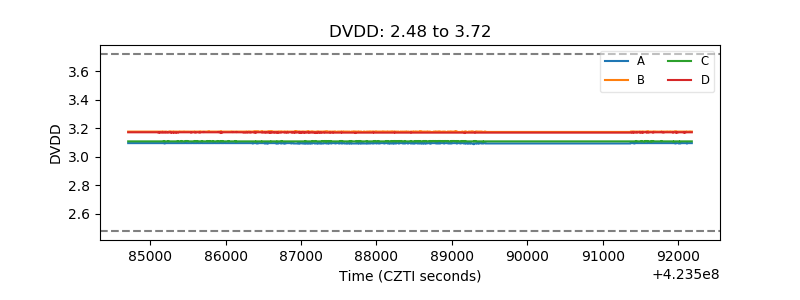 |
| Temperature 1 | 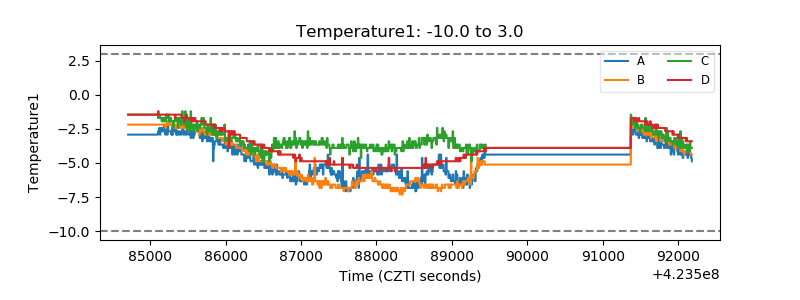 |
| Veto HV Monitor | 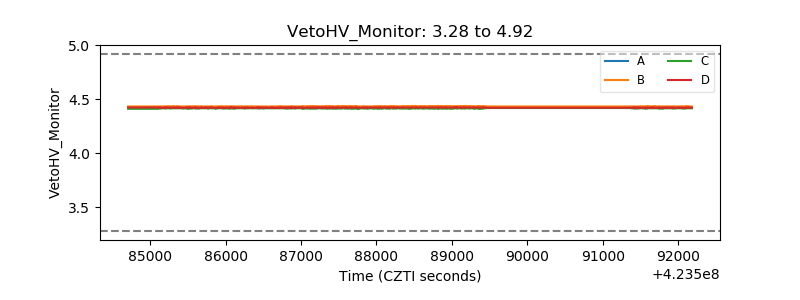 |
| Veto LLD | 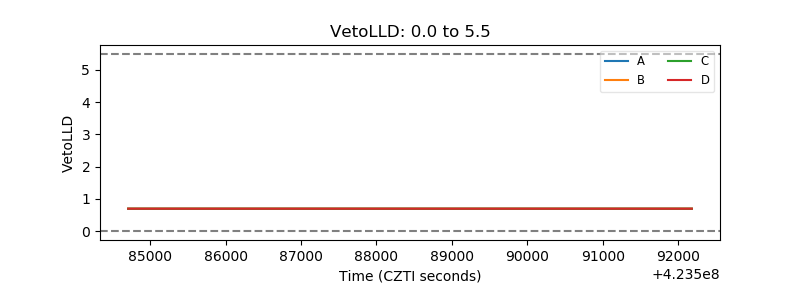 |
| Alpha Counter | 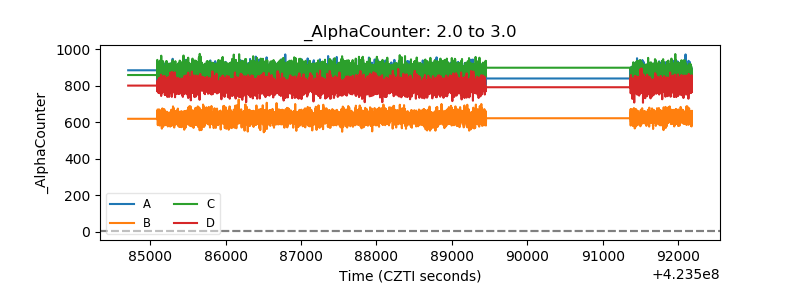 |
| _CPM_Rate | 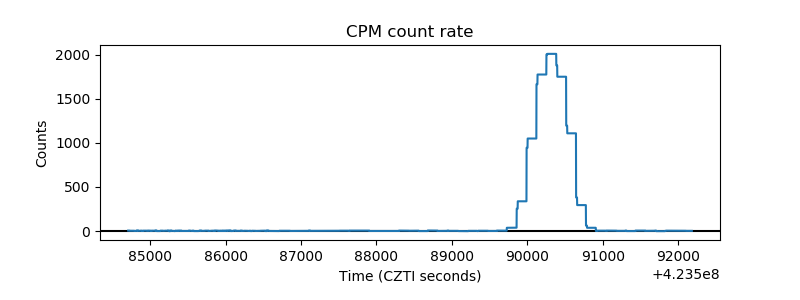 |
| CZT Counter | 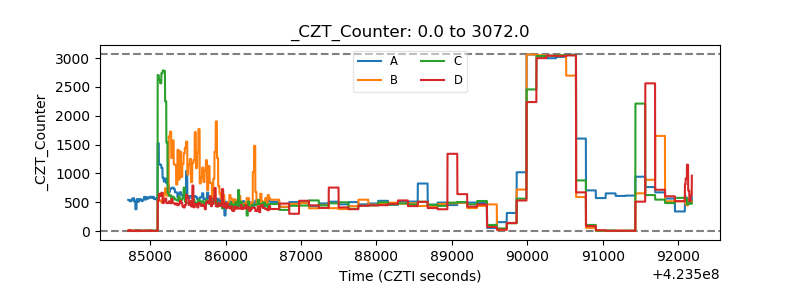 |
| +2.5 Volts monitor | 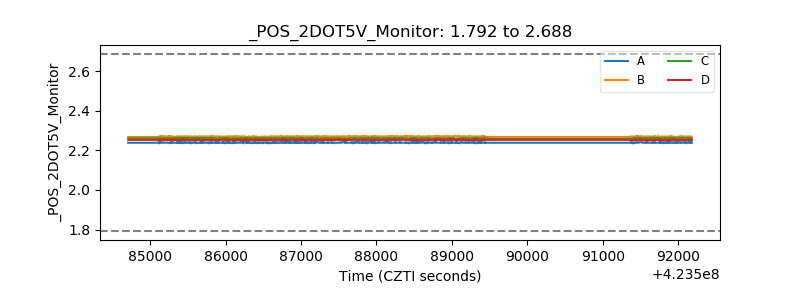 |
| +5 Volts monitor | 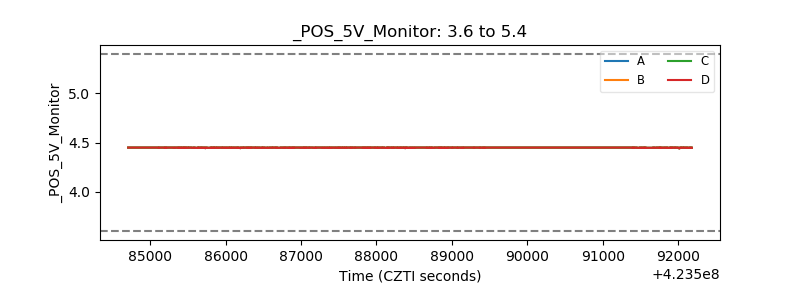 |
| _ROLL_ROT | 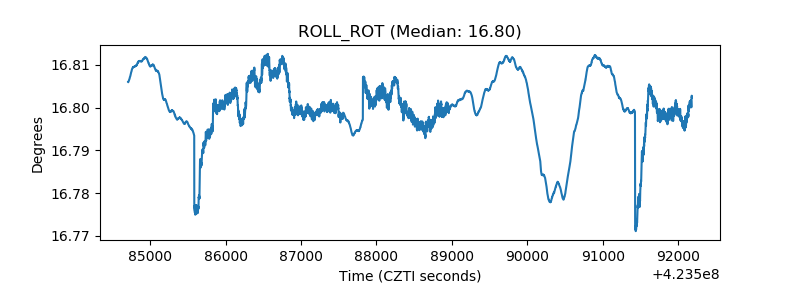 |
| _Roll_DEC |  |
| _Roll_RA | 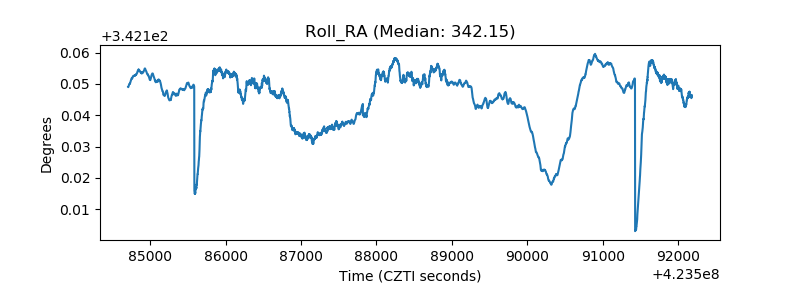 |
| Veto Counter | 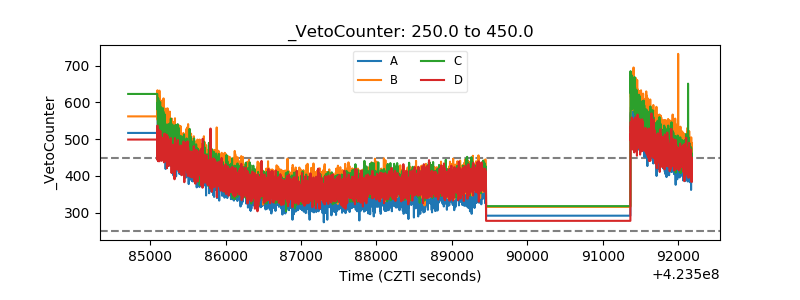 |