| Param | Original file | Final file |
|---|---|---|
| Filename | modeM0/AS1A12_035T02_9000005676_41546cztM0_level2.fits | modeM0/AS1A12_035T02_9000005676_41546cztM0_level2_quad_clean.evt |
| Size (bytes) | 336,847,680 | 90,915,840 |
| Size | 321.2 MB | 86.7 MB |
| Events in quadrant A | 2,731,110 | 640,907 |
| Events in quadrant B | 2,688,091 | 646,958 |
| Events in quadrant C | 2,817,738 | 585,188 |
| Events in quadrant D | 3,848,518 | 535,405 |
| Mode SS | |||
|---|---|---|---|
| Quadrant | BADHDUFLAG | Total packets | Discarded packets |
| A | 0 | 98 | 0 |
| B | 0 | 98 | 0 |
| C | 0 | 98 | 0 |
| D | 0 | 98 | 0 |
| Mode M0 | |||
|---|---|---|---|
| Quadrant | BADHDUFLAG | Total packets | Discarded packets |
| A | 0 | 11047 | 2 |
| B | 0 | 11080 | 1 |
| C | 0 | 11196 | 1 |
| D | 0 | 14674 | 1 |
| Mode M9 | |||
|---|---|---|---|
| Quadrant | BADHDUFLAG | Total packets | Discarded packets |
| A | 0 | 21 | 0 |
| B | 0 | 21 | 0 |
| C | 0 | 21 | 0 |
| D | 0 | 21 | 0 |
| Quadrant | Total seconds | Saturated seconds | Saturation percentage |
|---|---|---|---|
| A | 4922 | 9 | 0.182852% |
| B | 4923 | 36 | 0.731261% |
| C | 4923 | 150 | 3.046923% |
| D | 4923 | 342 | 6.946984% |
Noise dominated data is calculated using 1-second bins in cleaned event files. If a bin has >2000 counts, and if more than 50% of those come from <1% of pixels, then it is considered to be noise-dominated and hence unusable.
| Quadrant | # 1 sec bins | Bins with >0 counts | Bins with >2000 counts | High rate bins dominated by noise | Noise dominated (total time) | Noise dominated (detector-on time) | Marked lightcurve |
|---|---|---|---|---|---|---|---|
| A | 6956 | 4923 | 3 | 3 | 0.04% | 0.06% |  |
| B | 6957 | 4924 | 16 | 16 | 0.23% | 0.32% |  |
| C | 6957 | 4924 | 142 | 142 | 2.04% | 2.88% |  |
| D | 6957 | 4924 | 344 | 344 | 4.94% | 6.99% |  |
Top three noisy pixels from each quadrant. If the there are fewer than three noisy pixels in the level2.evt file, extra rows are filled as -1
| Pixel properties | Quadrant properties | ||||||
|---|---|---|---|---|---|---|---|
| Quadrant | DetID | PixID | Counts | Sigma | Mean | Median | Sigma |
| A | 10 | 83 | 464047 | 3893.66 | 584 | 574 | 119.0 |
| A | 13 | 254 | 8547 | 66.98 | 584 | 574 | 119.0 |
| A | 3 | 137 | 6011 | 45.68 | 584 | 574 | 119.0 |
| B | 0 | 186 | 128701 | 1170.28 | 582 | 569 | 109.5 |
| B | 5 | 255 | 115183 | 1046.82 | 582 | 569 | 109.5 |
| B | 0 | 189 | 88242 | 800.75 | 582 | 569 | 109.5 |
| C | 0 | 10 | 376342 | 2934.36 | 554 | 558 | 128.1 |
| C | 15 | 214 | 215553 | 1678.82 | 554 | 558 | 128.1 |
| C | 14 | 254 | 52948 | 409.09 | 554 | 558 | 128.1 |
| D | 13 | 249 | 1163600 | 8714.01 | 550 | 534 | 133.5 |
| D | 5 | 222 | 259422 | 1939.66 | 550 | 534 | 133.5 |
| D | 1 | 47 | 149560 | 1116.54 | 550 | 534 | 133.5 |
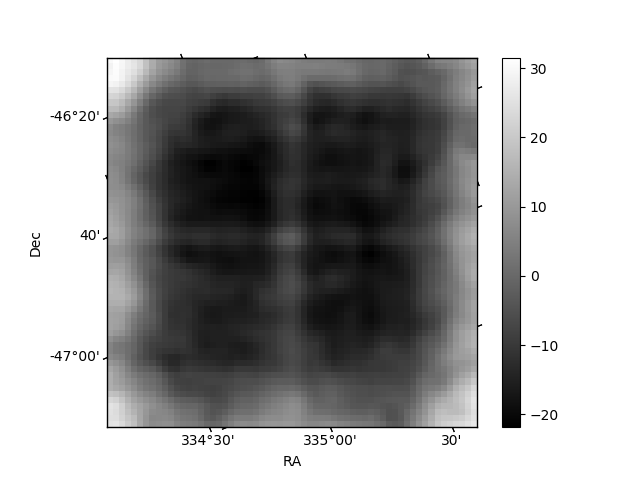
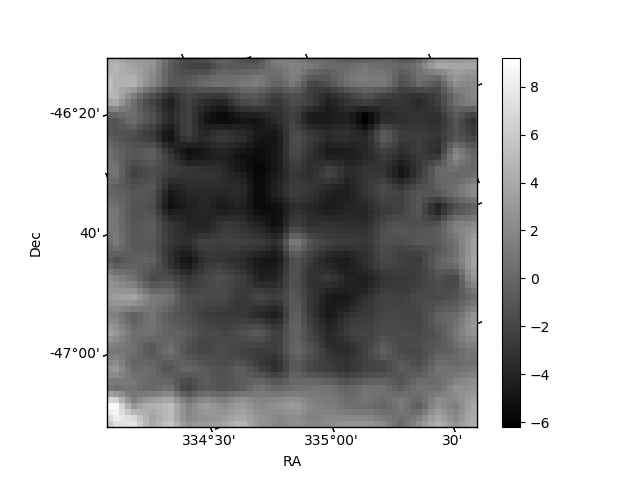
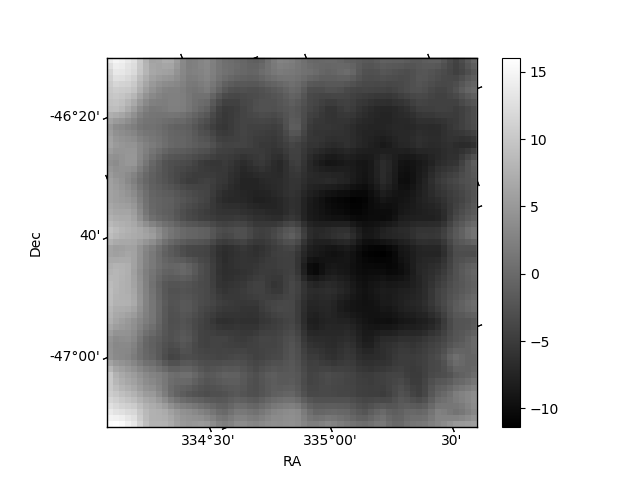
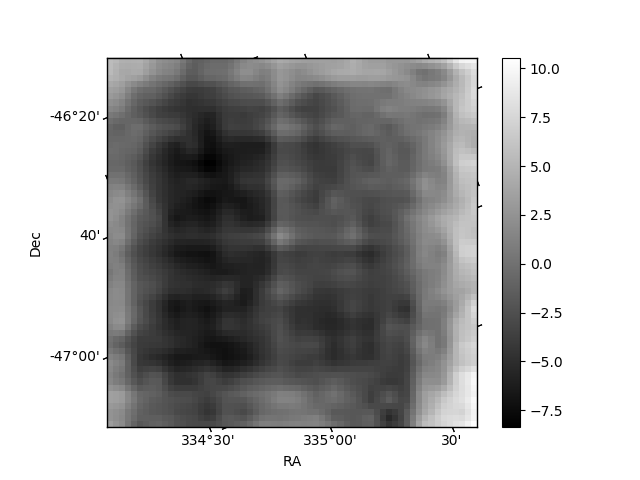
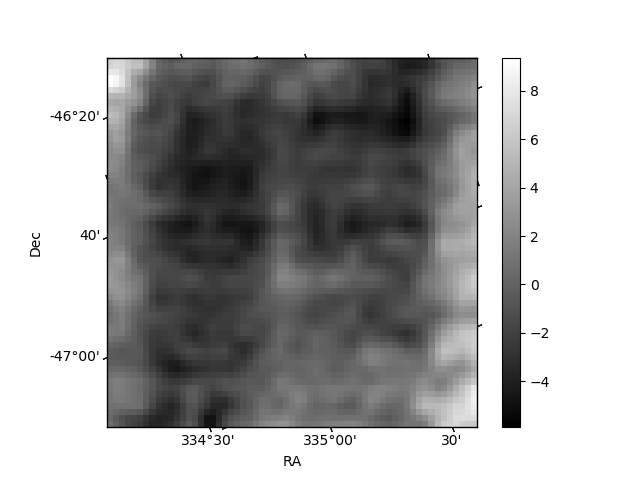
Histogram calculated using DETX and DETY for each event in the final _common_clean file
| Quadrant A | 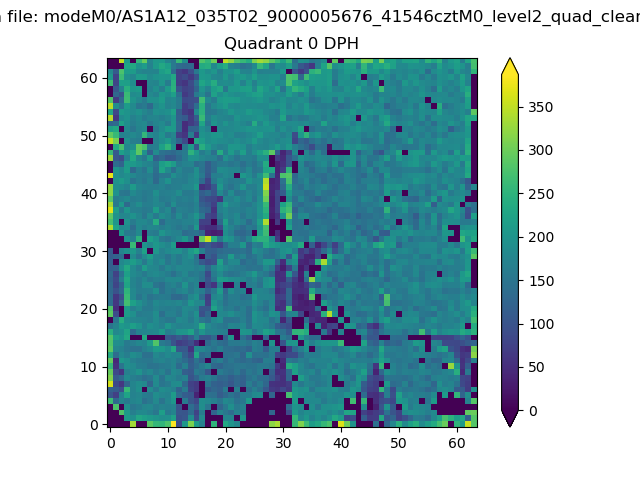 |
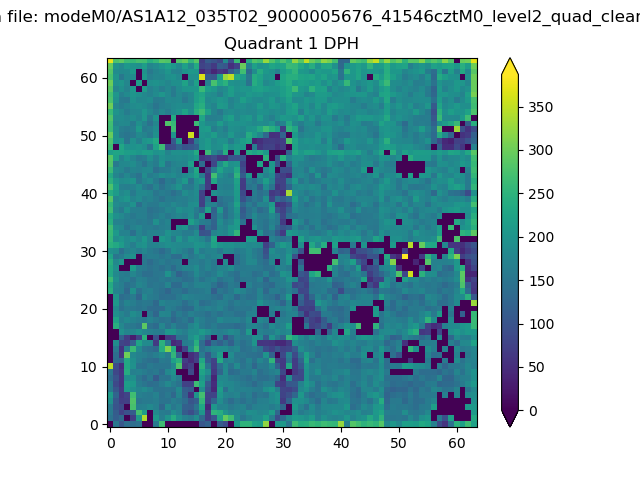 |
Quadrant B |
|---|---|---|---|
| Quadrant D | 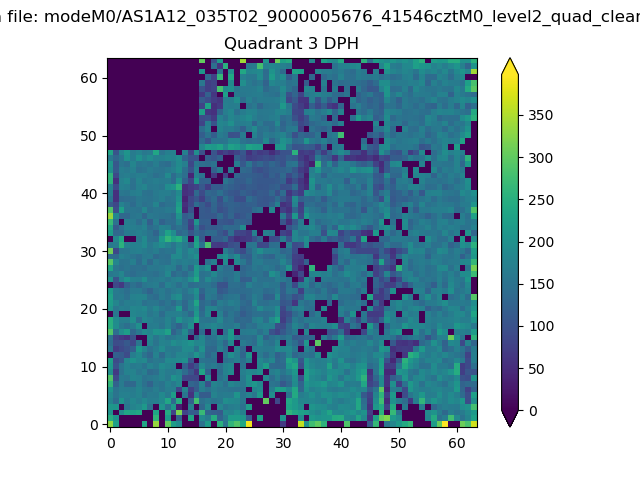 |
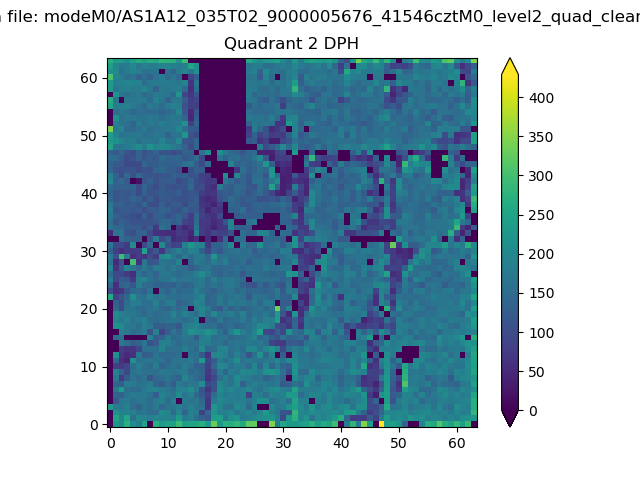 |
Quadrant C |
| Plot type | Count rate plots | Images |
|---|---|---|
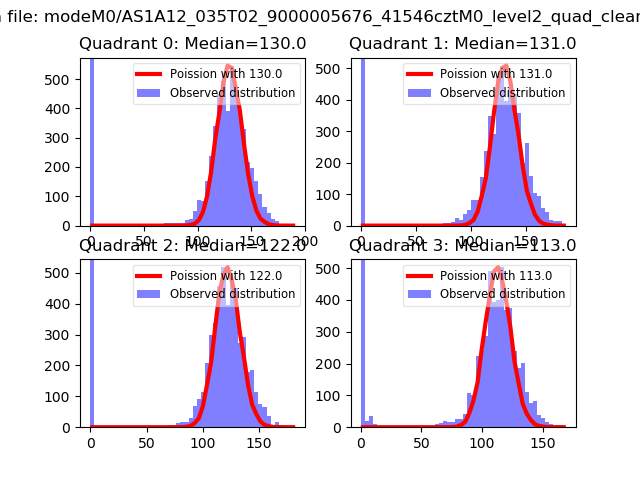
| Comparison with Poisson distribution Blue bars denote a histogram of data divided into 1 sec bins. Red curve is a Poisson curve with rate = median count rate of data. |
 |
 |
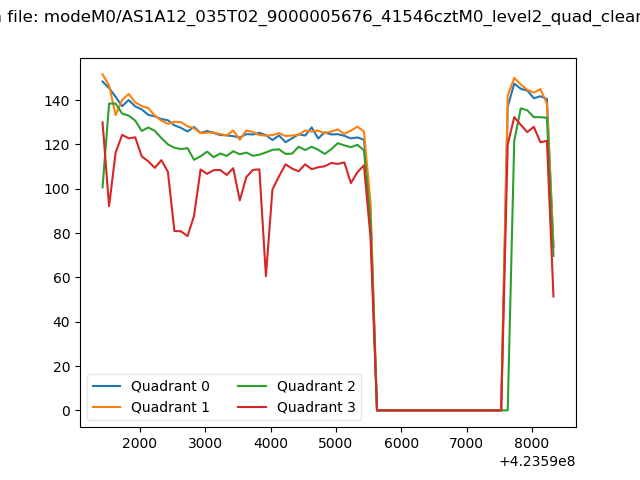
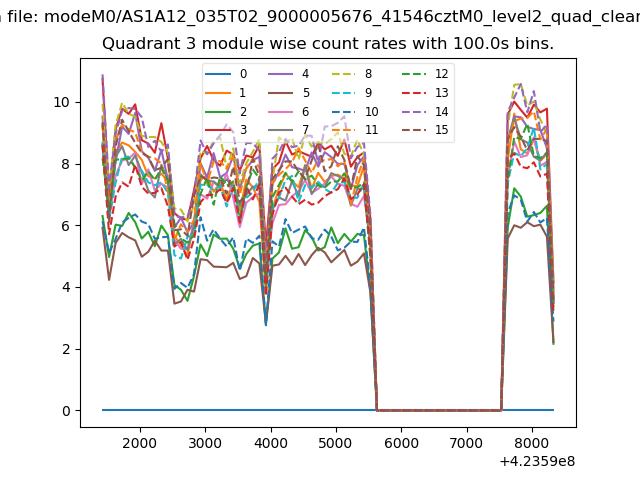
| Quadrant-wise count rates Data is divided into 100 sec bins |
 |
|
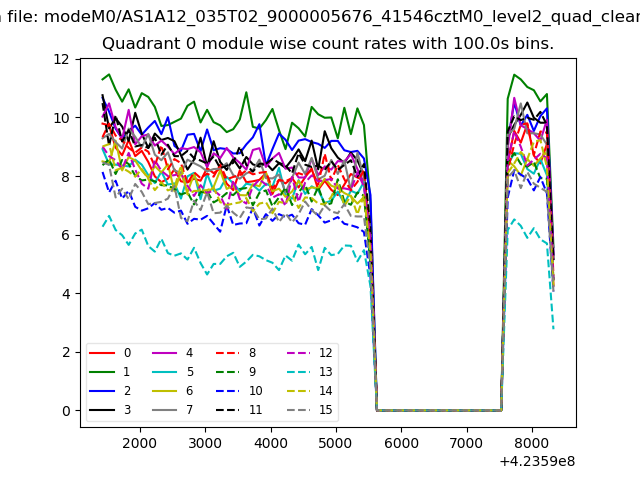
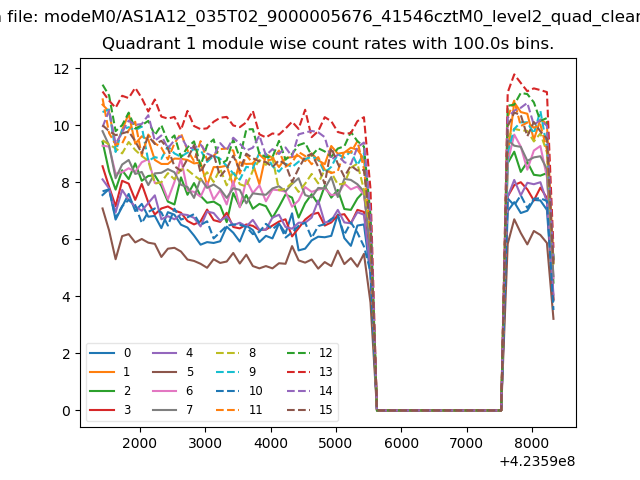
| Module-wise count rates for Quadrant A Data is divided into 100 sec bins |
 |
 |
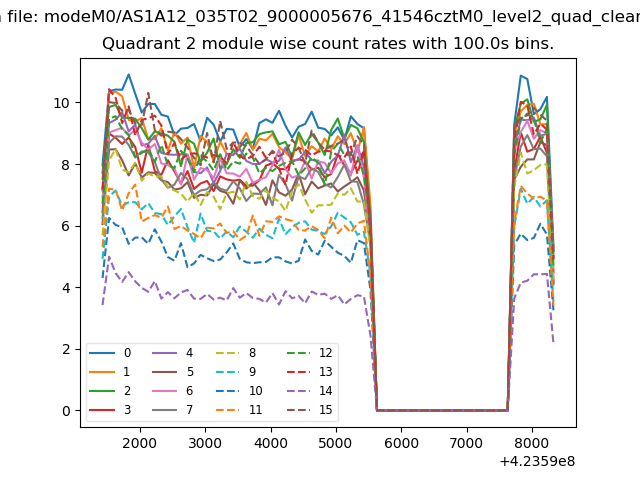
| Module-wise count rates for Quadrant B Data is divided into 100 sec bins |
 |
 |
| Module-wise count rates for Quadrant C Data is divided into 100 sec bins |
 |
 |
| Module-wise count rates for Quadrant D Data is divided into 100 sec bins |
 |
 |
| Parameter | Plot |
|---|---|
| CZT HV Monitor | 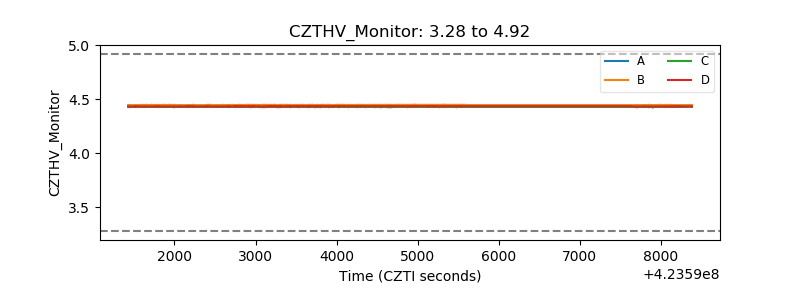 |
| D_VDD | 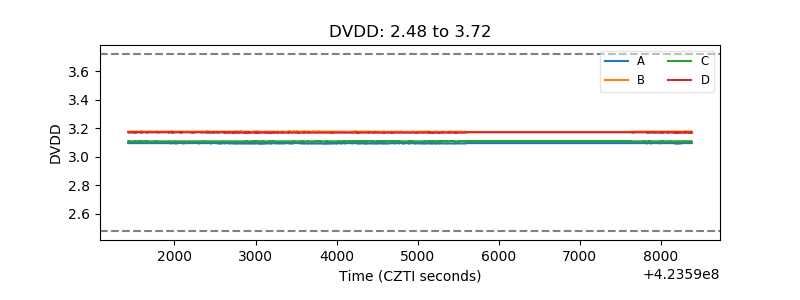 |
| Temperature 1 | 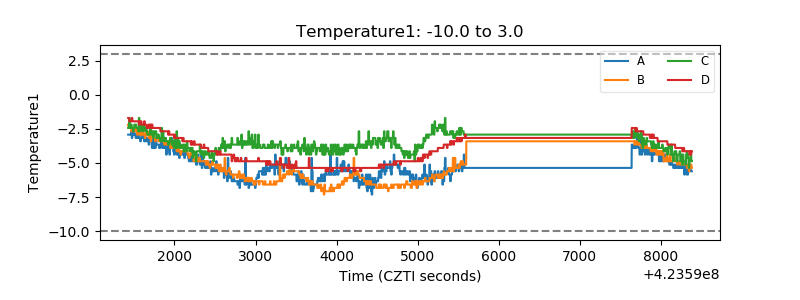 |
| Veto HV Monitor | 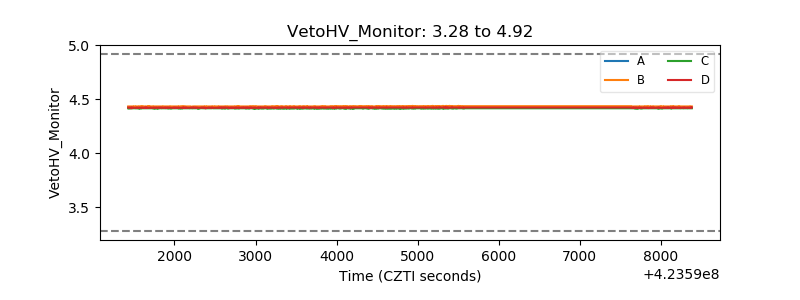 |
| Veto LLD | 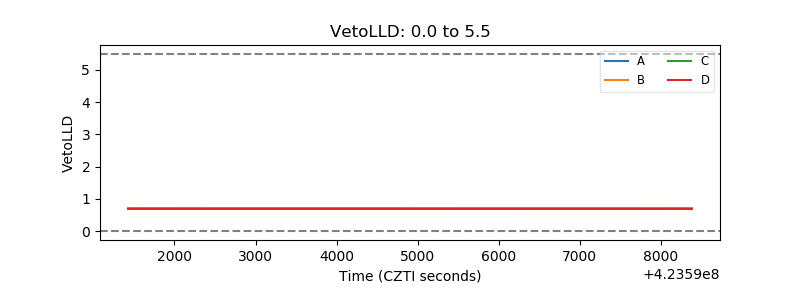 |
| Alpha Counter | 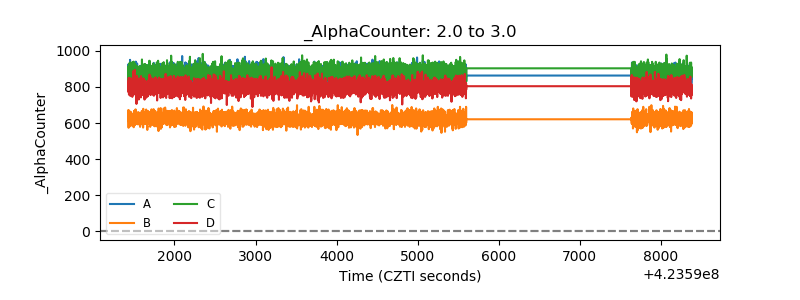 |
| _CPM_Rate | 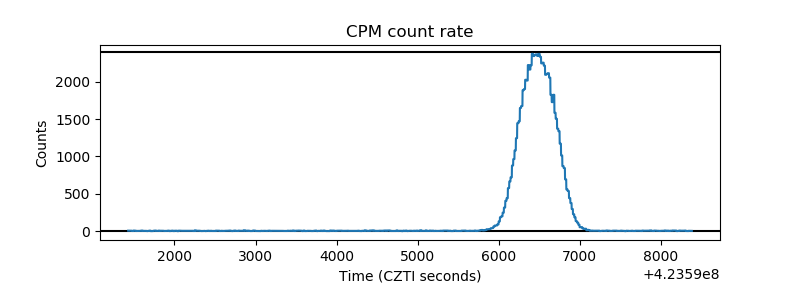 |
| CZT Counter | 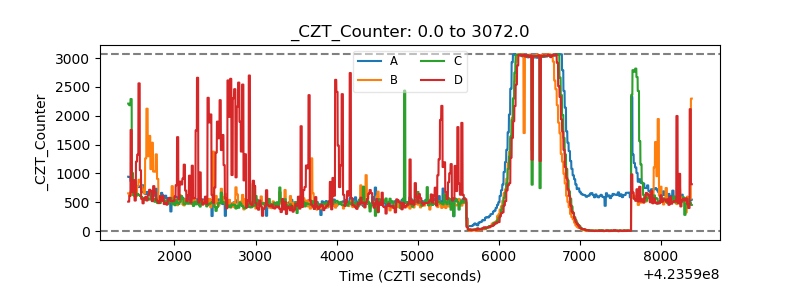 |
| +2.5 Volts monitor | 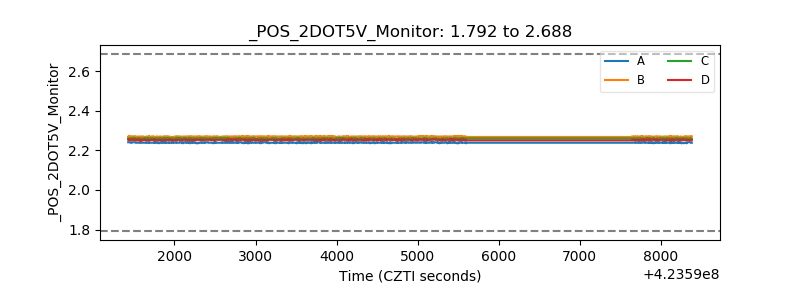 |
| +5 Volts monitor |  |
| _ROLL_ROT | 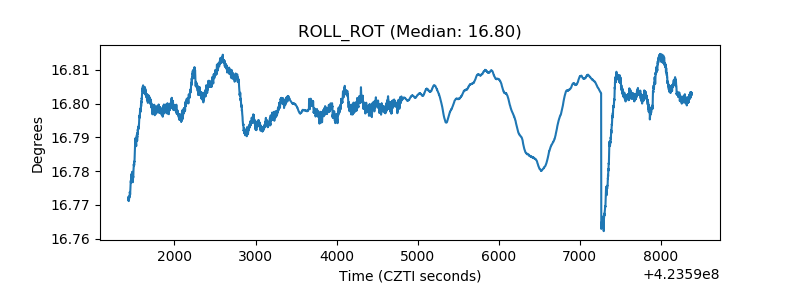 |
| _Roll_DEC | 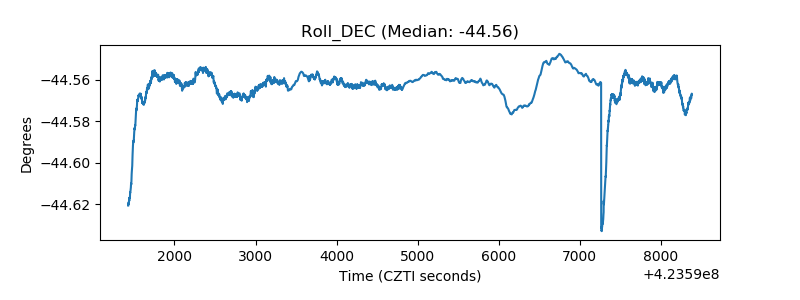 |
| _Roll_RA | 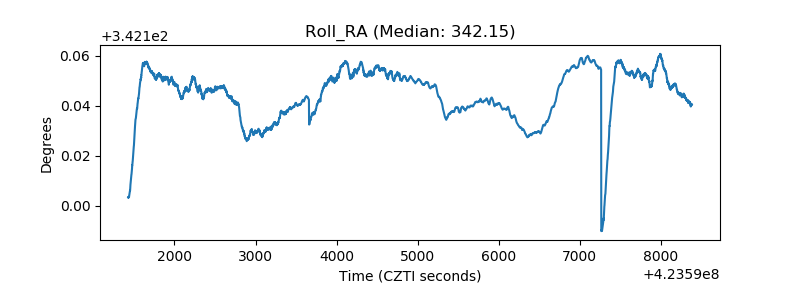 |
| Veto Counter | 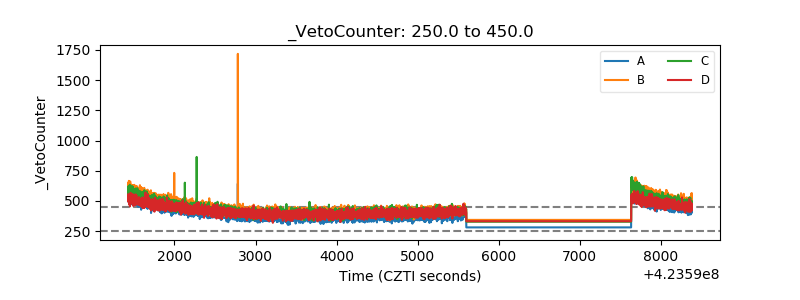 |