| Param | Original file | Final file |
|---|---|---|
| Filename | modeM0/AS1A12_035T02_9000005676_41547cztM0_level2.fits | modeM0/AS1A12_035T02_9000005676_41547cztM0_level2_quad_clean.evt |
| Size (bytes) | 319,656,960 | 91,097,280 |
| Size | 304.8 MB | 86.9 MB |
| Events in quadrant A | 2,752,171 | 637,874 |
| Events in quadrant B | 2,446,318 | 650,797 |
| Events in quadrant C | 3,197,133 | 570,366 |
| Events in quadrant D | 3,055,364 | 556,207 |
| Mode SS | |||
|---|---|---|---|
| Quadrant | BADHDUFLAG | Total packets | Discarded packets |
| A | 0 | 100 | 0 |
| B | 0 | 100 | 0 |
| C | 0 | 100 | 0 |
| D | 0 | 100 | 0 |
| Mode M0 | |||
|---|---|---|---|
| Quadrant | BADHDUFLAG | Total packets | Discarded packets |
| A | 0 | 11065 | 2 |
| B | 0 | 10366 | 2 |
| C | 0 | 12314 | 2 |
| D | 0 | 12210 | 2 |
| Mode M9 | |||
|---|---|---|---|
| Quadrant | BADHDUFLAG | Total packets | Discarded packets |
| A | 0 | 34 | 0 |
| B | 0 | 35 | 0 |
| C | 0 | 35 | 0 |
| D | 0 | 35 | 0 |
| Quadrant | Total seconds | Saturated seconds | Saturation percentage |
|---|---|---|---|
| A | 4896 | 13 | 0.265523% |
| B | 4896 | 22 | 0.449346% |
| C | 4896 | 290 | 5.923203% |
| D | 4896 | 109 | 2.226307% |
Noise dominated data is calculated using 1-second bins in cleaned event files. If a bin has >2000 counts, and if more than 50% of those come from <1% of pixels, then it is considered to be noise-dominated and hence unusable.
| Quadrant | # 1 sec bins | Bins with >0 counts | Bins with >2000 counts | High rate bins dominated by noise | Noise dominated (total time) | Noise dominated (detector-on time) | Marked lightcurve |
|---|---|---|---|---|---|---|---|
| A | 6988 | 4897 | 6 | 6 | 0.09% | 0.12% | 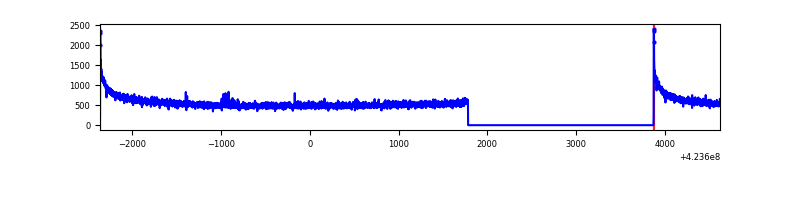 |
| B | 6988 | 4897 | 11 | 11 | 0.16% | 0.22% | 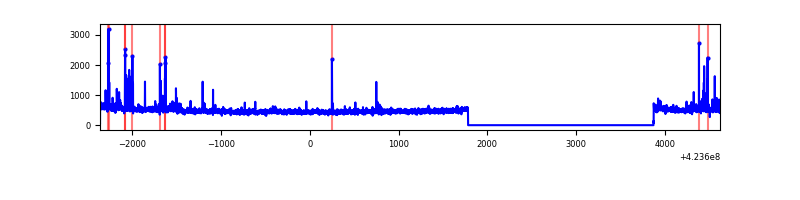 |
| C | 6988 | 4897 | 272 | 272 | 3.89% | 5.55% | 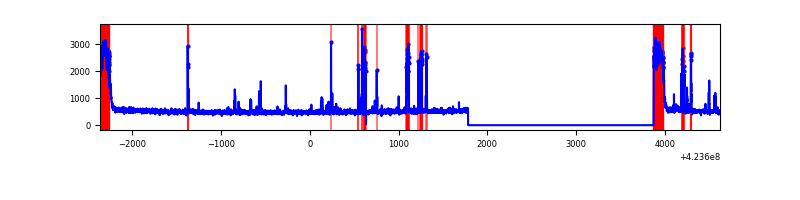 |
| D | 6988 | 4897 | 102 | 102 | 1.46% | 2.08% | 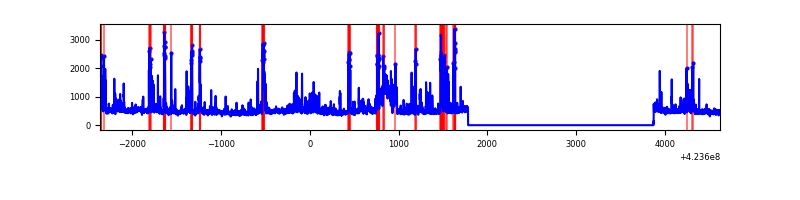 |
Top three noisy pixels from each quadrant. If the there are fewer than three noisy pixels in the level2.evt file, extra rows are filled as -1
| Pixel properties | Quadrant properties | ||||||
|---|---|---|---|---|---|---|---|
| Quadrant | DetID | PixID | Counts | Sigma | Mean | Median | Sigma |
| A | 10 | 83 | 490011 | 4140.18 | 581 | 570 | 118.2 |
| A | 13 | 254 | 8801 | 69.63 | 581 | 570 | 118.2 |
| A | 3 | 137 | 5932 | 45.36 | 581 | 570 | 118.2 |
| B | 5 | 255 | 76495 | 693.25 | 579 | 565 | 109.5 |
| B | 0 | 245 | 57841 | 522.93 | 579 | 565 | 109.5 |
| B | 0 | 189 | 29425 | 263.49 | 579 | 565 | 109.5 |
| C | 0 | 10 | 576875 | 4621.74 | 543 | 548 | 124.7 |
| C | 14 | 254 | 286623 | 2294.12 | 543 | 548 | 124.7 |
| C | 15 | 214 | 210724 | 1685.46 | 543 | 548 | 124.7 |
| D | 15 | 0 | 230505 | 1696.01 | 558 | 542 | 135.6 |
| D | 2 | 249 | 197319 | 1451.26 | 558 | 542 | 135.6 |
| D | 1 | 47 | 128145 | 941.09 | 558 | 542 | 135.6 |
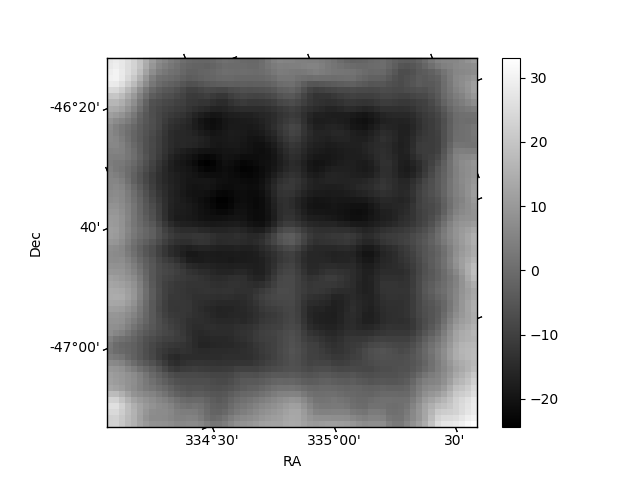
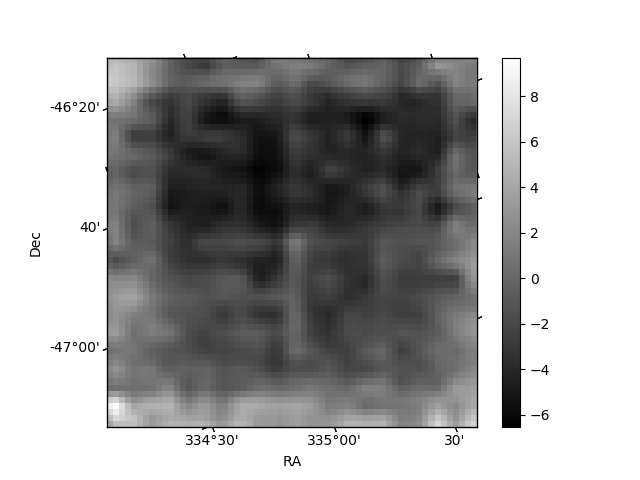
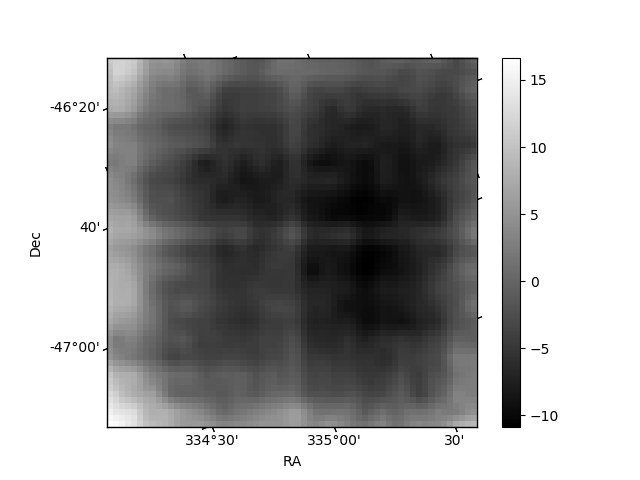
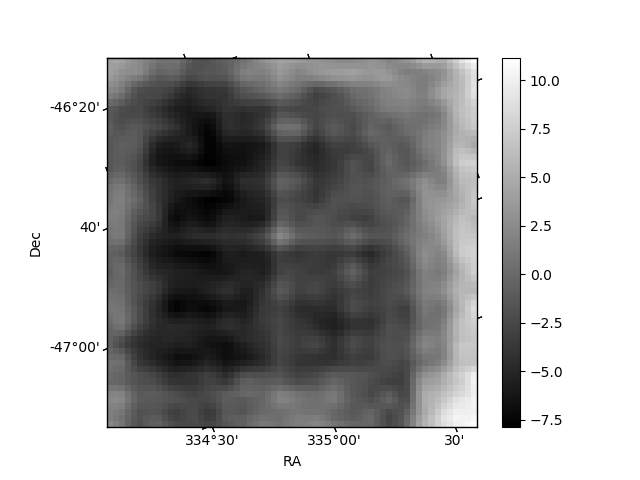
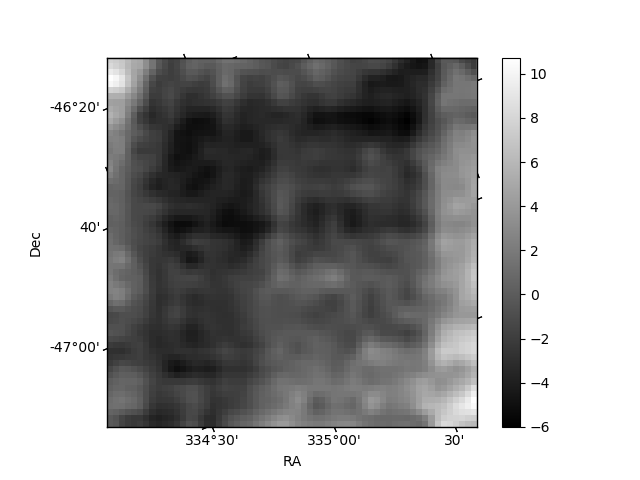
Histogram calculated using DETX and DETY for each event in the final _common_clean file
| Quadrant A | 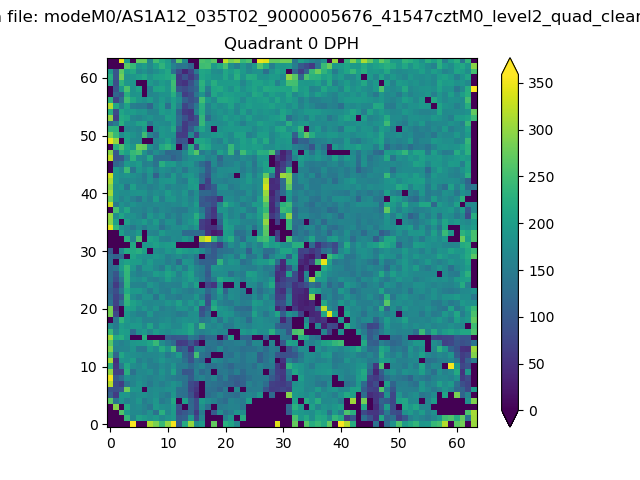 |
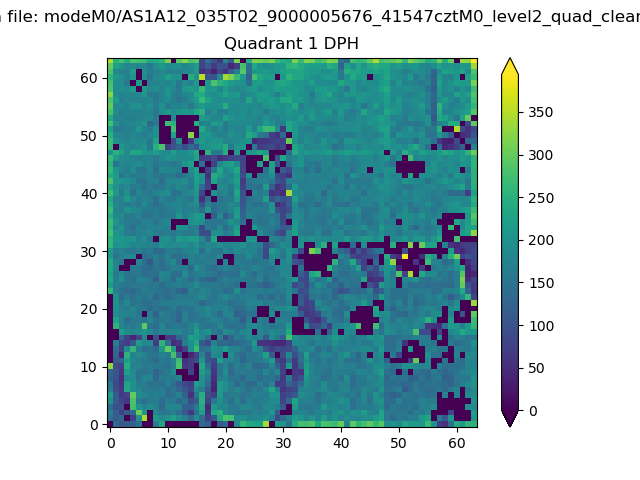 |
Quadrant B |
|---|---|---|---|
| Quadrant D | 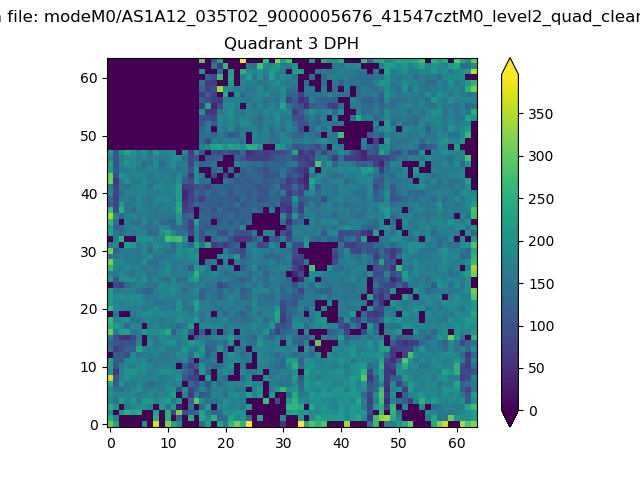 |
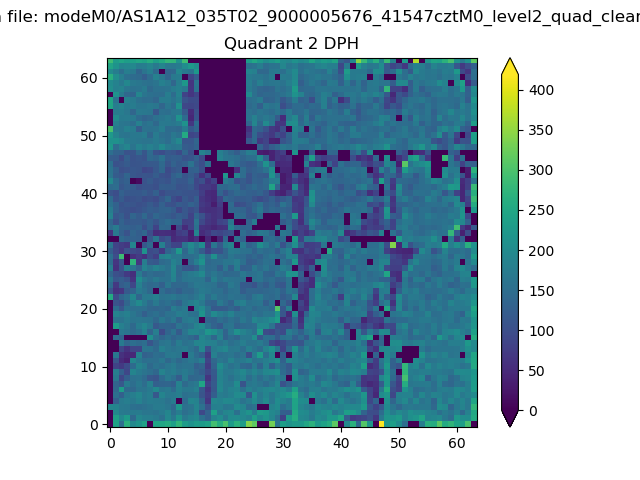 |
Quadrant C |
| Plot type | Count rate plots | Images |
|---|---|---|
| Comparison with Poisson distribution Blue bars denote a histogram of data divided into 1 sec bins. Red curve is a Poisson curve with rate = median count rate of data. |
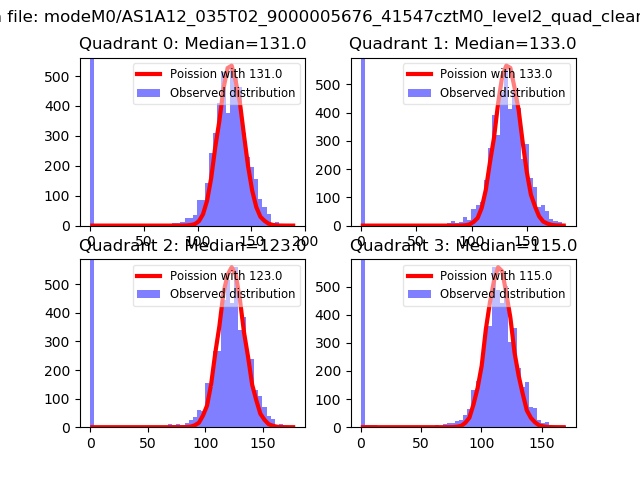 |
 |
| Quadrant-wise count rates Data is divided into 100 sec bins |
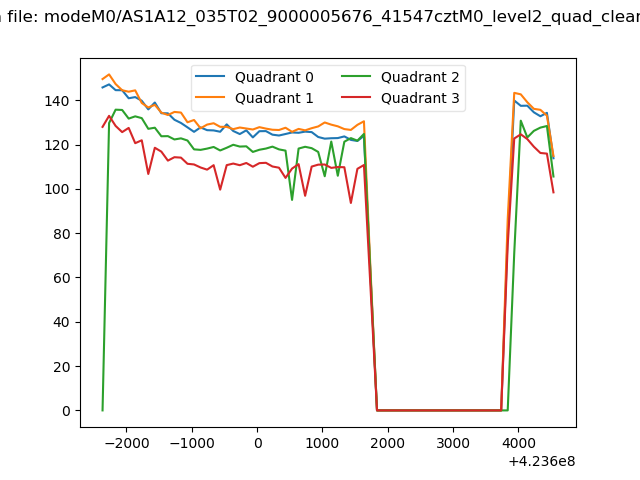 |
|
| Module-wise count rates for Quadrant A Data is divided into 100 sec bins |
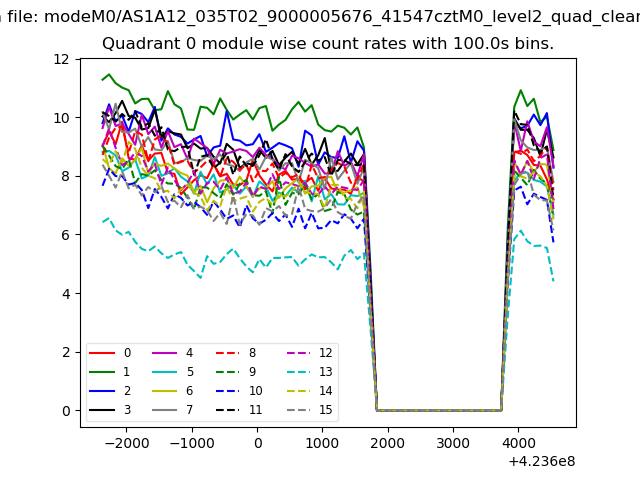 |
 |
| Module-wise count rates for Quadrant B Data is divided into 100 sec bins |
 |
 |
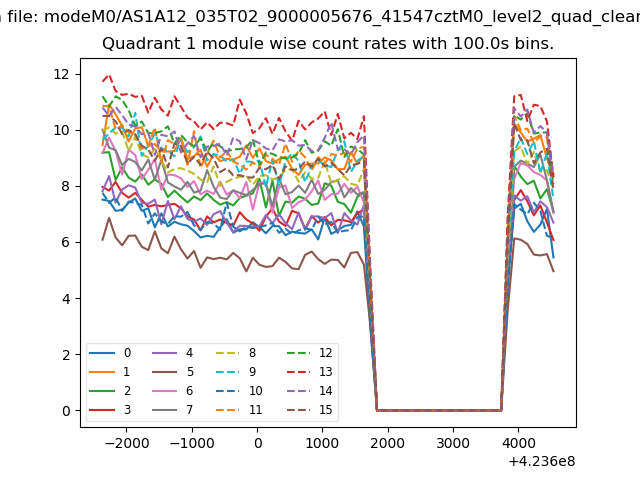
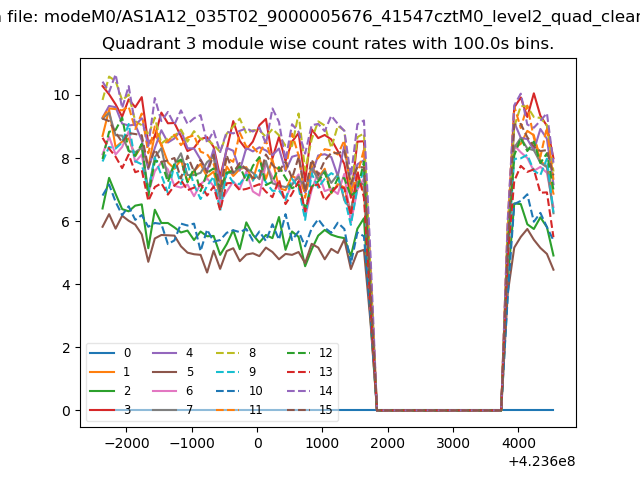
| Module-wise count rates for Quadrant C Data is divided into 100 sec bins |
 |
 |
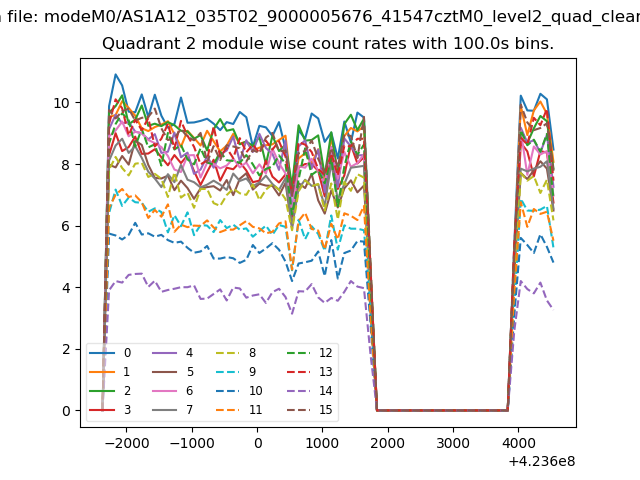
| Module-wise count rates for Quadrant D Data is divided into 100 sec bins |
 |
 |
| Parameter | Plot |
|---|---|
| CZT HV Monitor | 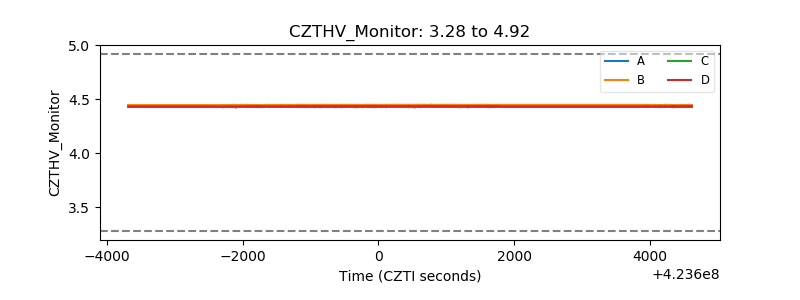 |
| D_VDD | 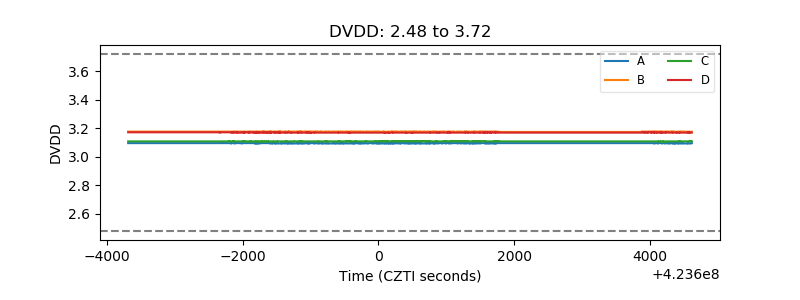 |
| Temperature 1 | 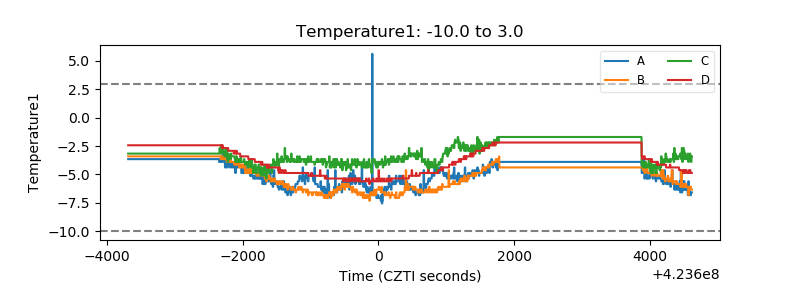 |
| Veto HV Monitor |  |
| Veto LLD | 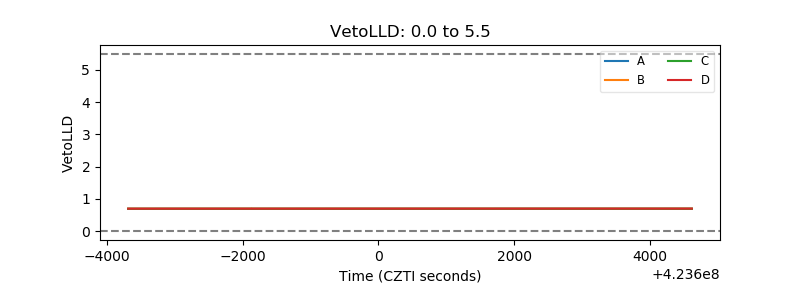 |
| Alpha Counter | 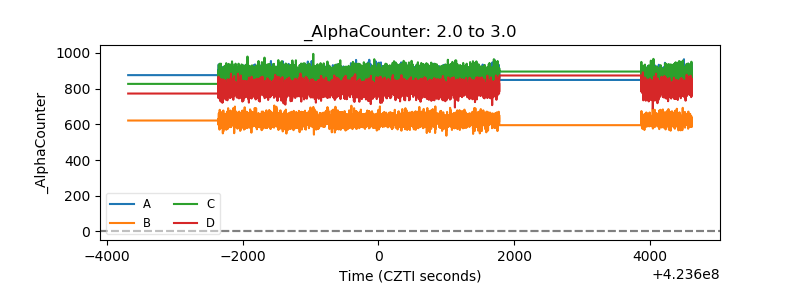 |
| _CPM_Rate | 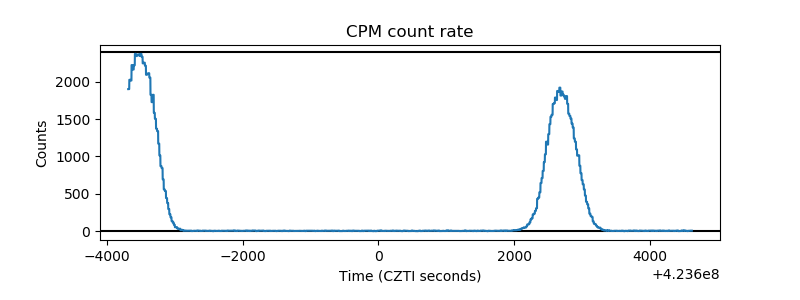 |
| CZT Counter | 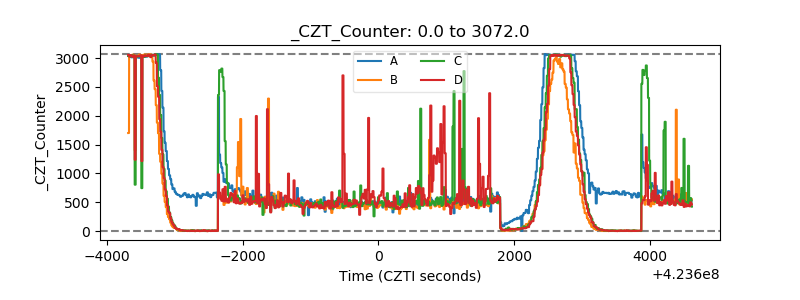 |
| +2.5 Volts monitor | 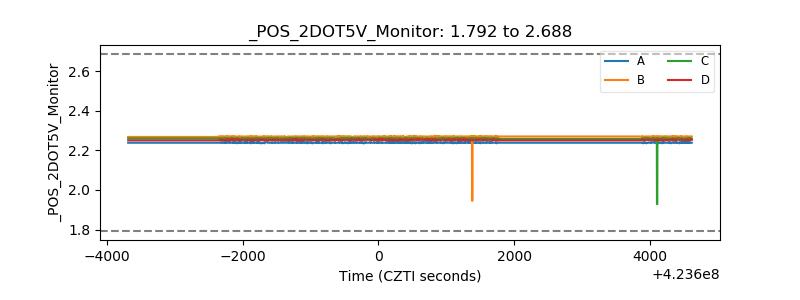 |
| +5 Volts monitor | 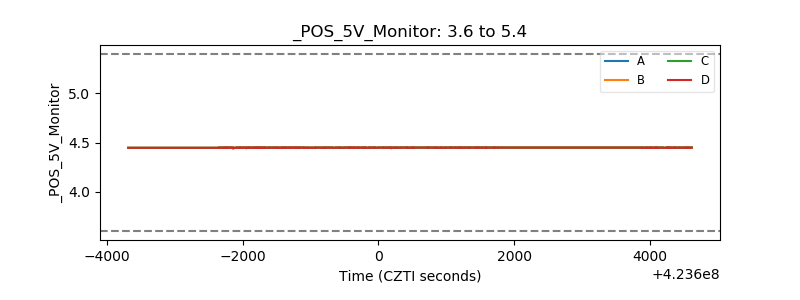 |
| _ROLL_ROT | 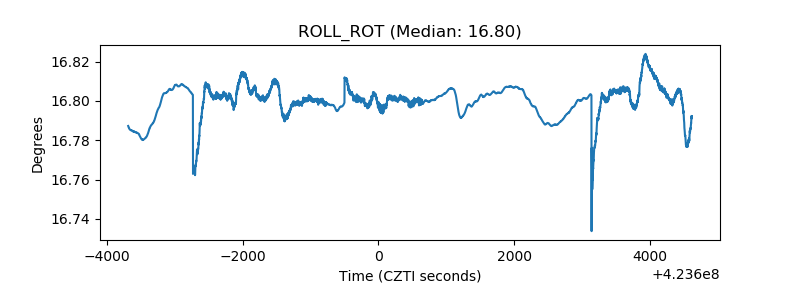 |
| _Roll_DEC | 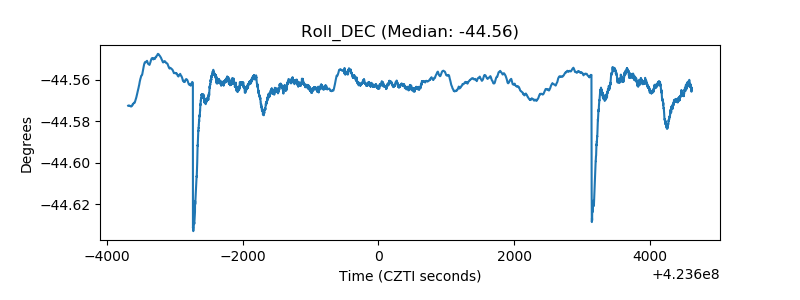 |
| _Roll_RA | 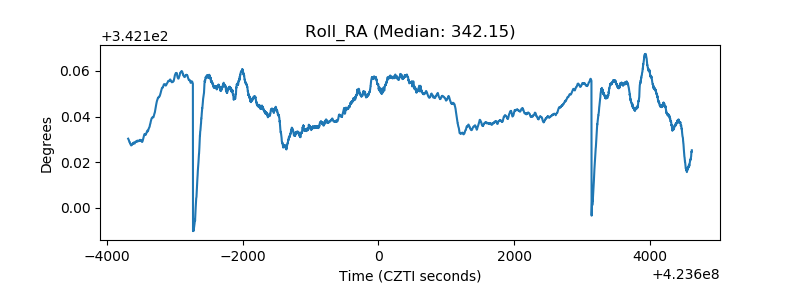 |
| Veto Counter |  |