| Param | Original file | Final file |
|---|---|---|
| Filename | modeM0/AS1A12_035T02_9000005676_41548cztM0_level2.fits | modeM0/AS1A12_035T02_9000005676_41548cztM0_level2_quad_clean.evt |
| Size (bytes) | 341,340,480 | 87,900,480 |
| Size | 325.5 MB | 83.8 MB |
| Events in quadrant A | 2,942,984 | 613,687 |
| Events in quadrant B | 2,968,049 | 600,134 |
| Events in quadrant C | 3,305,260 | 561,275 |
| Events in quadrant D | 3,034,119 | 539,811 |
| Mode SS | |||
|---|---|---|---|
| Quadrant | BADHDUFLAG | Total packets | Discarded packets |
| A | 0 | 102 | 0 |
| B | 0 | 102 | 0 |
| C | 0 | 102 | 0 |
| D | 0 | 102 | 0 |
| Mode M0 | |||
|---|---|---|---|
| Quadrant | BADHDUFLAG | Total packets | Discarded packets |
| A | 0 | 11724 | 2 |
| B | 0 | 12058 | 2 |
| C | 0 | 12796 | 2 |
| D | 0 | 12320 | 2 |
| Mode M9 | |||
|---|---|---|---|
| Quadrant | BADHDUFLAG | Total packets | Discarded packets |
| A | 0 | 27 | 0 |
| B | 0 | 28 | 0 |
| C | 0 | 28 | 0 |
| D | 0 | 28 | 0 |
| Quadrant | Total seconds | Saturated seconds | Saturation percentage |
|---|---|---|---|
| A | 4943 | 38 | 0.768764% |
| B | 4943 | 269 | 5.442039% |
| C | 4943 | 269 | 5.442039% |
| D | 4943 | 111 | 2.245600% |
Noise dominated data is calculated using 1-second bins in cleaned event files. If a bin has >2000 counts, and if more than 50% of those come from <1% of pixels, then it is considered to be noise-dominated and hence unusable.
| Quadrant | # 1 sec bins | Bins with >0 counts | Bins with >2000 counts | High rate bins dominated by noise | Noise dominated (total time) | Noise dominated (detector-on time) | Marked lightcurve |
|---|---|---|---|---|---|---|---|
| A | 7065 | 4944 | 43 | 43 | 0.61% | 0.87% | 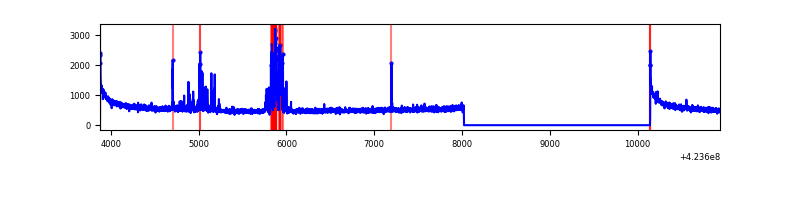 |
| B | 7065 | 4944 | 250 | 250 | 3.54% | 5.06% | 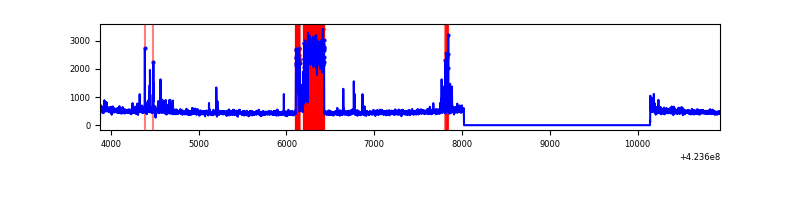 |
| C | 7065 | 4944 | 265 | 265 | 3.75% | 5.36% | 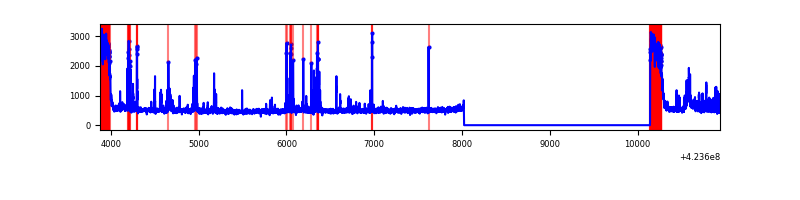 |
| D | 7065 | 4944 | 128 | 128 | 1.81% | 2.59% | 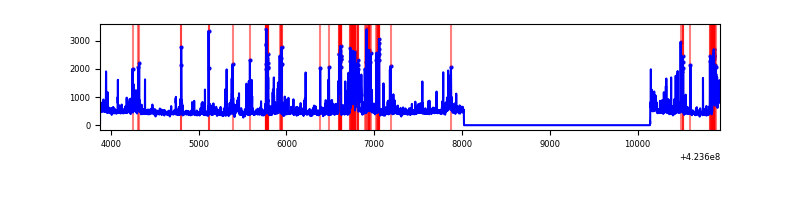 |
Top three noisy pixels from each quadrant. If the there are fewer than three noisy pixels in the level2.evt file, extra rows are filled as -1
| Pixel properties | Quadrant properties | ||||||
|---|---|---|---|---|---|---|---|
| Quadrant | DetID | PixID | Counts | Sigma | Mean | Median | Sigma |
| A | 10 | 83 | 491247 | 4187.36 | 567 | 556 | 117.2 |
| A | 13 | 248 | 251799 | 2144.01 | 567 | 556 | 117.2 |
| A | 13 | 254 | 8239 | 65.56 | 567 | 556 | 117.2 |
| B | 5 | 255 | 718009 | 6821.87 | 551 | 538 | 105.2 |
| B | 0 | 245 | 53490 | 503.48 | 551 | 538 | 105.2 |
| B | 0 | 189 | 23479 | 218.13 | 551 | 538 | 105.2 |
| C | 0 | 10 | 617024 | 4913.15 | 541 | 545 | 125.5 |
| C | 14 | 254 | 363546 | 2893.01 | 541 | 545 | 125.5 |
| C | 15 | 214 | 212899 | 1692.4 | 541 | 545 | 125.5 |
| D | 2 | 249 | 275513 | 2049.96 | 552 | 537 | 134.1 |
| D | 13 | 249 | 203558 | 1513.54 | 552 | 537 | 134.1 |
| D | 5 | 222 | 191547 | 1423.99 | 552 | 537 | 134.1 |
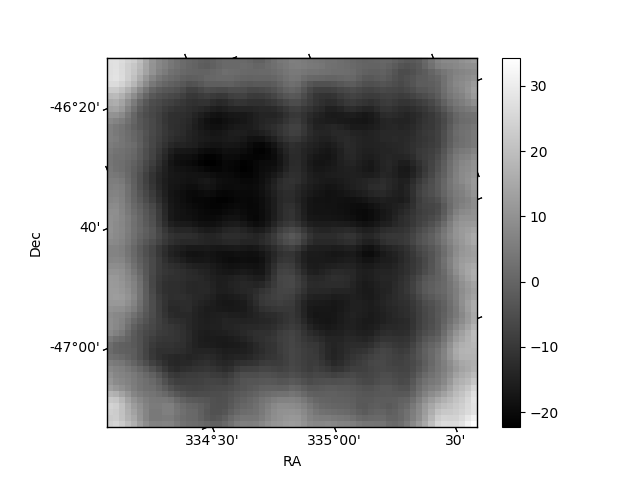
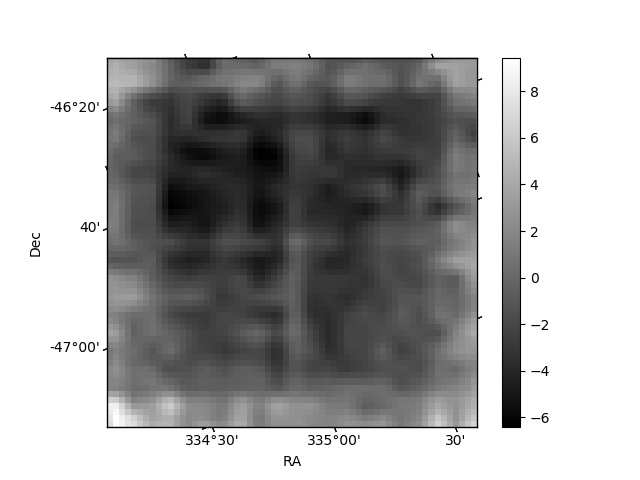
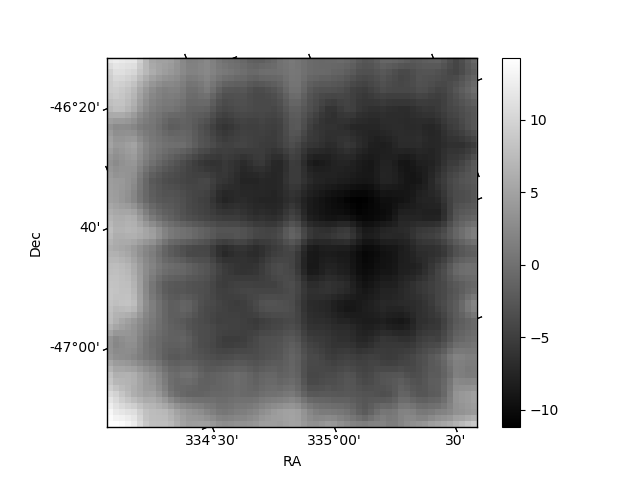
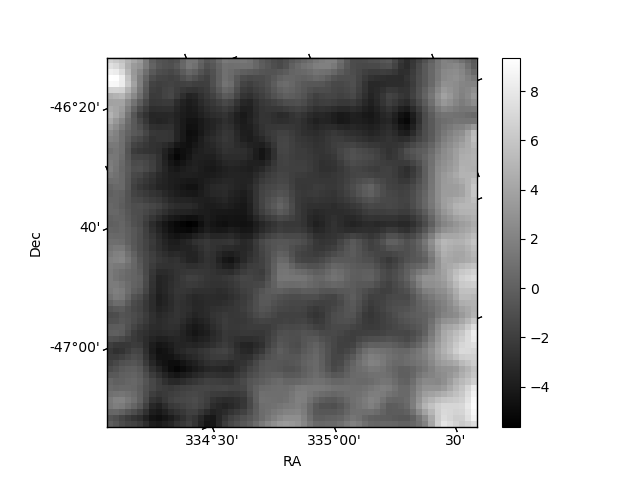
Histogram calculated using DETX and DETY for each event in the final _common_clean file
| Quadrant A | 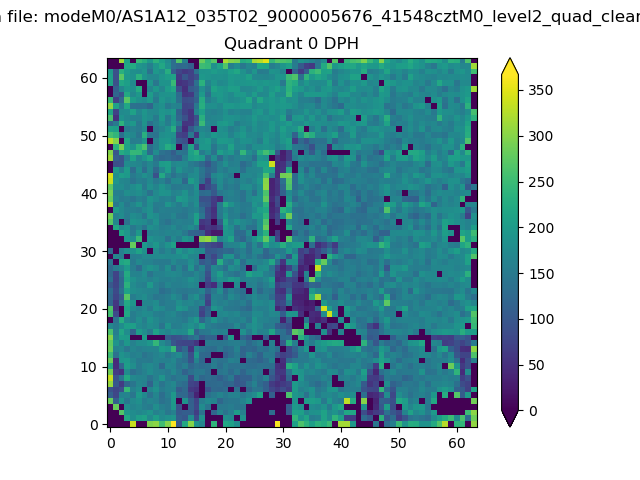 |
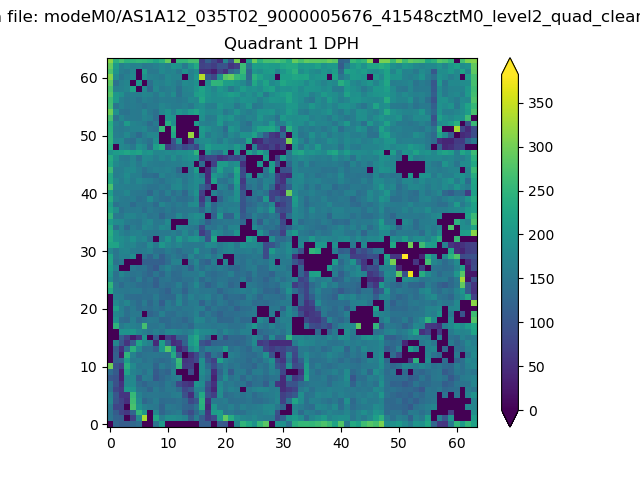 |
Quadrant B |
|---|---|---|---|
| Quadrant D | 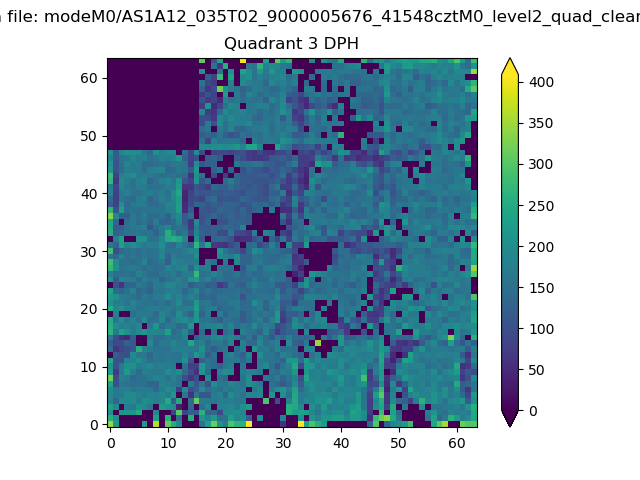 |
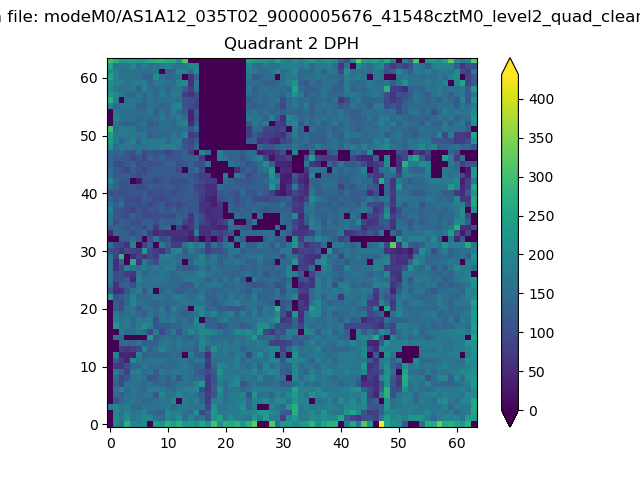 |
Quadrant C |
| Plot type | Count rate plots | Images |
|---|---|---|
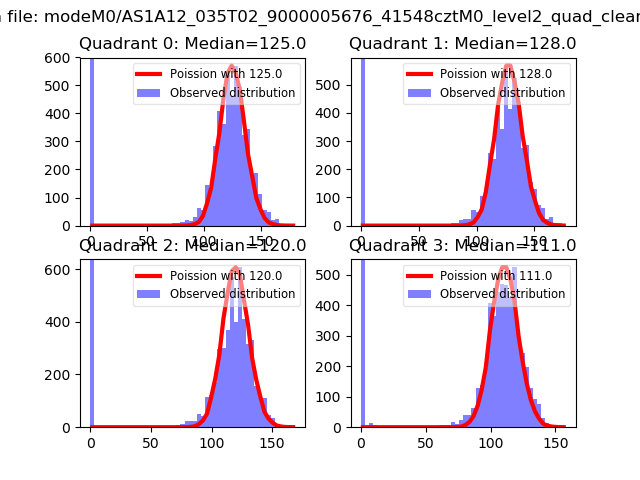
| Comparison with Poisson distribution Blue bars denote a histogram of data divided into 1 sec bins. Red curve is a Poisson curve with rate = median count rate of data. |
 |
 |
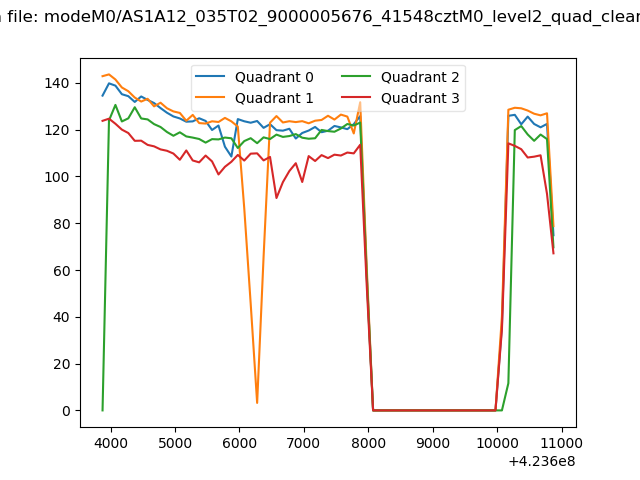
| Quadrant-wise count rates Data is divided into 100 sec bins |
 |
|
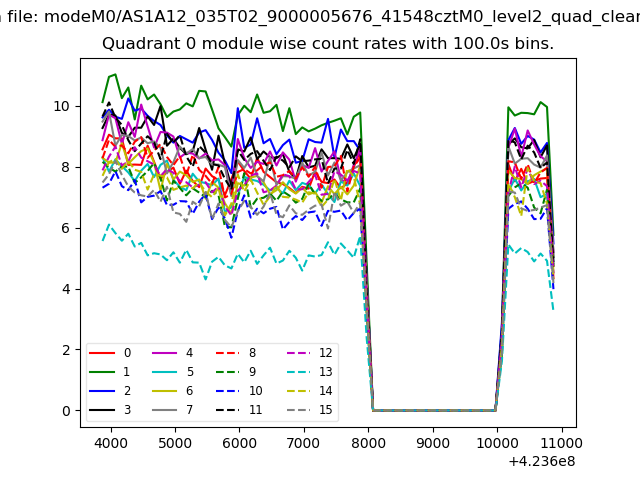
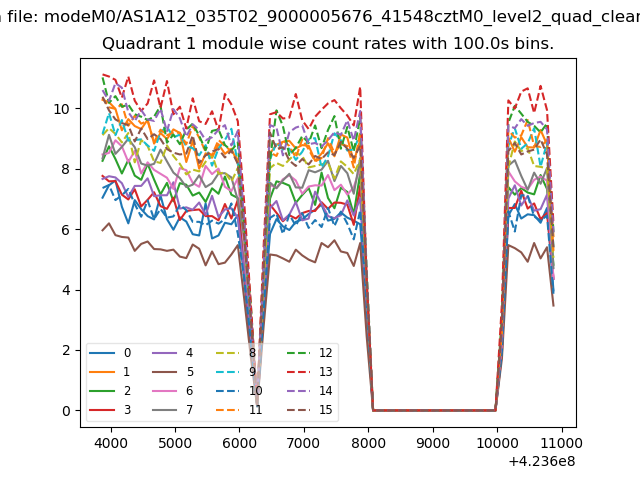
| Module-wise count rates for Quadrant A Data is divided into 100 sec bins |
 |
 |
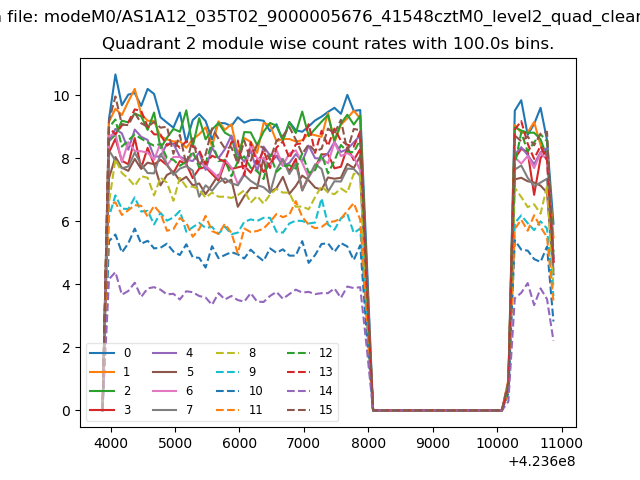
| Module-wise count rates for Quadrant B Data is divided into 100 sec bins |
 |
 |
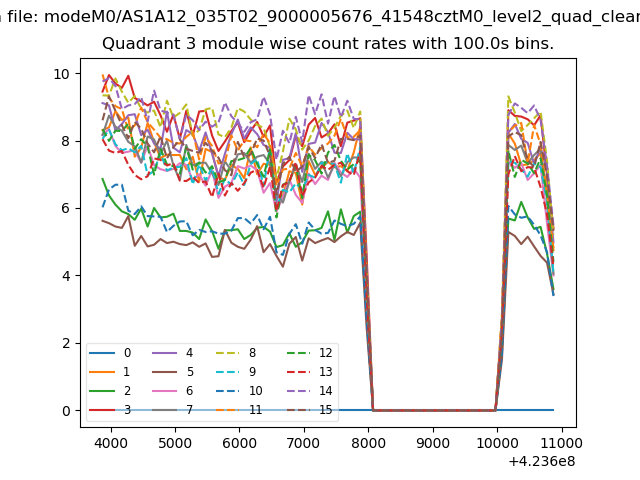
| Module-wise count rates for Quadrant C Data is divided into 100 sec bins |
 |
 |
| Module-wise count rates for Quadrant D Data is divided into 100 sec bins |
 |
 |
| Parameter | Plot |
|---|---|
| CZT HV Monitor |  |
| D_VDD | 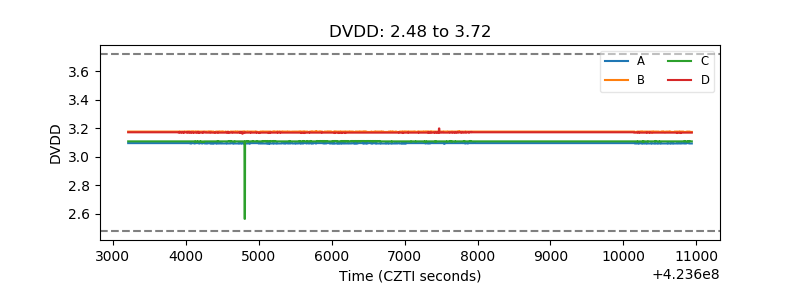 |
| Temperature 1 | 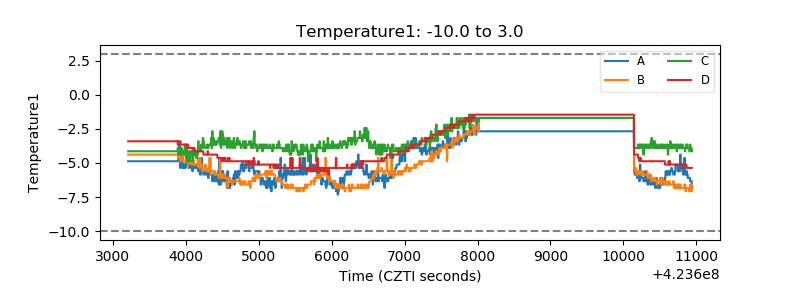 |
| Veto HV Monitor | 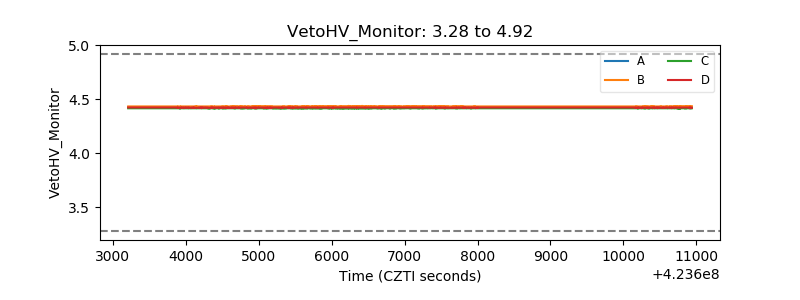 |
| Veto LLD | 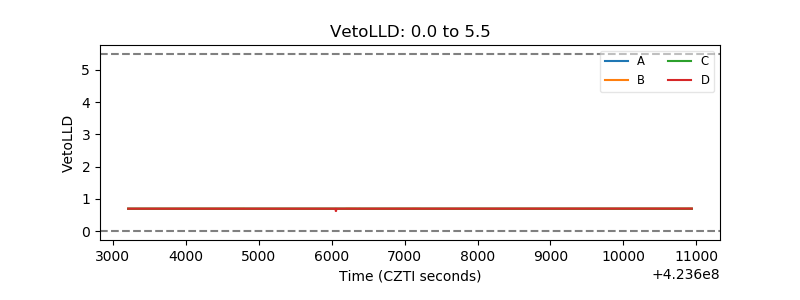 |
| Alpha Counter | 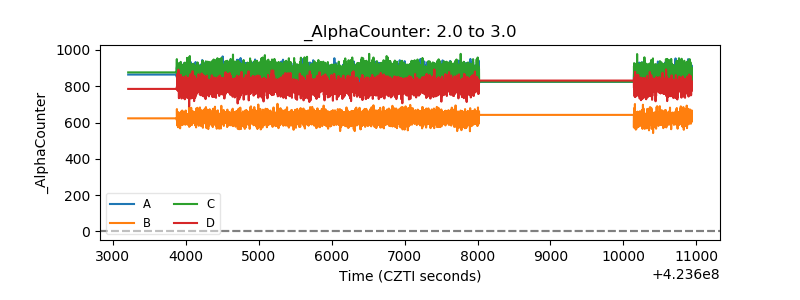 |
| _CPM_Rate | 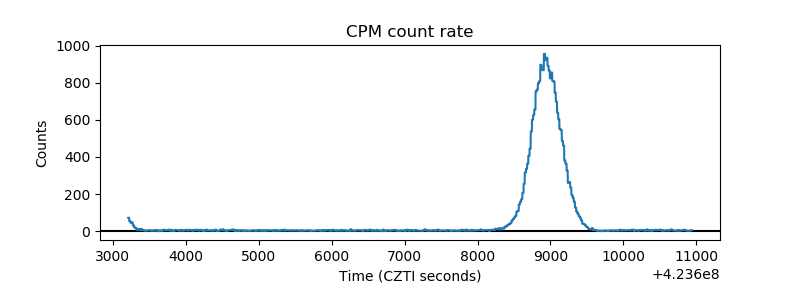 |
| CZT Counter | 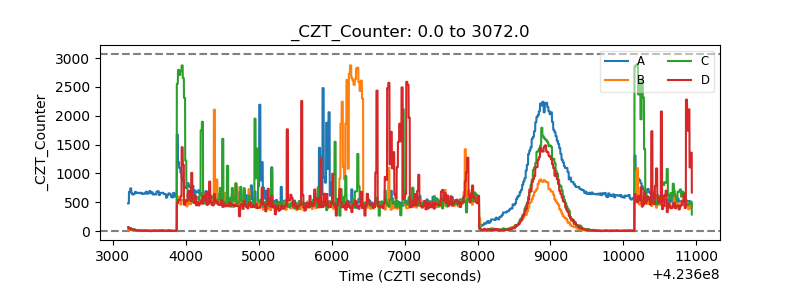 |
| +2.5 Volts monitor | 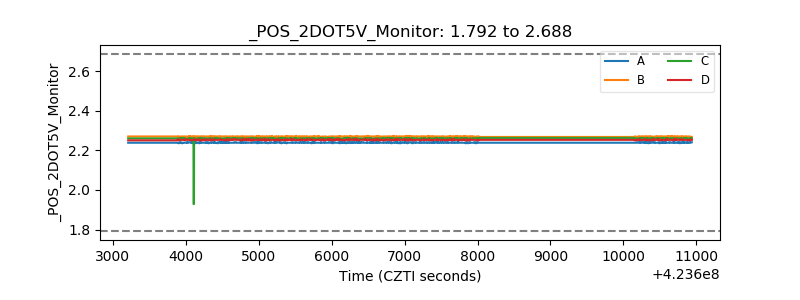 |
| +5 Volts monitor | 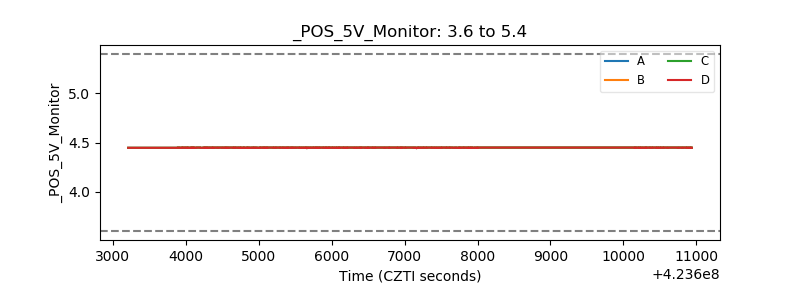 |
| _ROLL_ROT | 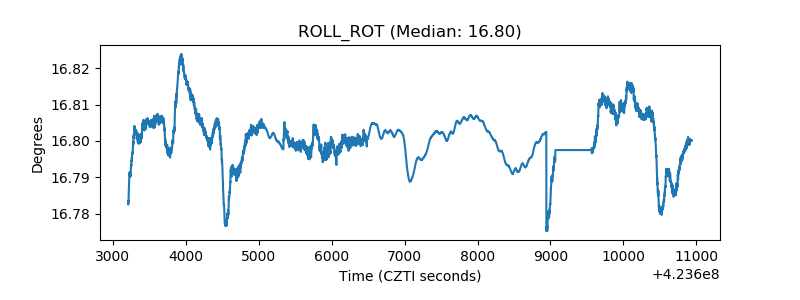 |
| _Roll_DEC | 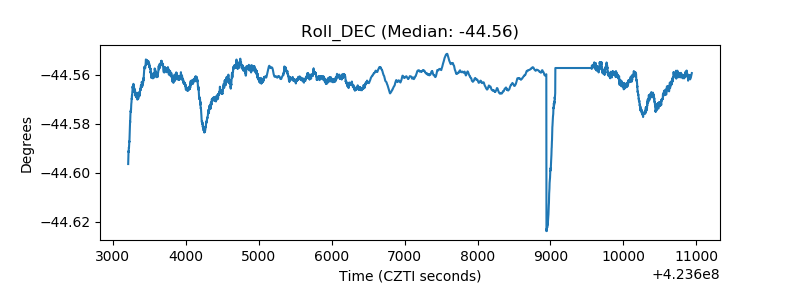 |
| _Roll_RA | 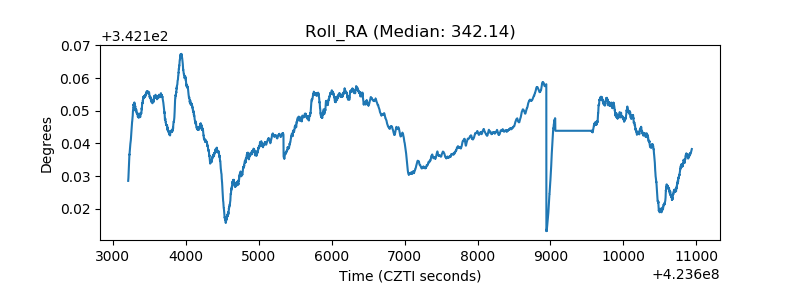 |
| Veto Counter | 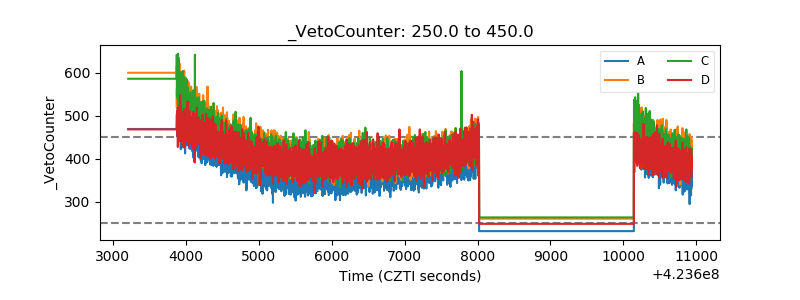 |