| Param | Original file | Final file |
|---|---|---|
| Filename | modeM0/AS1A12_035T02_9000005676_41549cztM0_level2.fits | modeM0/AS1A12_035T02_9000005676_41549cztM0_level2_quad_clean.evt |
| Size (bytes) | 332,858,880 | 83,836,800 |
| Size | 317.4 MB | 80.0 MB |
| Events in quadrant A | 2,693,638 | 577,533 |
| Events in quadrant B | 2,274,637 | 591,884 |
| Events in quadrant C | 3,208,132 | 529,725 |
| Events in quadrant D | 3,761,158 | 494,222 |
| Mode SS | |||
|---|---|---|---|
| Quadrant | BADHDUFLAG | Total packets | Discarded packets |
| A | 0 | 100 | 0 |
| B | 0 | 100 | 0 |
| C | 0 | 100 | 0 |
| D | 0 | 100 | 0 |
| Mode M0 | |||
|---|---|---|---|
| Quadrant | BADHDUFLAG | Total packets | Discarded packets |
| A | 0 | 11047 | 2 |
| B | 0 | 10126 | 2 |
| C | 0 | 12575 | 2 |
| D | 0 | 14588 | 2 |
| Mode M9 | |||
|---|---|---|---|
| Quadrant | BADHDUFLAG | Total packets | Discarded packets |
| A | 0 | 26 | 0 |
| B | 0 | 27 | 0 |
| C | 0 | 27 | 0 |
| D | 0 | 27 | 0 |
| Quadrant | Total seconds | Saturated seconds | Saturation percentage |
|---|---|---|---|
| A | 4925 | 13 | 0.263959% |
| B | 4925 | 9 | 0.182741% |
| C | 4925 | 267 | 5.421320% |
| D | 4925 | 315 | 6.395939% |
Noise dominated data is calculated using 1-second bins in cleaned event files. If a bin has >2000 counts, and if more than 50% of those come from <1% of pixels, then it is considered to be noise-dominated and hence unusable.
| Quadrant | # 1 sec bins | Bins with >0 counts | Bins with >2000 counts | High rate bins dominated by noise | Noise dominated (total time) | Noise dominated (detector-on time) | Marked lightcurve |
|---|---|---|---|---|---|---|---|
| A | 6989 | 4926 | 6 | 6 | 0.09% | 0.12% | 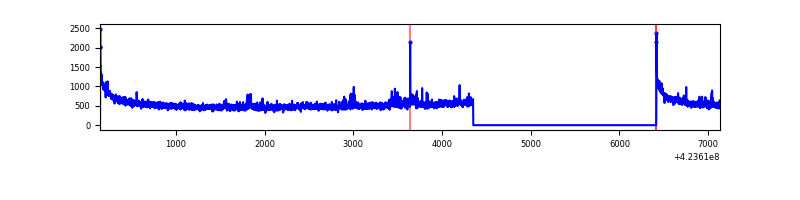 |
| B | 6989 | 4926 | 3 | 3 | 0.04% | 0.06% | 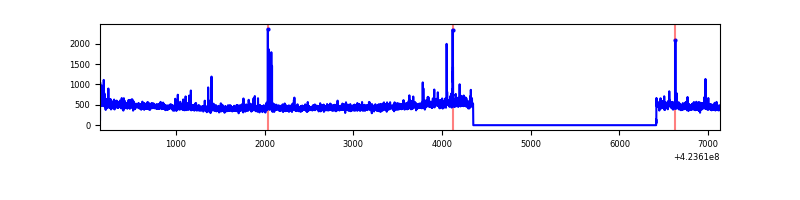 |
| C | 6989 | 4926 | 263 | 263 | 3.76% | 5.34% | 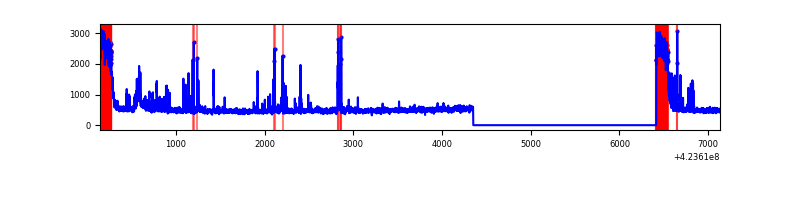 |
| D | 6989 | 4926 | 321 | 321 | 4.59% | 6.52% | 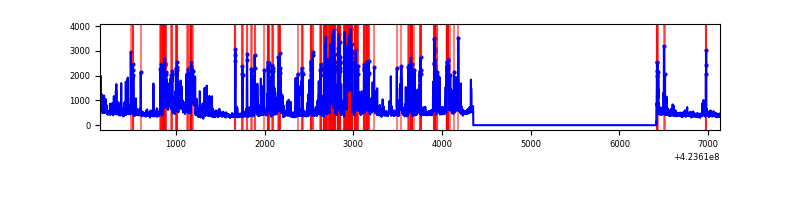 |
Top three noisy pixels from each quadrant. If the there are fewer than three noisy pixels in the level2.evt file, extra rows are filled as -1
| Pixel properties | Quadrant properties | ||||||
|---|---|---|---|---|---|---|---|
| Quadrant | DetID | PixID | Counts | Sigma | Mean | Median | Sigma |
| A | 10 | 83 | 477403 | 4273.04 | 547 | 536 | 111.6 |
| A | 14 | 235 | 87043 | 775.16 | 547 | 536 | 111.6 |
| A | 13 | 248 | 9732 | 82.4 | 547 | 536 | 111.6 |
| B | 5 | 255 | 52564 | 493.06 | 545 | 530 | 105.5 |
| B | 0 | 189 | 45188 | 423.17 | 545 | 530 | 105.5 |
| B | 0 | 245 | 28034 | 260.62 | 545 | 530 | 105.5 |
| C | 0 | 10 | 651992 | 5290.52 | 524 | 527 | 123.1 |
| C | 14 | 254 | 238740 | 1934.52 | 524 | 527 | 123.1 |
| C | 15 | 214 | 212102 | 1718.19 | 524 | 527 | 123.1 |
| D | 1 | 47 | 909560 | 7194.73 | 523 | 509 | 126.3 |
| D | 5 | 222 | 368113 | 2909.42 | 523 | 509 | 126.3 |
| D | 13 | 249 | 307639 | 2430.8 | 523 | 509 | 126.3 |
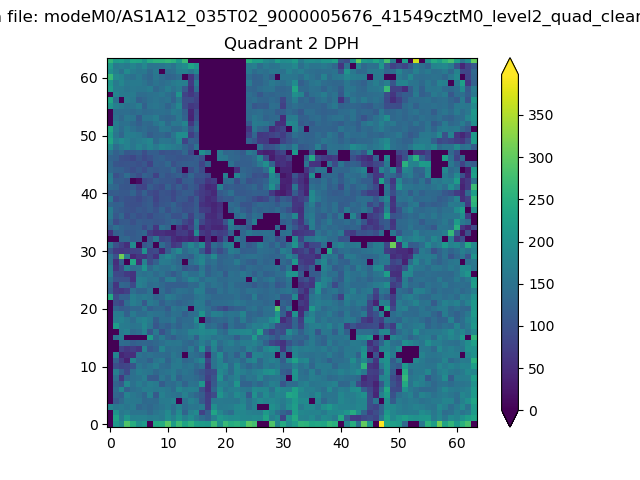
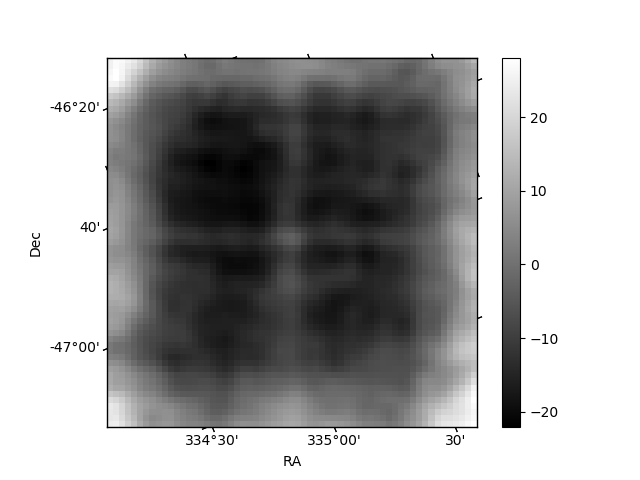
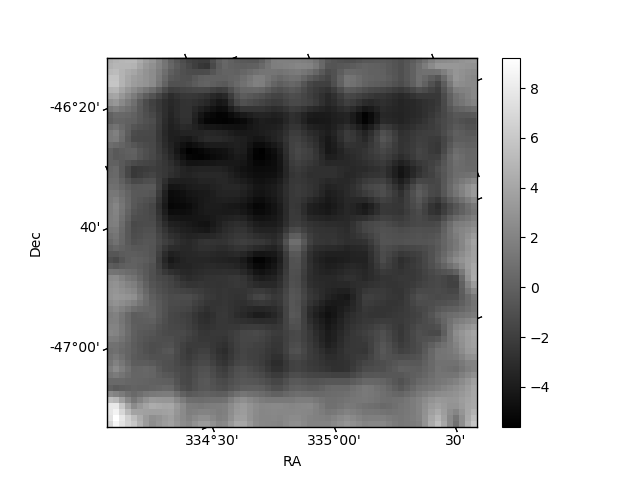
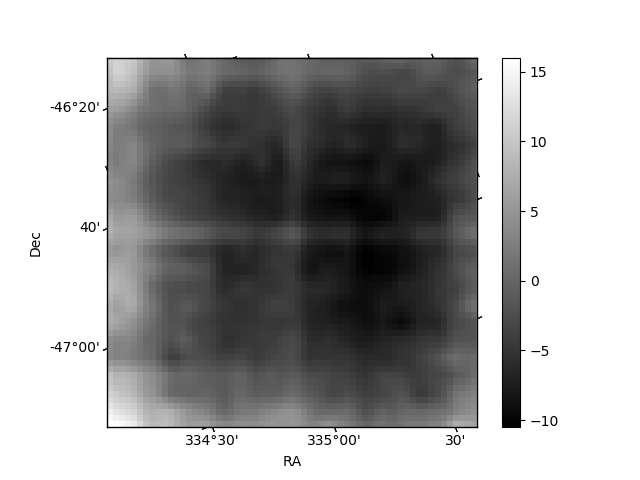
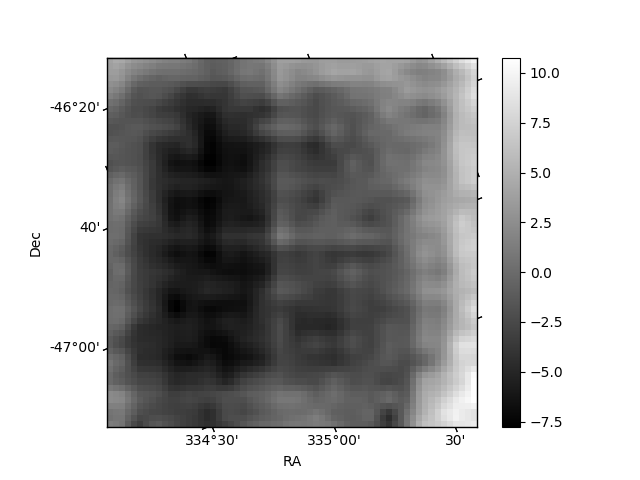
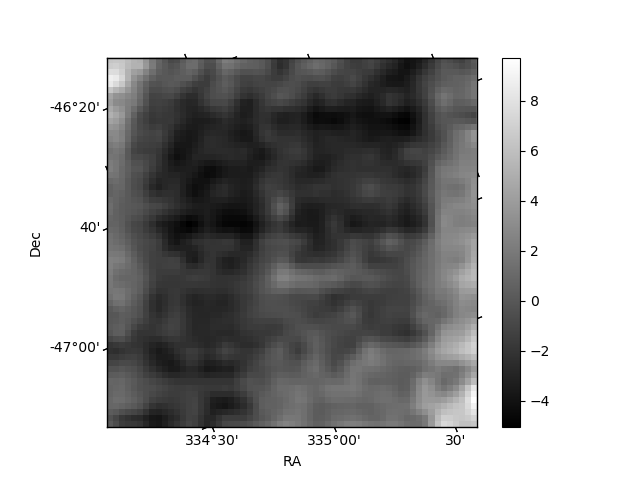
Histogram calculated using DETX and DETY for each event in the final _common_clean file
| Quadrant A | 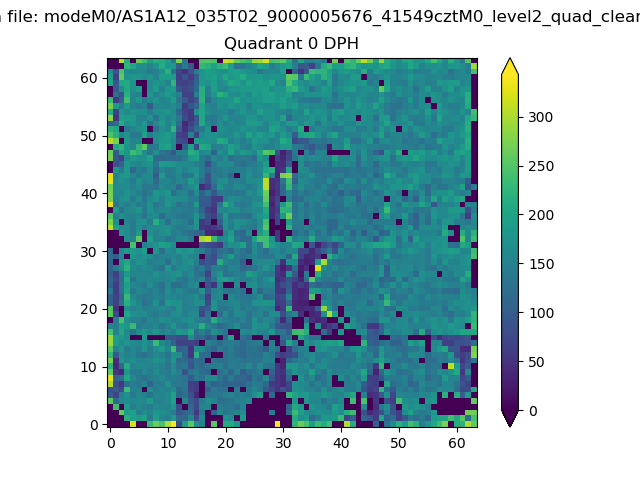 |
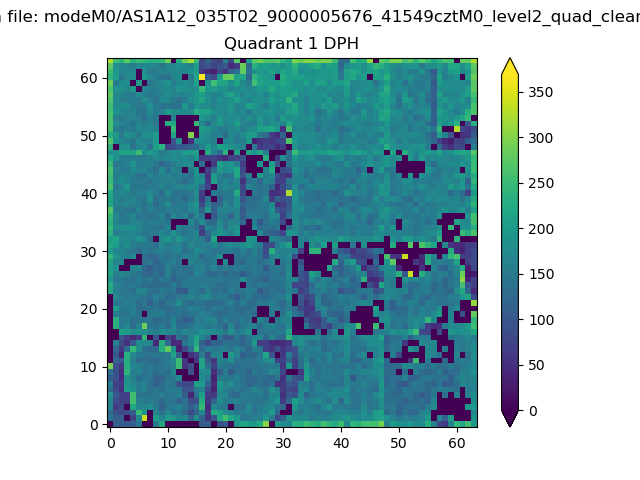 |
Quadrant B |
|---|---|---|---|
| Quadrant D | 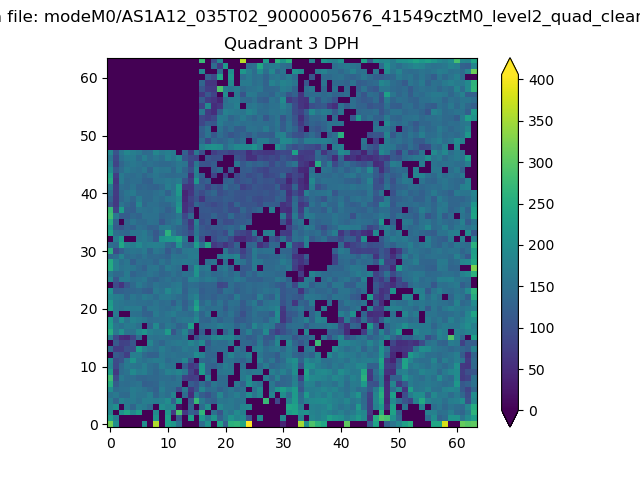 |
 |
Quadrant C |
| Plot type | Count rate plots | Images |
|---|---|---|
| Comparison with Poisson distribution Blue bars denote a histogram of data divided into 1 sec bins. Red curve is a Poisson curve with rate = median count rate of data. |
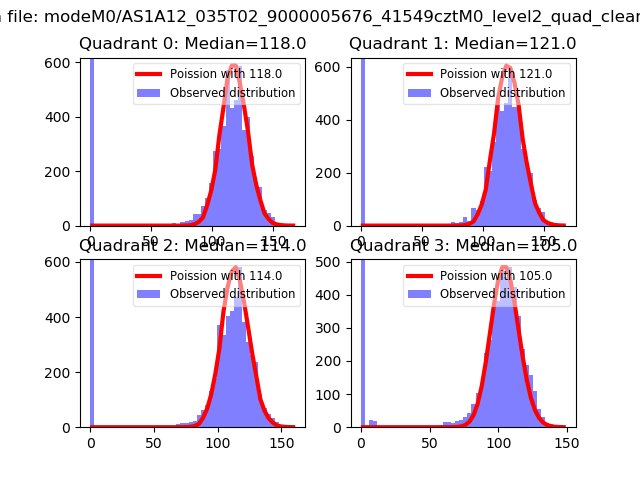 |
 |
| Quadrant-wise count rates Data is divided into 100 sec bins |
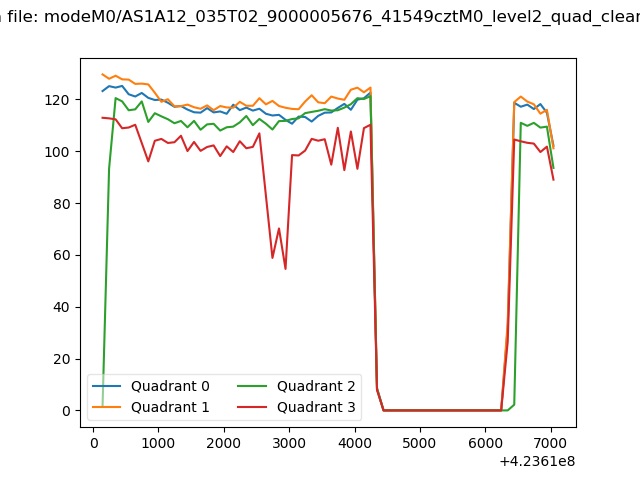 |
|
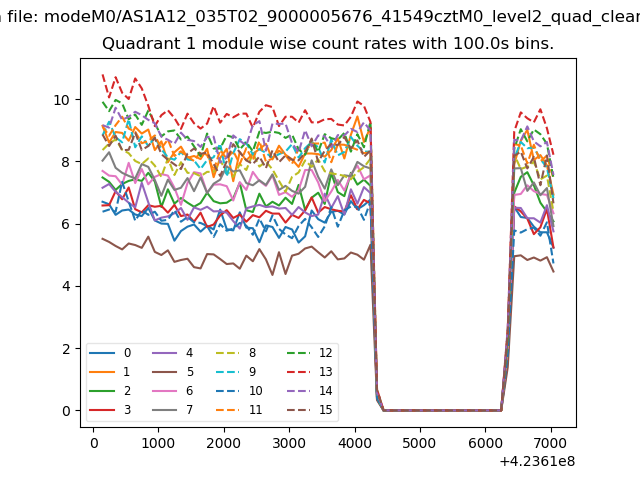
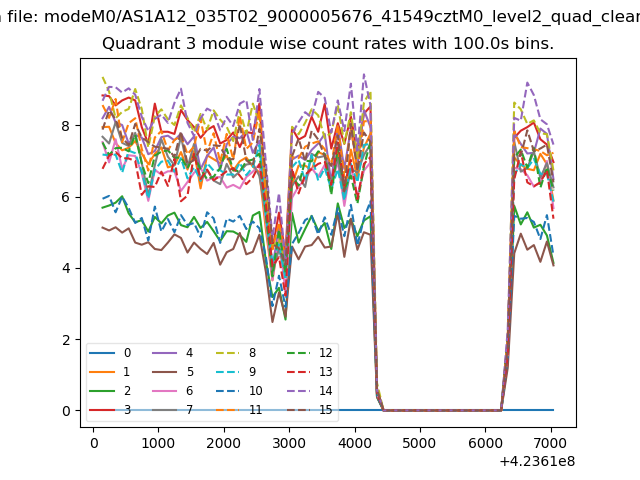
| Module-wise count rates for Quadrant A Data is divided into 100 sec bins |
 |
 |
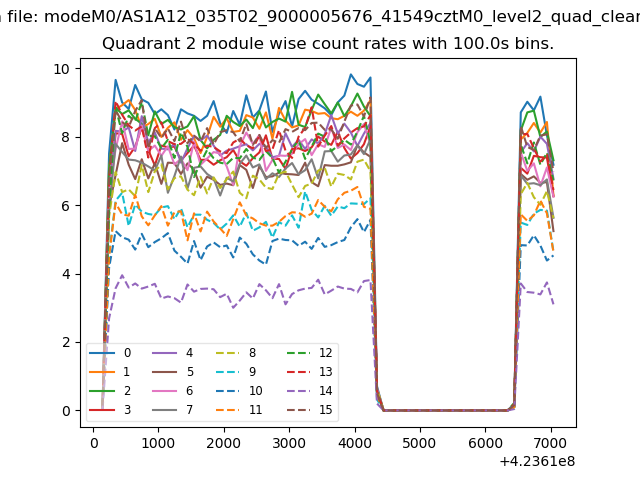
| Module-wise count rates for Quadrant B Data is divided into 100 sec bins |
 |
 |
| Module-wise count rates for Quadrant C Data is divided into 100 sec bins |
 |
 |
| Module-wise count rates for Quadrant D Data is divided into 100 sec bins |
 |
 |
| Parameter | Plot |
|---|---|
| CZT HV Monitor | 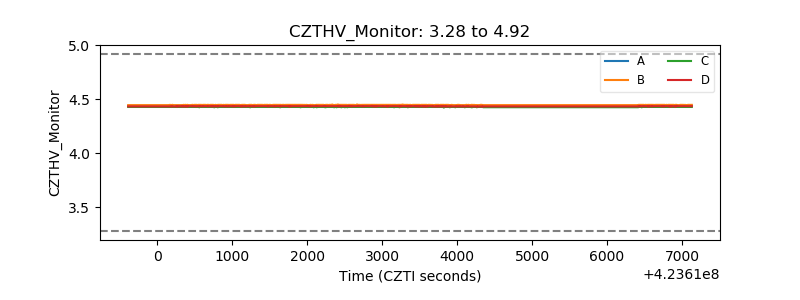 |
| D_VDD | 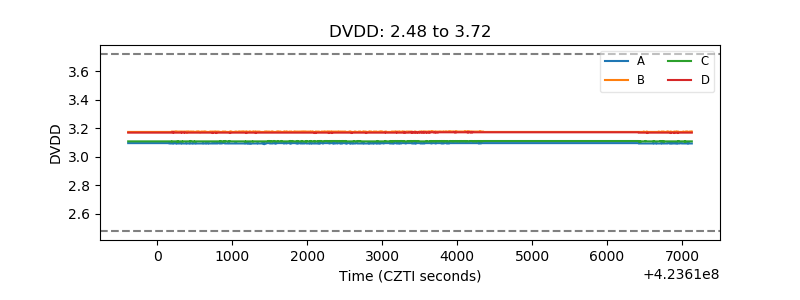 |
| Temperature 1 | 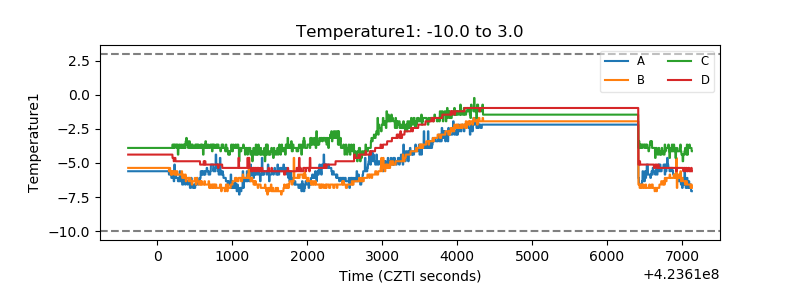 |
| Veto HV Monitor | 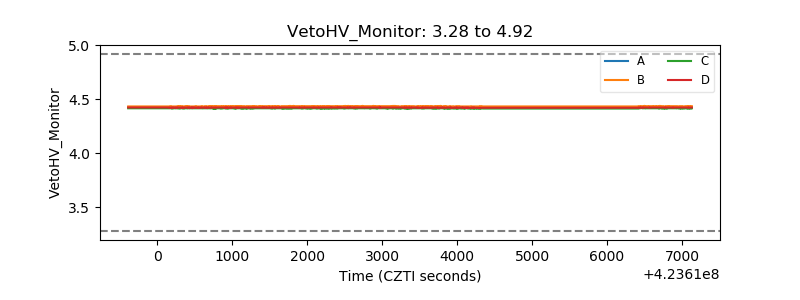 |
| Veto LLD | 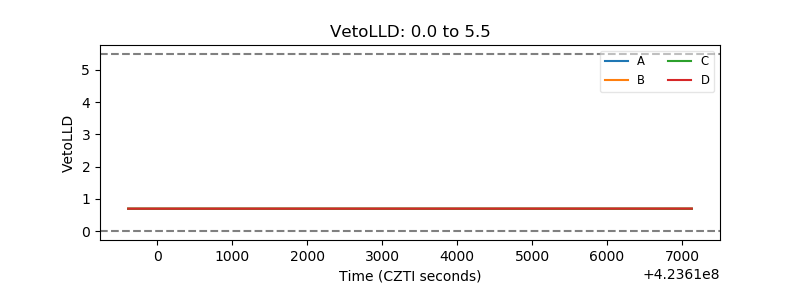 |
| Alpha Counter | 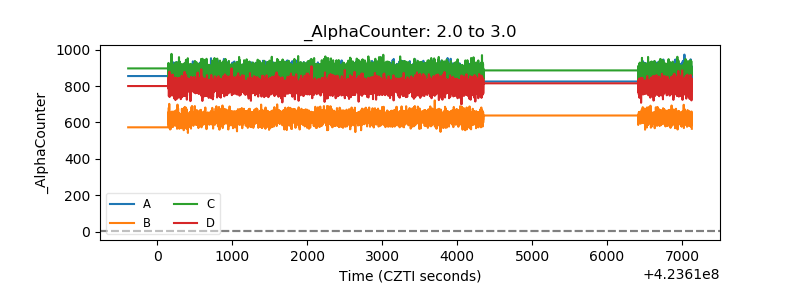 |
| _CPM_Rate | 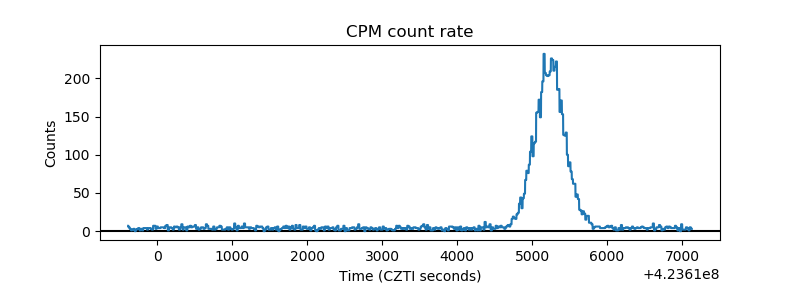 |
| CZT Counter | 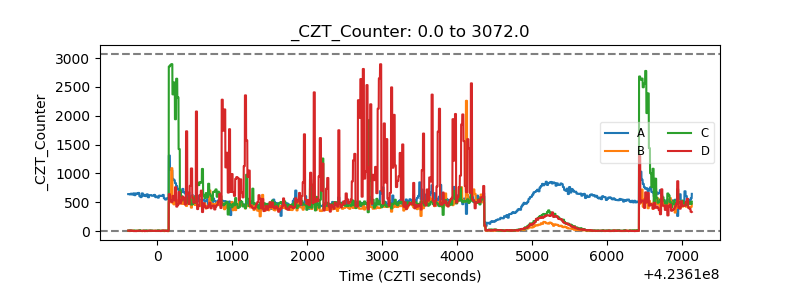 |
| +2.5 Volts monitor | 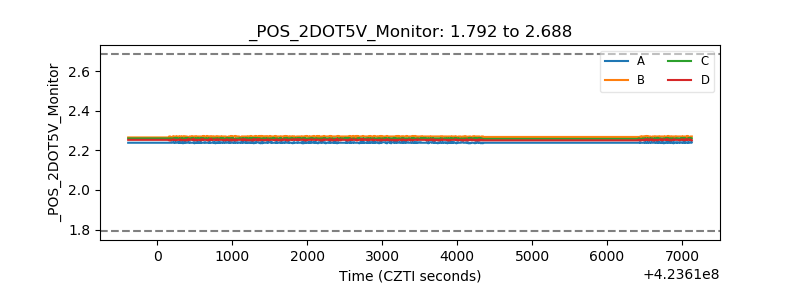 |
| +5 Volts monitor | 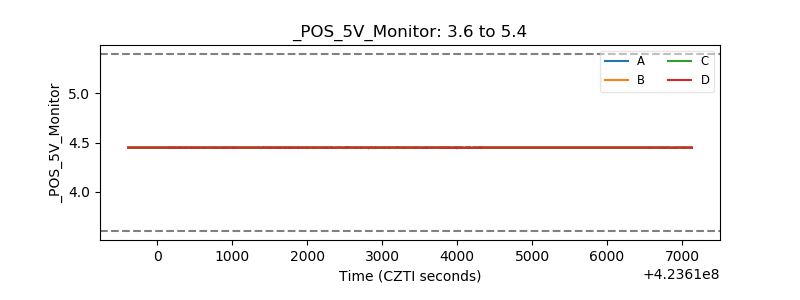 |
| _ROLL_ROT | 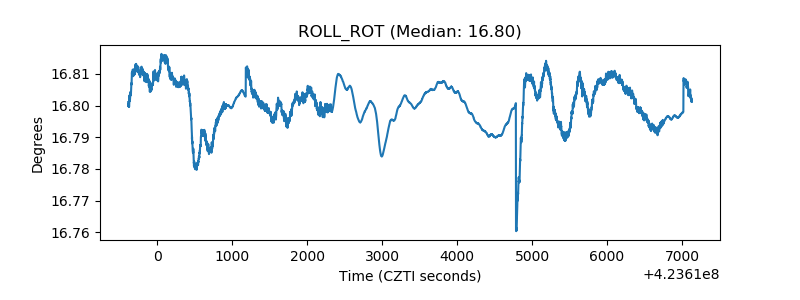 |
| _Roll_DEC | 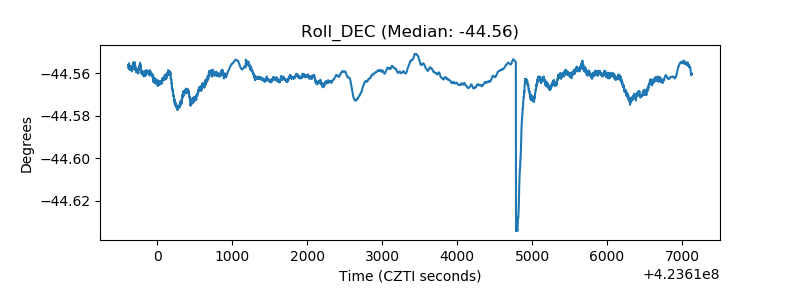 |
| _Roll_RA | 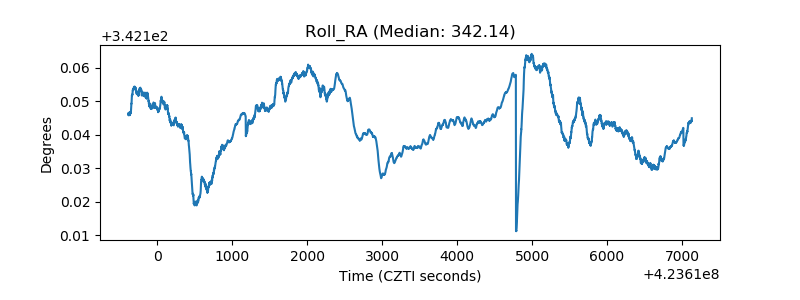 |
| Veto Counter | 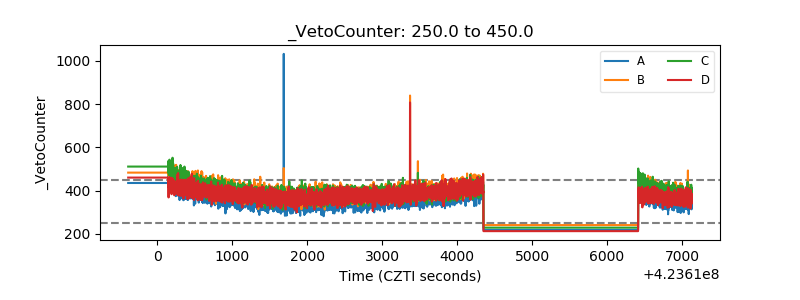 |