| Param | Original file | Final file |
|---|---|---|
| Filename | modeM0/AS1A12_035T02_9000005676_41578cztM0_level2.fits | modeM0/AS1A12_035T02_9000005676_41578cztM0_level2_quad_clean.evt |
| Size (bytes) | 366,600,960 | 82,451,520 |
| Size | 349.6 MB | 78.6 MB |
| Events in quadrant A | 2,817,017 | 580,207 |
| Events in quadrant B | 2,314,631 | 593,462 |
| Events in quadrant C | 4,666,771 | 477,691 |
| Events in quadrant D | 3,389,356 | 500,767 |
| Mode SS | |||
|---|---|---|---|
| Quadrant | BADHDUFLAG | Total packets | Discarded packets |
| A | 0 | 100 | 0 |
| B | 0 | 100 | 0 |
| C | 0 | 100 | 0 |
| D | 0 | 100 | 0 |
| Mode M0 | |||
|---|---|---|---|
| Quadrant | BADHDUFLAG | Total packets | Discarded packets |
| A | 0 | 11314 | 2 |
| B | 0 | 10239 | 3 |
| C | 0 | 17067 | 2 |
| D | 0 | 13588 | 2 |
| Mode M9 | |||
|---|---|---|---|
| Quadrant | BADHDUFLAG | Total packets | Discarded packets |
| A | 0 | 34 | 0 |
| B | 0 | 35 | 0 |
| C | 0 | 35 | 0 |
| D | 0 | 35 | 0 |
| Quadrant | Total seconds | Saturated seconds | Saturation percentage |
|---|---|---|---|
| A | 4913 | 24 | 0.488500% |
| B | 4912 | 12 | 0.244300% |
| C | 4912 | 821 | 16.714169% |
| D | 4912 | 229 | 4.662052% |
Noise dominated data is calculated using 1-second bins in cleaned event files. If a bin has >2000 counts, and if more than 50% of those come from <1% of pixels, then it is considered to be noise-dominated and hence unusable.
| Quadrant | # 1 sec bins | Bins with >0 counts | Bins with >2000 counts | High rate bins dominated by noise | Noise dominated (total time) | Noise dominated (detector-on time) | Marked lightcurve |
|---|---|---|---|---|---|---|---|
| A | 6975 | 4914 | 6 | 6 | 0.09% | 0.12% | 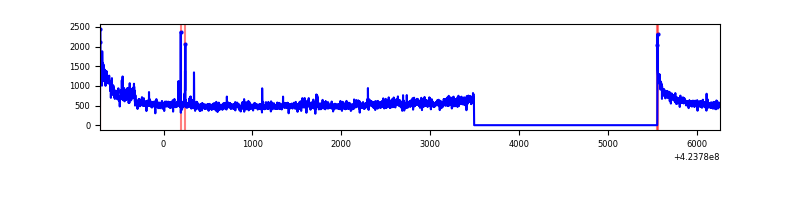 |
| B | 6974 | 4913 | 2 | 2 | 0.03% | 0.04% | 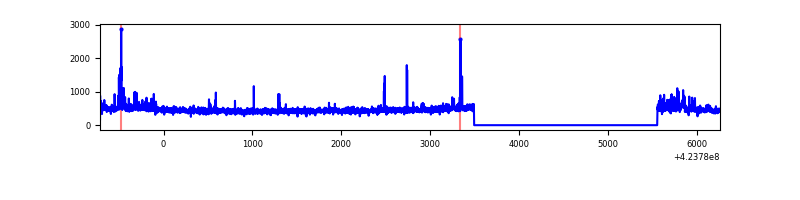 |
| C | 6974 | 4913 | 725 | 725 | 10.40% | 14.76% | 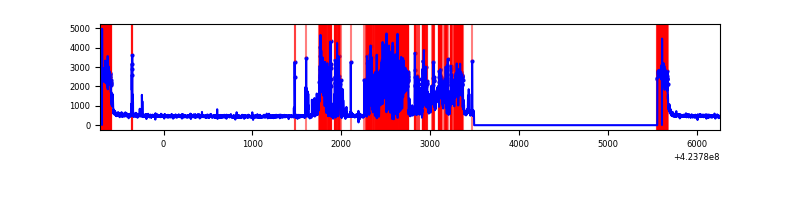 |
| D | 6974 | 4913 | 190 | 190 | 2.72% | 3.87% | 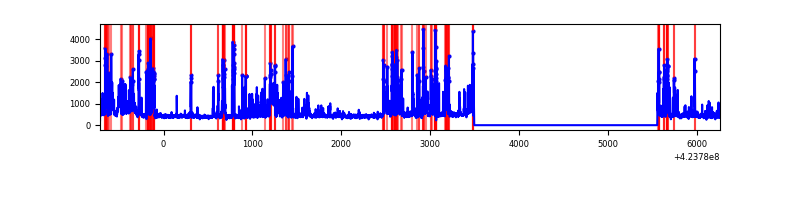 |
Top three noisy pixels from each quadrant. If the there are fewer than three noisy pixels in the level2.evt file, extra rows are filled as -1
| Pixel properties | Quadrant properties | ||||||
|---|---|---|---|---|---|---|---|
| Quadrant | DetID | PixID | Counts | Sigma | Mean | Median | Sigma |
| A | 10 | 83 | 484276 | 4299.06 | 548 | 537 | 112.5 |
| A | 15 | 223 | 118050 | 1044.35 | 548 | 537 | 112.5 |
| A | 2 | 79 | 88198 | 779.06 | 548 | 537 | 112.5 |
| B | 0 | 245 | 94822 | 890.67 | 547 | 531 | 105.9 |
| B | 15 | 32 | 28740 | 266.46 | 547 | 531 | 105.9 |
| B | 5 | 255 | 22466 | 207.19 | 547 | 531 | 105.9 |
| C | 14 | 254 | 1902677 | 16402.63 | 495 | 499 | 116.0 |
| C | 0 | 10 | 626986 | 5402.25 | 495 | 499 | 116.0 |
| C | 15 | 214 | 202065 | 1738.12 | 495 | 499 | 116.0 |
| D | 13 | 249 | 1136747 | 8763.31 | 528 | 513 | 129.7 |
| D | 12 | 6 | 120052 | 921.96 | 528 | 513 | 129.7 |
| D | 10 | 199 | 62697 | 479.6 | 528 | 513 | 129.7 |
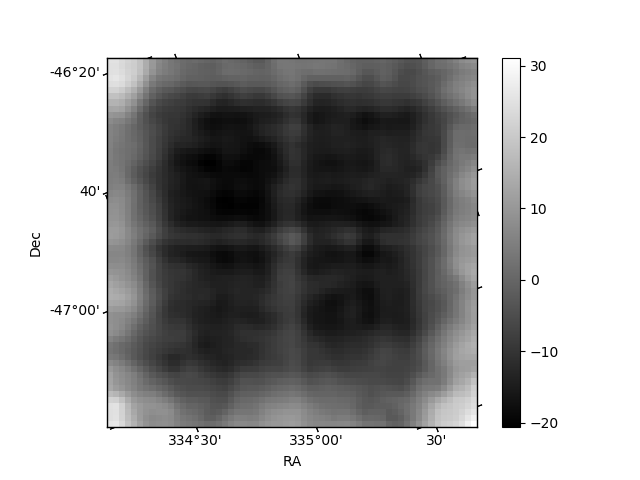
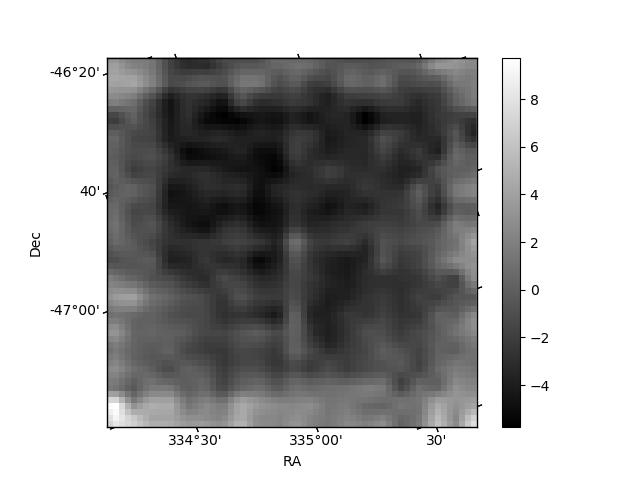
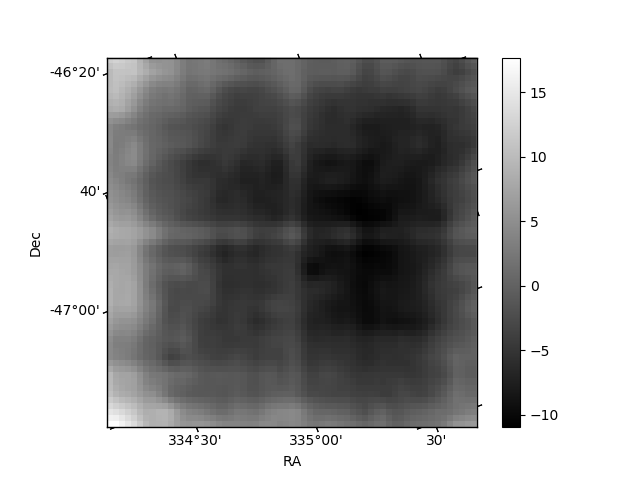
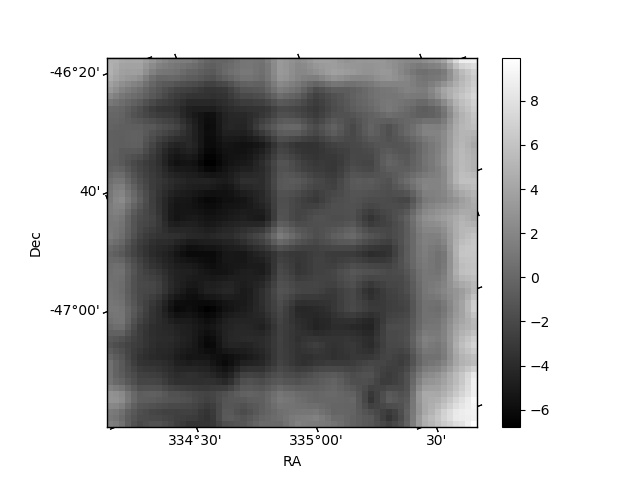
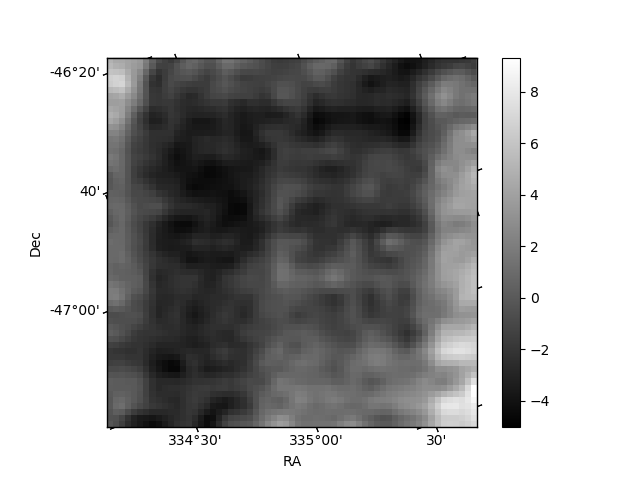
Histogram calculated using DETX and DETY for each event in the final _common_clean file
| Quadrant A | 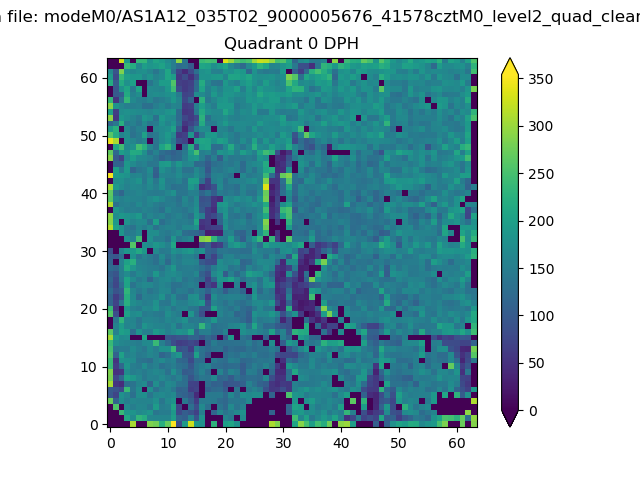 |
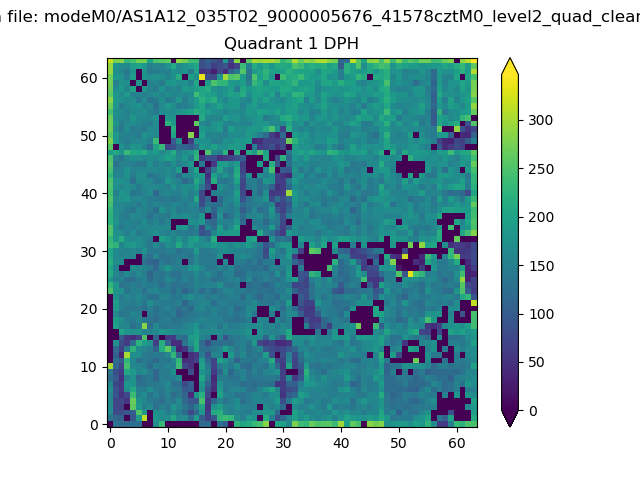 |
Quadrant B |
|---|---|---|---|
| Quadrant D | 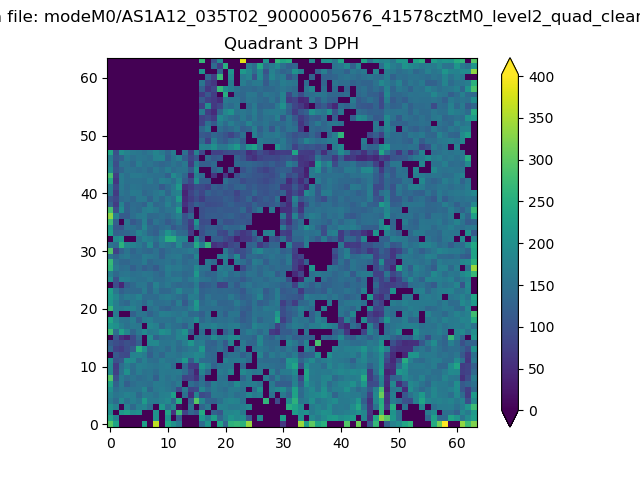 |
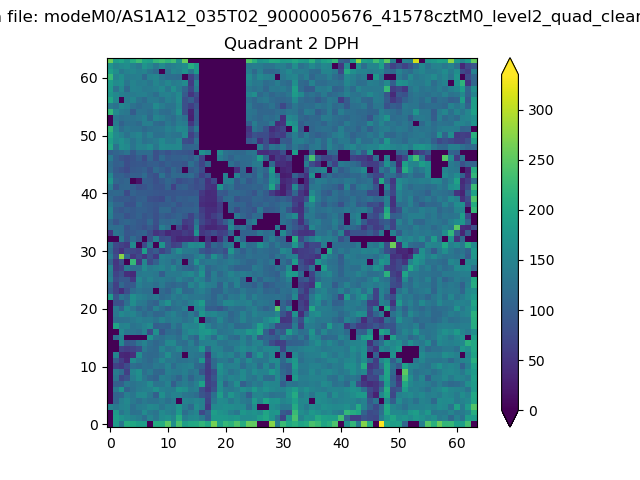 |
Quadrant C |
| Plot type | Count rate plots | Images |
|---|---|---|
| Comparison with Poisson distribution Blue bars denote a histogram of data divided into 1 sec bins. Red curve is a Poisson curve with rate = median count rate of data. |
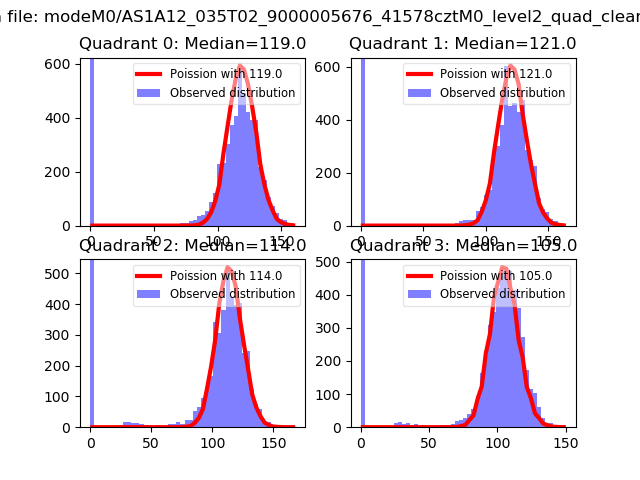 |
 |
| Quadrant-wise count rates Data is divided into 100 sec bins |
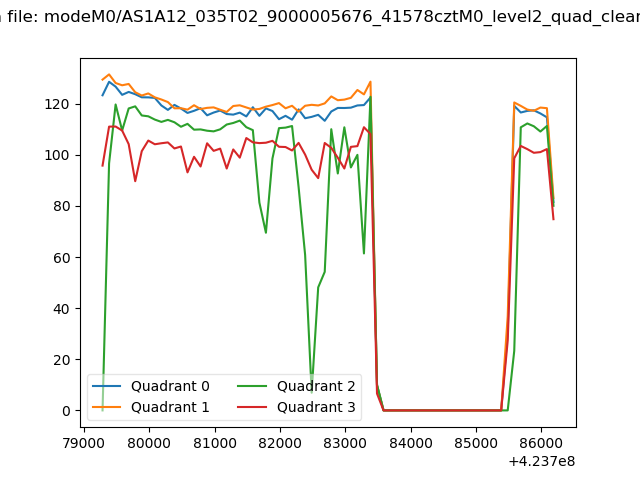 |
|
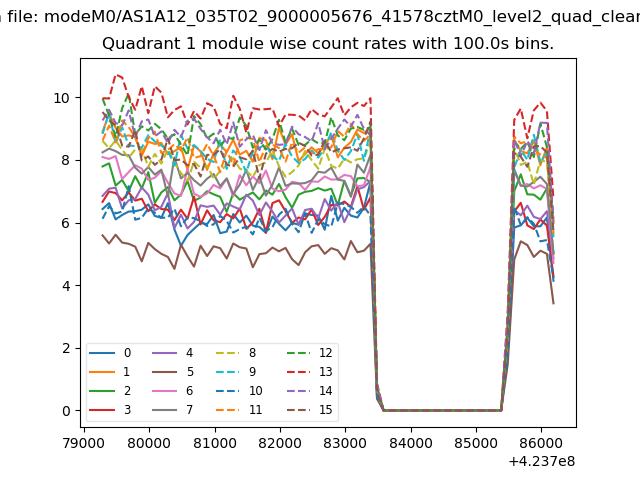
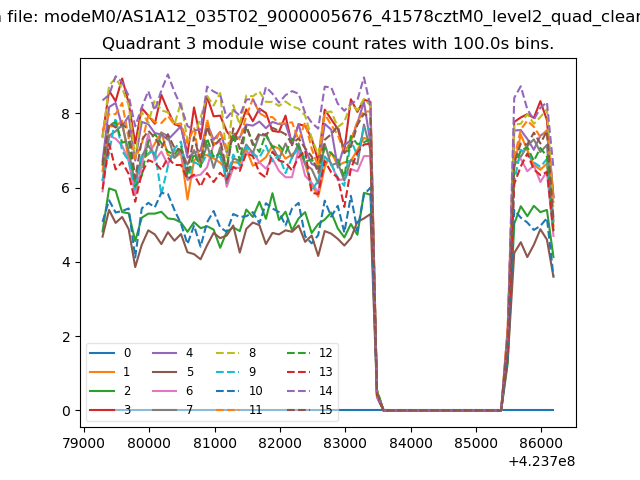
| Module-wise count rates for Quadrant A Data is divided into 100 sec bins |
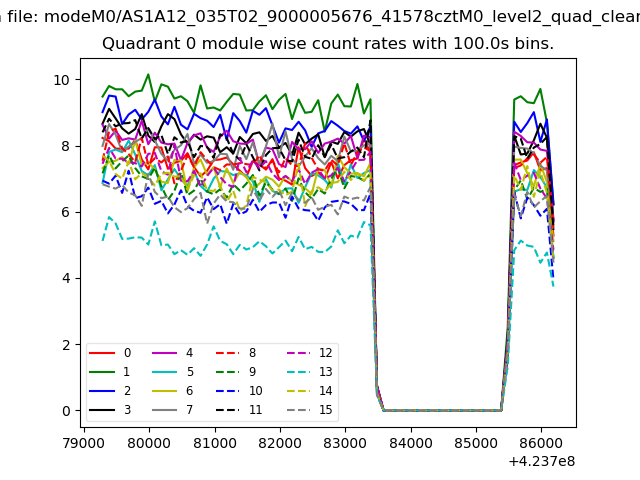 |
 |
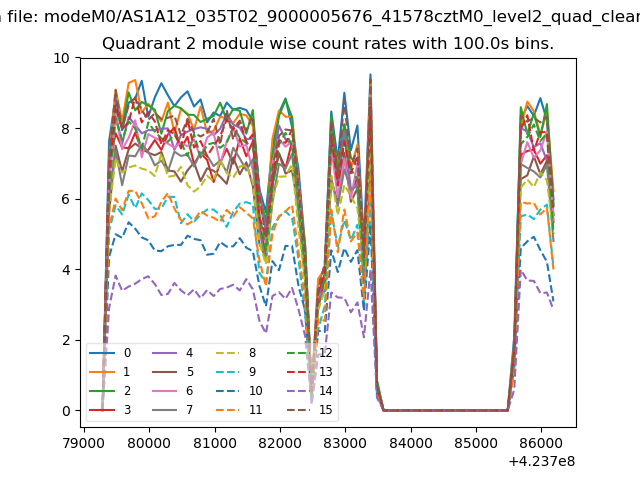
| Module-wise count rates for Quadrant B Data is divided into 100 sec bins |
 |
 |
| Module-wise count rates for Quadrant C Data is divided into 100 sec bins |
 |
 |
| Module-wise count rates for Quadrant D Data is divided into 100 sec bins |
 |
 |
| Parameter | Plot |
|---|---|
| CZT HV Monitor | 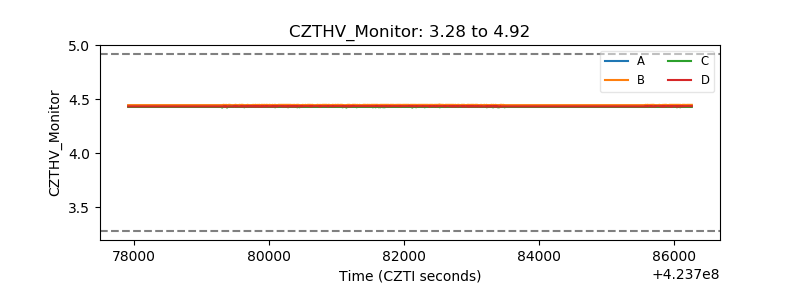 |
| D_VDD |  |
| Temperature 1 | 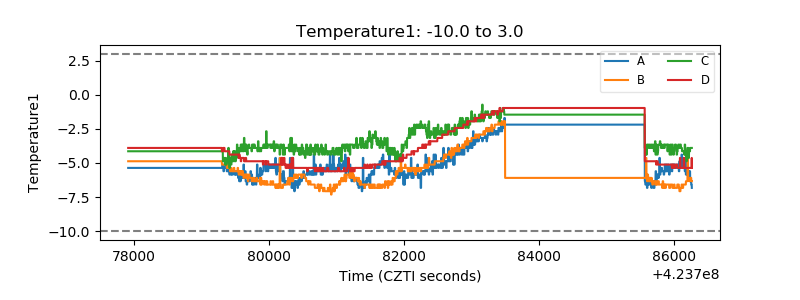 |
| Veto HV Monitor | 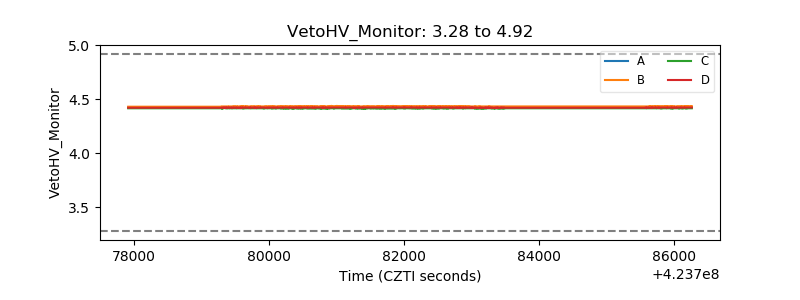 |
| Veto LLD | 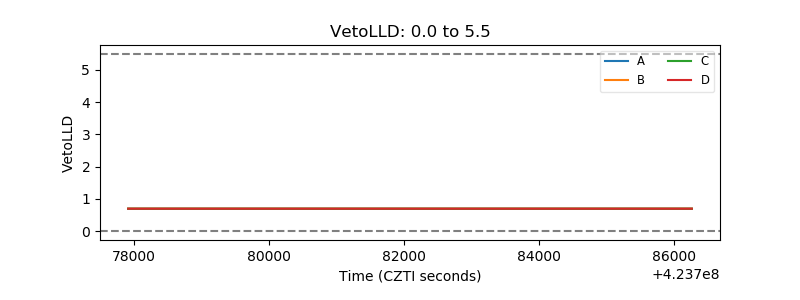 |
| Alpha Counter | 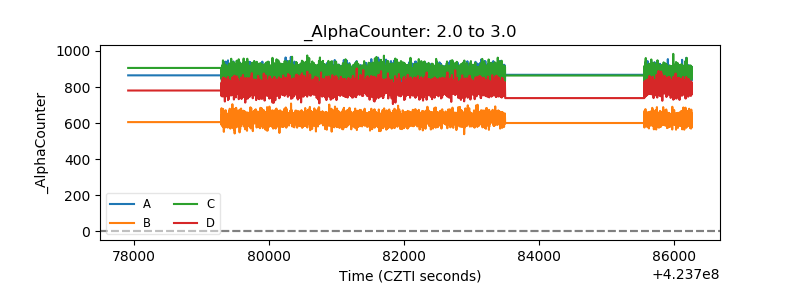 |
| _CPM_Rate | 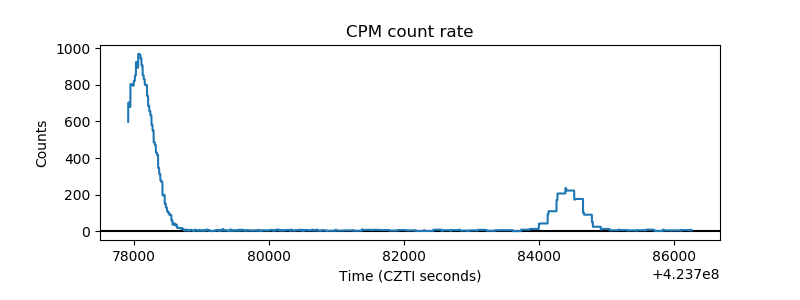 |
| CZT Counter | 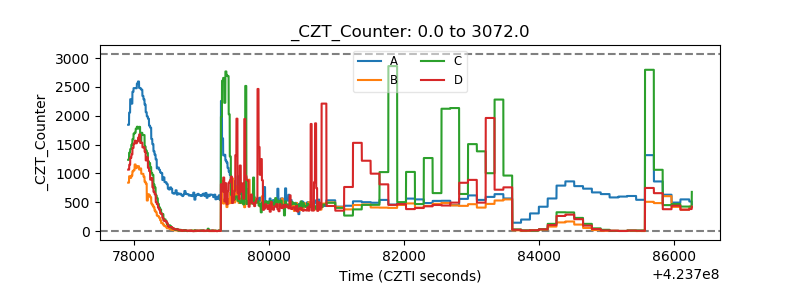 |
| +2.5 Volts monitor | 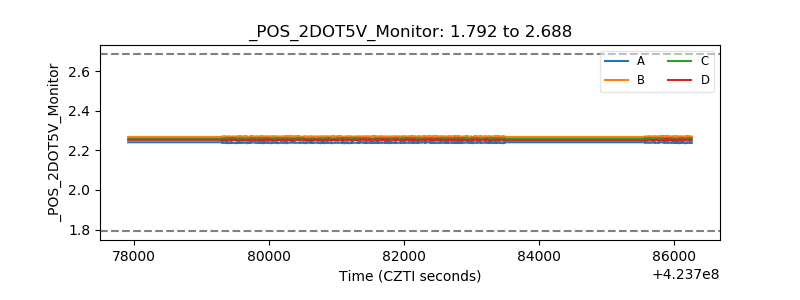 |
| +5 Volts monitor | 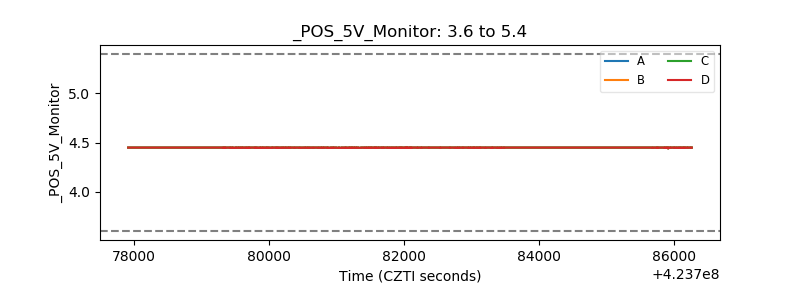 |
| _ROLL_ROT | 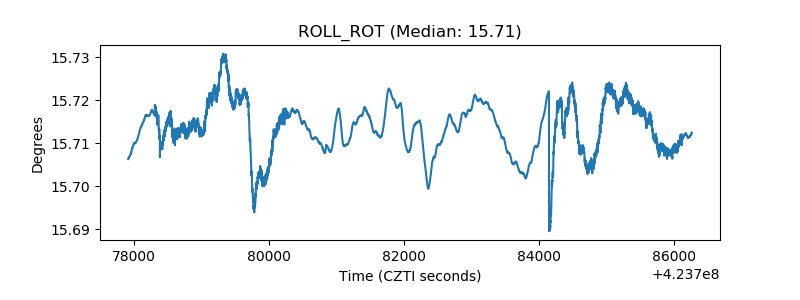 |
| _Roll_DEC | 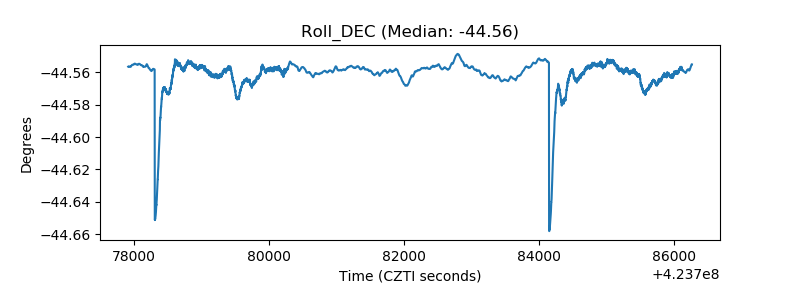 |
| _Roll_RA | 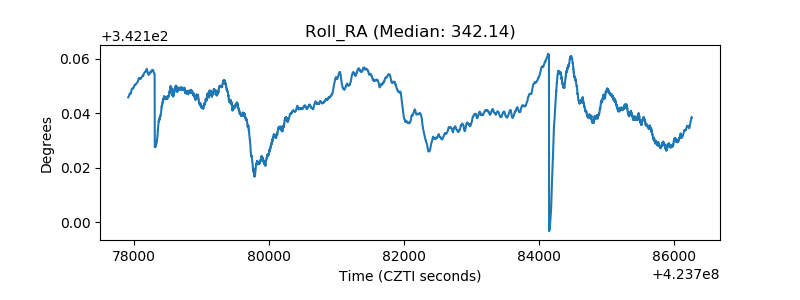 |
| Veto Counter | 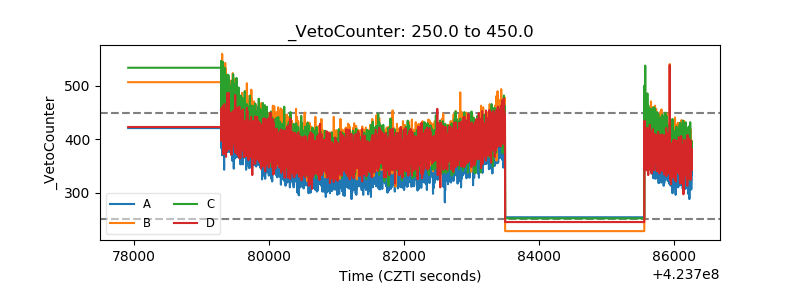 |