| Param | Original file | Final file |
|---|---|---|
| Filename | modeM0/AS1A12_035T02_9000005676_41579cztM0_level2.fits | modeM0/AS1A12_035T02_9000005676_41579cztM0_level2_quad_clean.evt |
| Size (bytes) | 333,725,760 | 89,971,200 |
| Size | 318.3 MB | 85.8 MB |
| Events in quadrant A | 2,909,512 | 611,527 |
| Events in quadrant B | 2,446,102 | 627,312 |
| Events in quadrant C | 3,575,710 | 564,655 |
| Events in quadrant D | 3,000,909 | 543,115 |
| Mode SS | |||
|---|---|---|---|
| Quadrant | BADHDUFLAG | Total packets | Discarded packets |
| A | 0 | 110 | 0 |
| B | 0 | 110 | 0 |
| C | 0 | 110 | 0 |
| D | 0 | 110 | 0 |
| Mode M0 | |||
|---|---|---|---|
| Quadrant | BADHDUFLAG | Total packets | Discarded packets |
| A | 0 | 11936 | 2 |
| B | 0 | 11006 | 2 |
| C | 0 | 14070 | 2 |
| D | 0 | 12851 | 4 |
| Mode M9 | |||
|---|---|---|---|
| Quadrant | BADHDUFLAG | Total packets | Discarded packets |
| A | 0 | 40 | 0 |
| B | 0 | 40 | 0 |
| C | 0 | 40 | 0 |
| D | 0 | 40 | 0 |
| Quadrant | Total seconds | Saturated seconds | Saturation percentage |
|---|---|---|---|
| A | 5402 | 13 | 0.240652% |
| B | 5403 | 6 | 0.111049% |
| C | 5403 | 334 | 6.181751% |
| D | 5402 | 128 | 2.369493% |
Noise dominated data is calculated using 1-second bins in cleaned event files. If a bin has >2000 counts, and if more than 50% of those come from <1% of pixels, then it is considered to be noise-dominated and hence unusable.
| Quadrant | # 1 sec bins | Bins with >0 counts | Bins with >2000 counts | High rate bins dominated by noise | Noise dominated (total time) | Noise dominated (detector-on time) | Marked lightcurve |
|---|---|---|---|---|---|---|---|
| A | 9287 | 5404 | 4 | 4 | 0.04% | 0.07% | 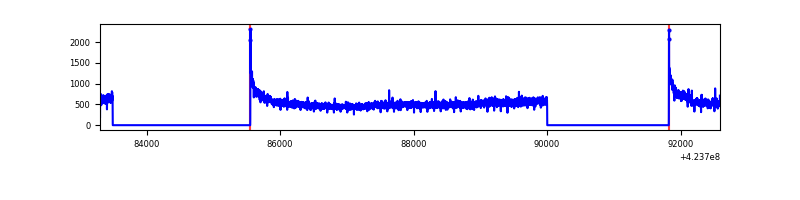 |
| B | 9288 | 5405 | 1 | 1 | 0.01% | 0.02% | 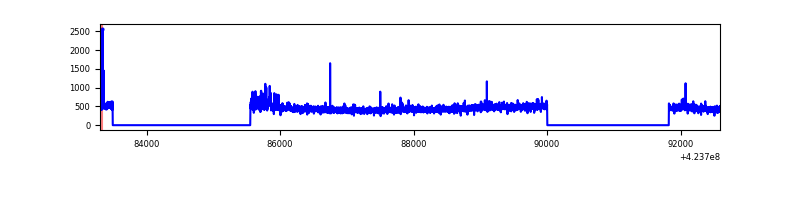 |
| C | 9288 | 5405 | 312 | 312 | 3.36% | 5.77% | 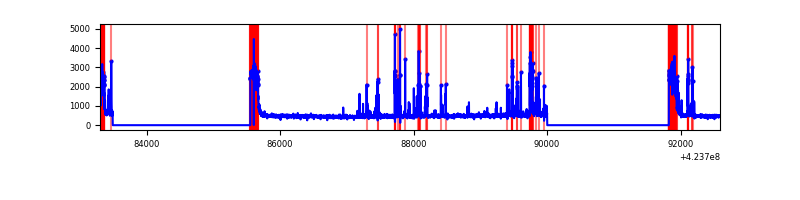 |
| D | 9287 | 5404 | 108 | 108 | 1.16% | 2.00% | 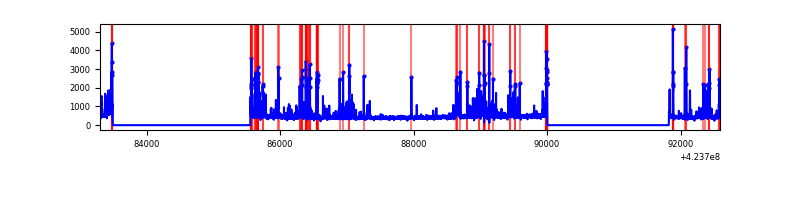 |
Top three noisy pixels from each quadrant. If the there are fewer than three noisy pixels in the level2.evt file, extra rows are filled as -1
| Pixel properties | Quadrant properties | ||||||
|---|---|---|---|---|---|---|---|
| Quadrant | DetID | PixID | Counts | Sigma | Mean | Median | Sigma |
| A | 10 | 83 | 515421 | 4267.58 | 596 | 585 | 120.6 |
| A | 15 | 223 | 84278 | 693.75 | 596 | 585 | 120.6 |
| A | 13 | 254 | 9472 | 73.67 | 596 | 585 | 120.6 |
| B | 0 | 245 | 51452 | 441.83 | 592 | 575 | 115.1 |
| B | 5 | 255 | 19575 | 165.0 | 592 | 575 | 115.1 |
| B | 0 | 155 | 17989 | 151.23 | 592 | 575 | 115.1 |
| C | 14 | 254 | 558268 | 4188.75 | 567 | 570 | 133.1 |
| C | 0 | 10 | 557221 | 4180.89 | 567 | 570 | 133.1 |
| C | 15 | 214 | 233420 | 1748.89 | 567 | 570 | 133.1 |
| D | 13 | 249 | 536269 | 3758.98 | 582 | 566 | 142.5 |
| D | 12 | 6 | 93979 | 655.47 | 582 | 566 | 142.5 |
| D | 13 | 112 | 51858 | 359.91 | 582 | 566 | 142.5 |
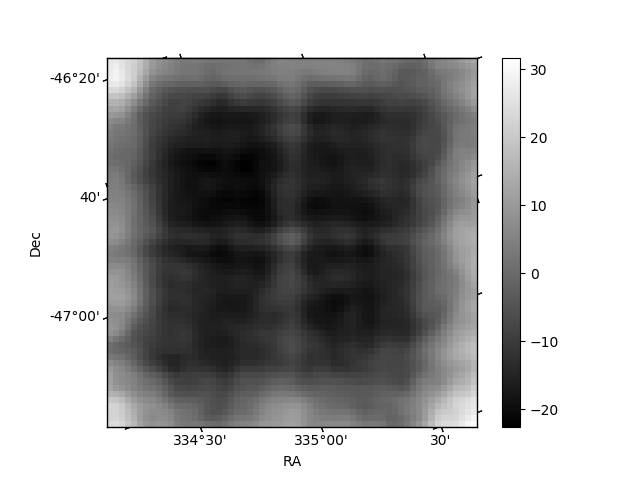
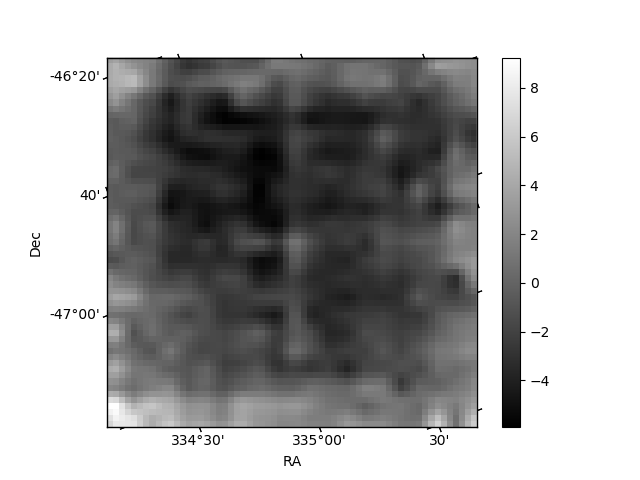
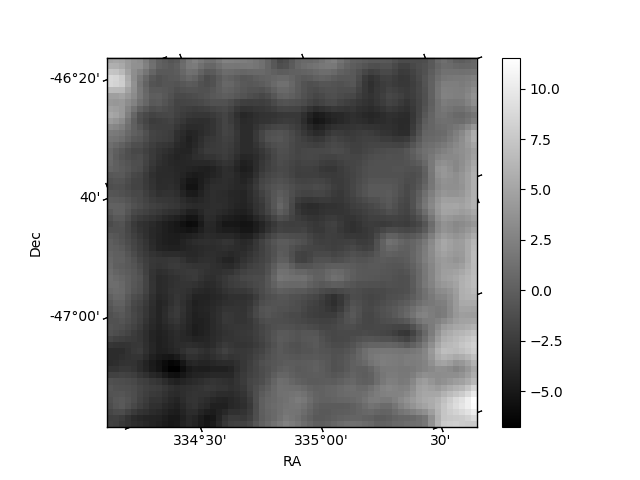
Histogram calculated using DETX and DETY for each event in the final _common_clean file
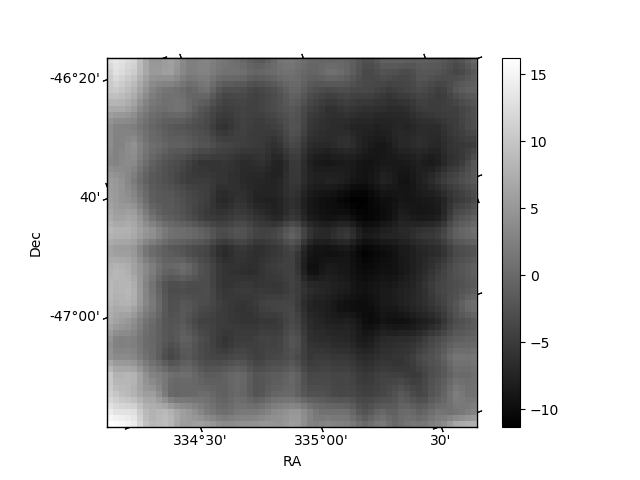
| Quadrant A | 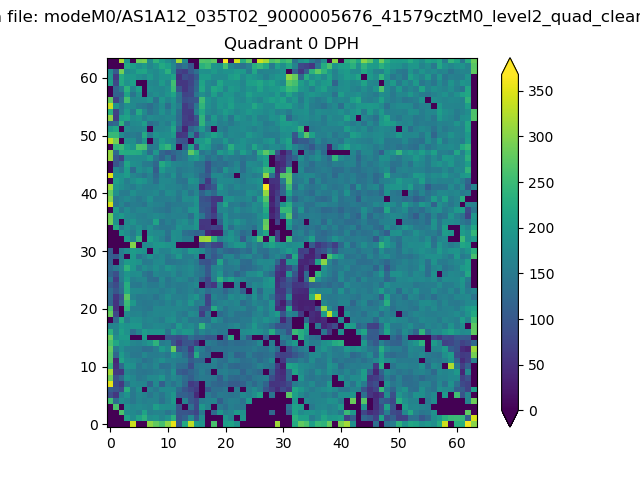 |
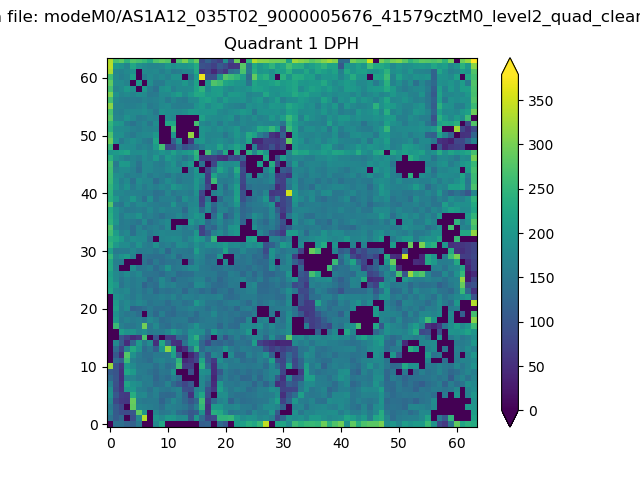 |
Quadrant B |
|---|---|---|---|
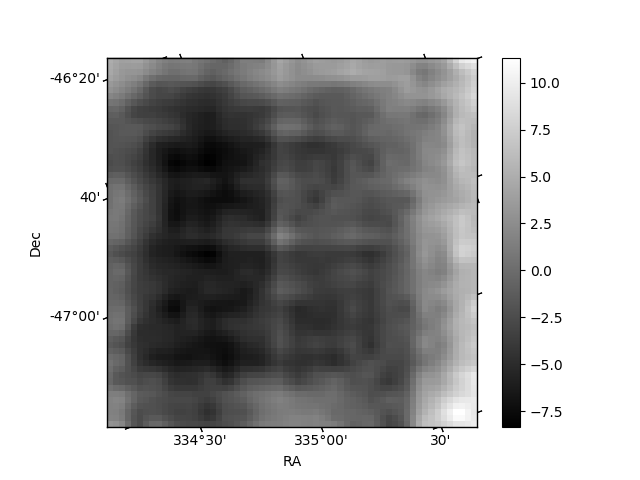
| Quadrant D | 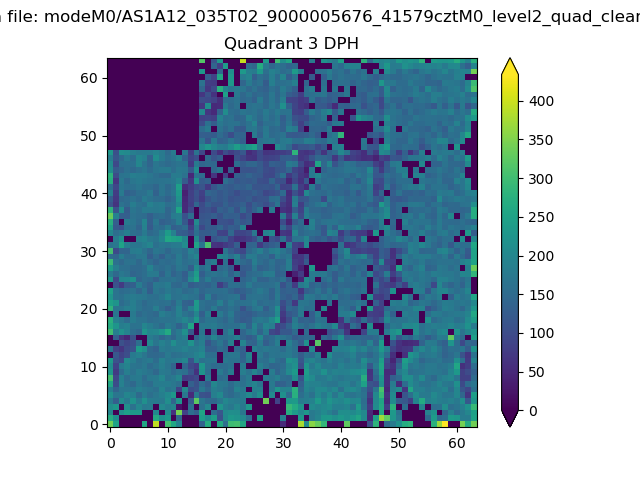 |
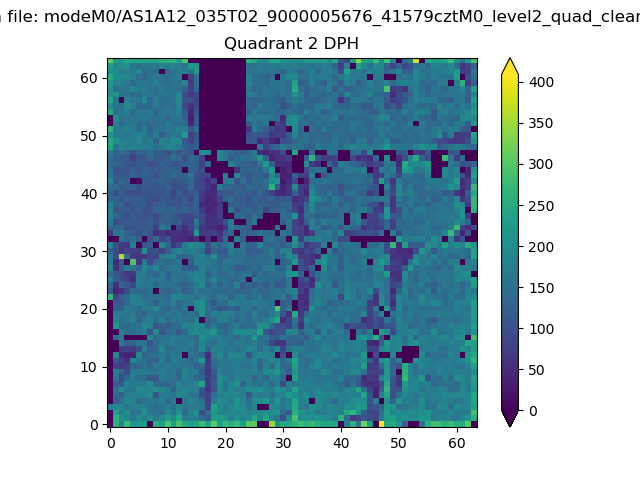 |
Quadrant C |
| Plot type | Count rate plots | Images |
|---|---|---|
| Comparison with Poisson distribution Blue bars denote a histogram of data divided into 1 sec bins. Red curve is a Poisson curve with rate = median count rate of data. |
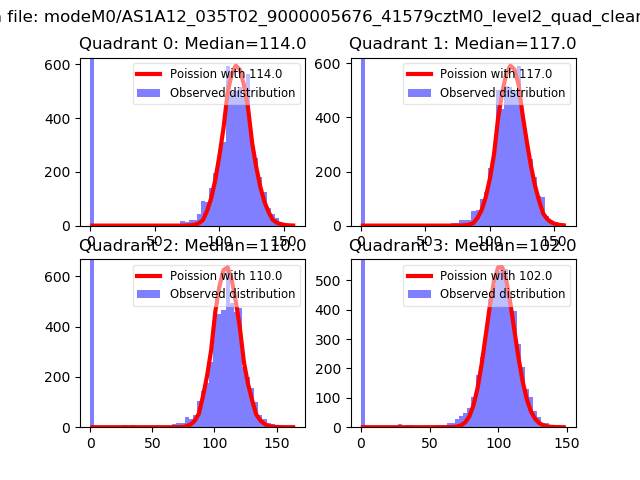 |
 |
| Quadrant-wise count rates Data is divided into 100 sec bins |
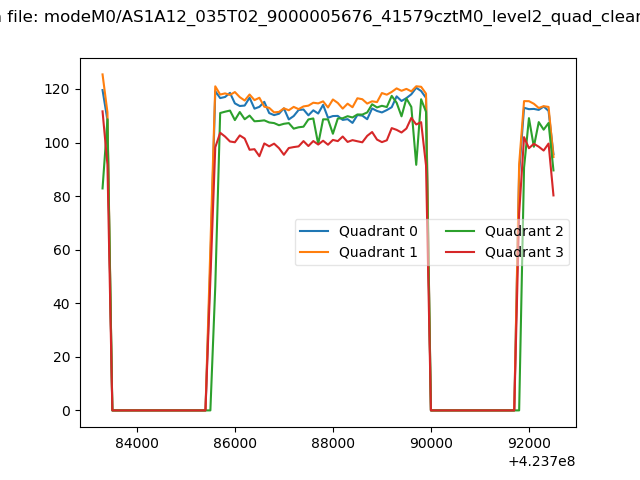 |
|
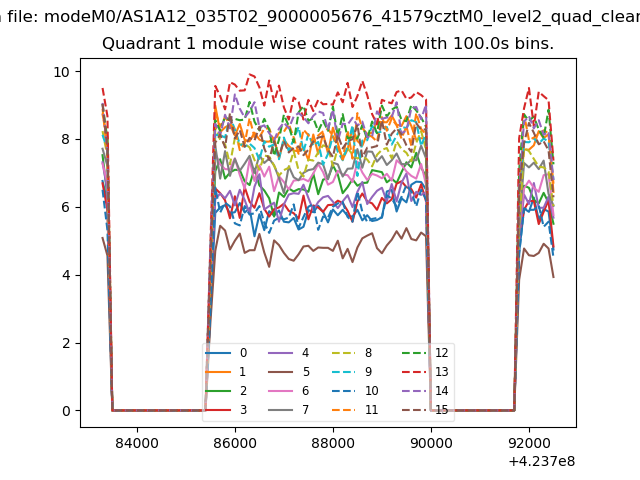
| Module-wise count rates for Quadrant A Data is divided into 100 sec bins |
 |
 |
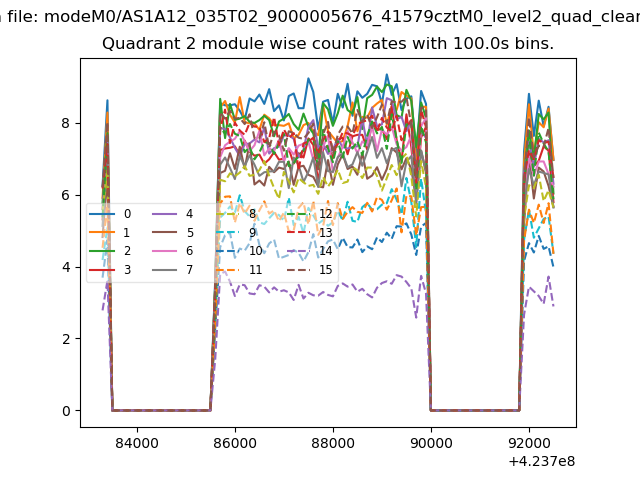
| Module-wise count rates for Quadrant B Data is divided into 100 sec bins |
 |
 |
| Module-wise count rates for Quadrant C Data is divided into 100 sec bins |
 |
 |
| Module-wise count rates for Quadrant D Data is divided into 100 sec bins |
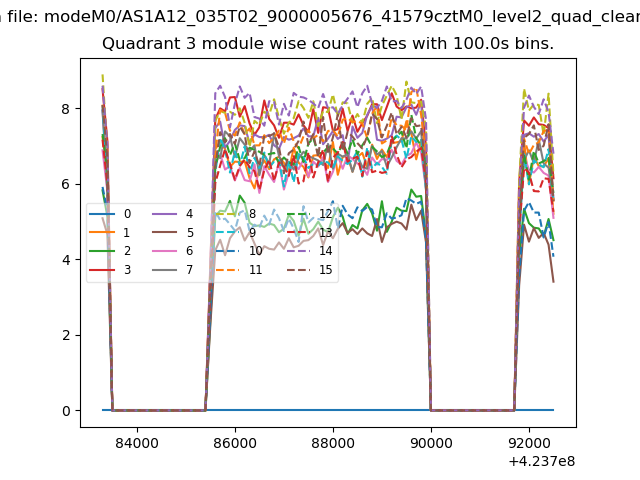 |
 |
| Parameter | Plot |
|---|---|
| CZT HV Monitor | 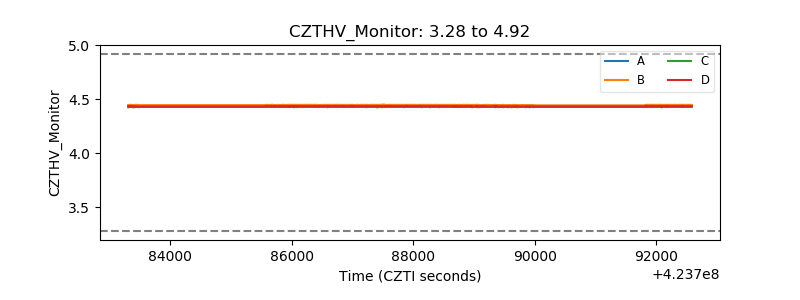 |
| D_VDD | 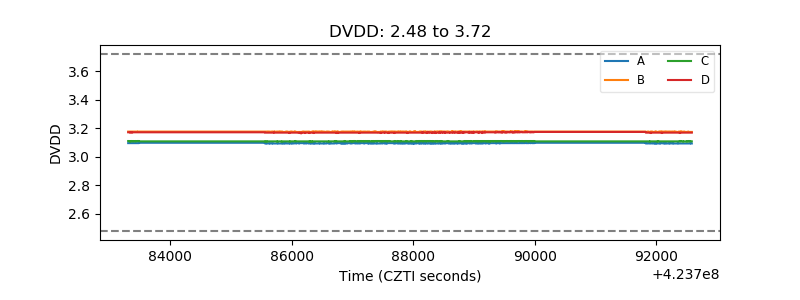 |
| Temperature 1 | 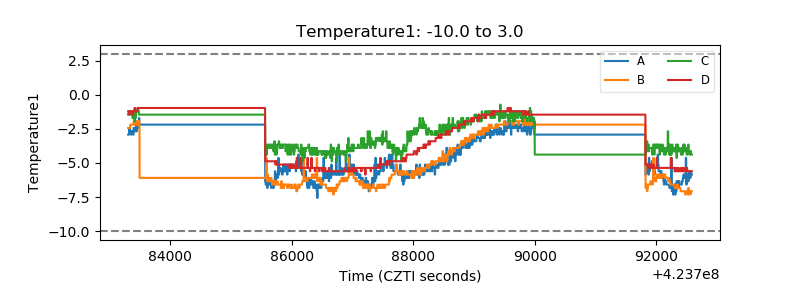 |
| Veto HV Monitor | 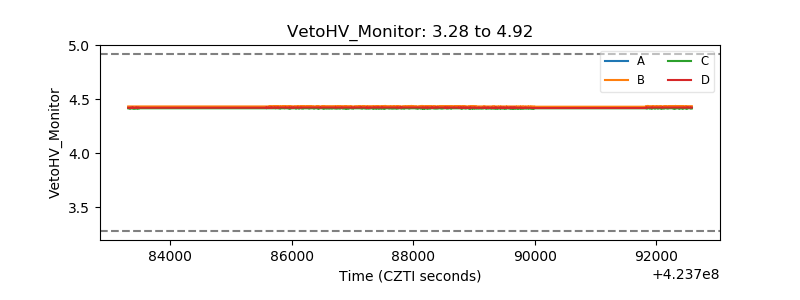 |
| Veto LLD | 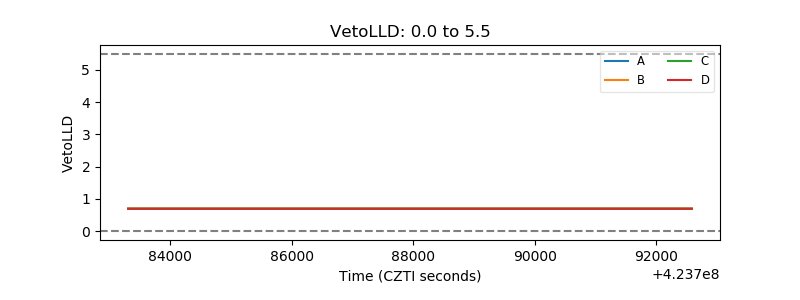 |
| Alpha Counter | 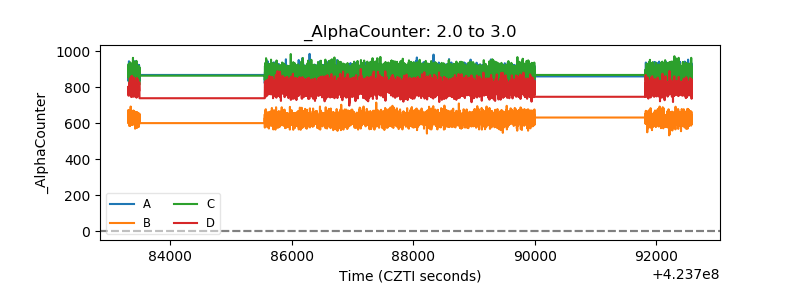 |
| _CPM_Rate | 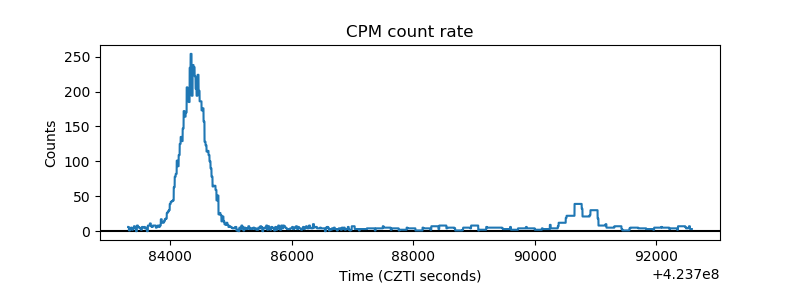 |
| CZT Counter | 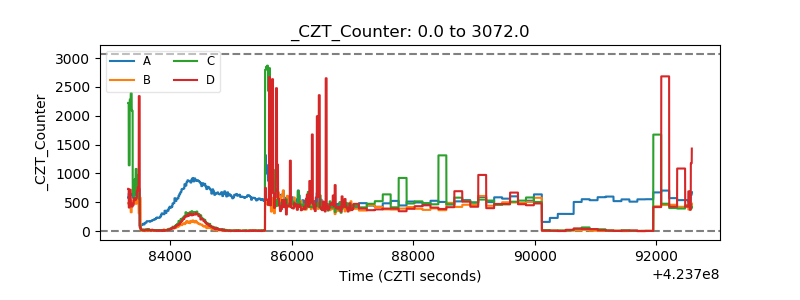 |
| +2.5 Volts monitor | 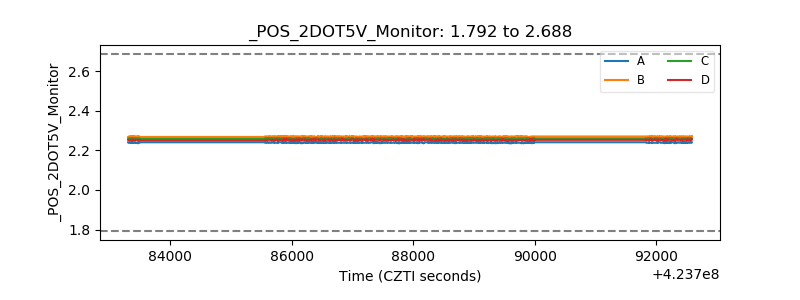 |
| +5 Volts monitor | 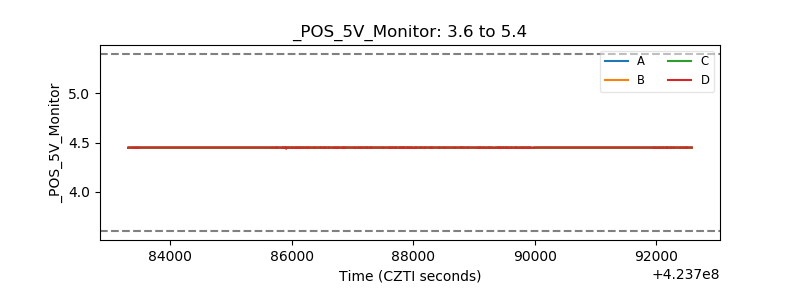 |
| _ROLL_ROT | 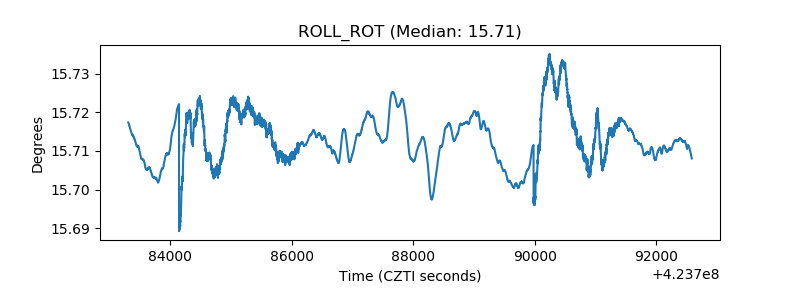 |
| _Roll_DEC | 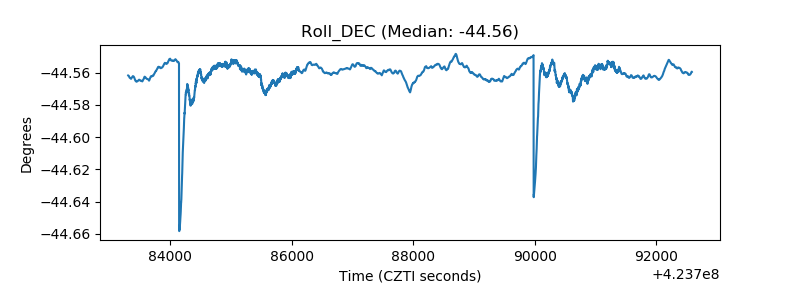 |
| _Roll_RA | 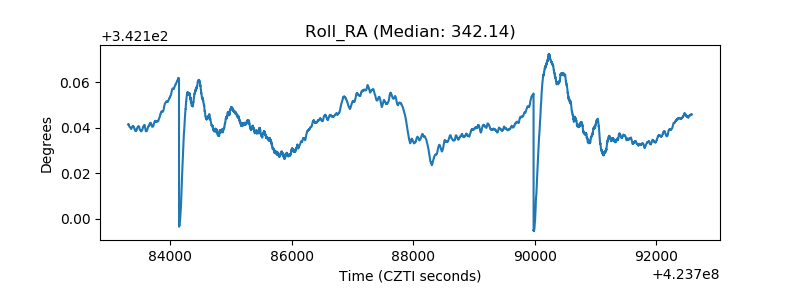 |
| Veto Counter | 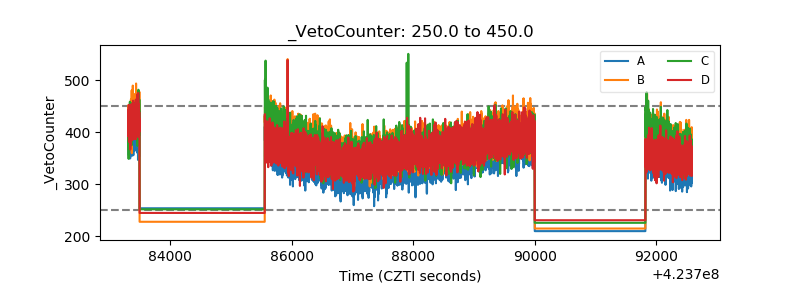 |