| Param | Original file | Final file |
|---|---|---|
| Filename | modeM0/AS1A12_035T02_9000005676_41628cztM0_level2.fits | modeM0/AS1A12_035T02_9000005676_41628cztM0_level2_quad_clean.evt |
| Size (bytes) | 905,785,920 | 160,188,480 |
| Size | 863.8 MB | 152.8 MB |
| Events in quadrant A | 5,593,598 | 1,137,307 |
| Events in quadrant B | 5,188,099 | 1,150,501 |
| Events in quadrant C | 5,593,626 | 1,114,203 |
| Events in quadrant D | 16,339,324 | 719,289 |
| Mode SS | |||
|---|---|---|---|
| Quadrant | BADHDUFLAG | Total packets | Discarded packets |
| A | 0 | 216 | 0 |
| B | 0 | 216 | 0 |
| C | 0 | 216 | 0 |
| D | 0 | 216 | 0 |
| Mode M0 | |||
|---|---|---|---|
| Quadrant | BADHDUFLAG | Total packets | Discarded packets |
| A | 0 | 22695 | 4 |
| B | 0 | 22707 | 3 |
| C | 0 | 23186 | 3 |
| D | 0 | 55721 | 3 |
| Mode M9 | |||
|---|---|---|---|
| Quadrant | BADHDUFLAG | Total packets | Discarded packets |
| A | 0 | 29 | 0 |
| B | 0 | 29 | 0 |
| C | 0 | 29 | 0 |
| D | 0 | 30 | 0 |
| Quadrant | Total seconds | Saturated seconds | Saturation percentage |
|---|---|---|---|
| A | 10516 | 35 | 0.332826% |
| B | 10516 | 139 | 1.321795% |
| C | 10516 | 137 | 1.302777% |
| D | 10516 | 3792 | 36.059338% |
Noise dominated data is calculated using 1-second bins in cleaned event files. If a bin has >2000 counts, and if more than 50% of those come from <1% of pixels, then it is considered to be noise-dominated and hence unusable.
| Quadrant | # 1 sec bins | Bins with >0 counts | Bins with >2000 counts | High rate bins dominated by noise | Noise dominated (total time) | Noise dominated (detector-on time) | Marked lightcurve |
|---|---|---|---|---|---|---|---|
| A | 13232 | 10518 | 18 | 18 | 0.14% | 0.17% | 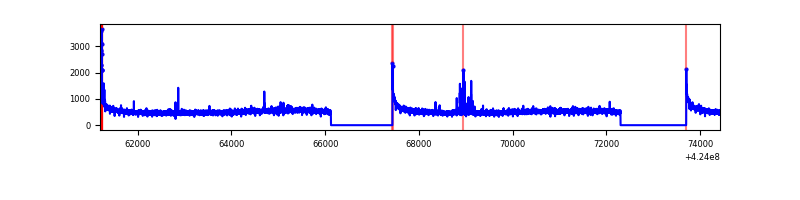 |
| B | 13232 | 10518 | 78 | 78 | 0.59% | 0.74% | 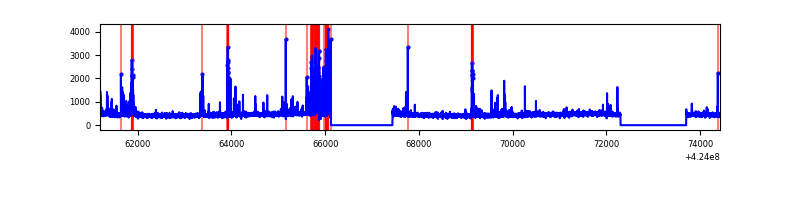 |
| C | 13232 | 10518 | 123 | 123 | 0.93% | 1.17% | 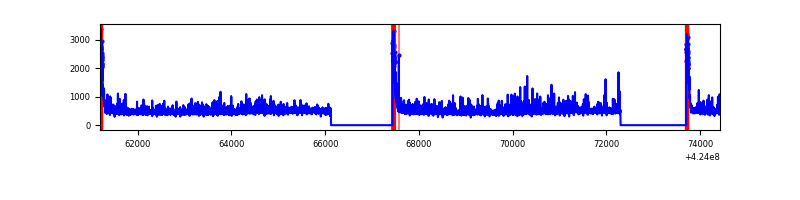 |
| D | 13232 | 10517 | 3492 | 3492 | 26.39% | 33.20% | 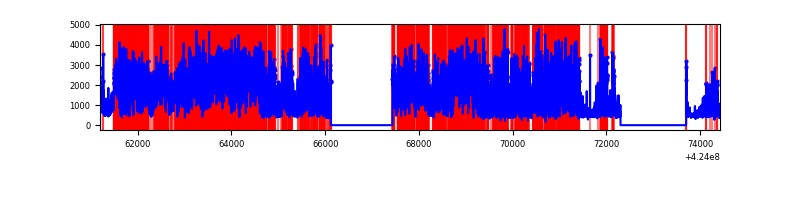 |
Top three noisy pixels from each quadrant. If the there are fewer than three noisy pixels in the level2.evt file, extra rows are filled as -1
| Pixel properties | Quadrant properties | ||||||
|---|---|---|---|---|---|---|---|
| Quadrant | DetID | PixID | Counts | Sigma | Mean | Median | Sigma |
| A | 10 | 83 | 941446 | 3950.58 | 1170 | 1144 | 238.0 |
| A | 13 | 248 | 46946 | 192.43 | 1170 | 1144 | 238.0 |
| A | 7 | 3 | 38248 | 155.89 | 1170 | 1144 | 238.0 |
| B | 5 | 255 | 609421 | 2720.54 | 1154 | 1124 | 223.6 |
| B | 12 | 111 | 29158 | 125.38 | 1154 | 1124 | 223.6 |
| B | 11 | 111 | 27032 | 115.87 | 1154 | 1124 | 223.6 |
| C | 15 | 214 | 458096 | 1729.56 | 1136 | 1143 | 264.2 |
| C | 0 | 10 | 419807 | 1584.63 | 1136 | 1143 | 264.2 |
| C | 0 | 15 | 266215 | 1003.29 | 1136 | 1143 | 264.2 |
| D | 12 | 79 | 10478982 | 42298.89 | 1002 | 970 | 247.7 |
| D | 13 | 249 | 1056452 | 4260.9 | 1002 | 970 | 247.7 |
| D | 1 | 47 | 544183 | 2192.91 | 1002 | 970 | 247.7 |
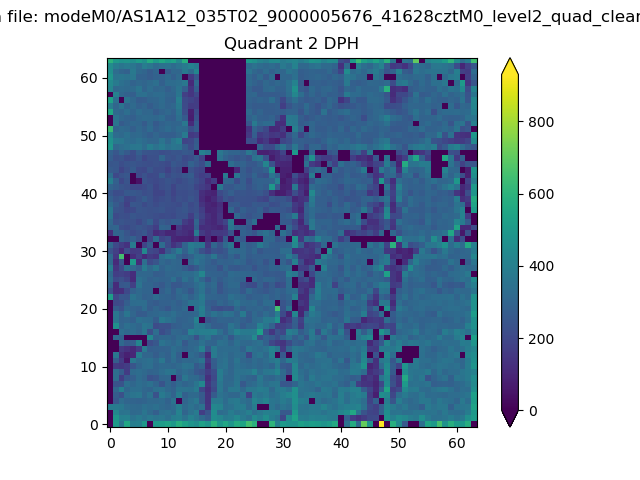
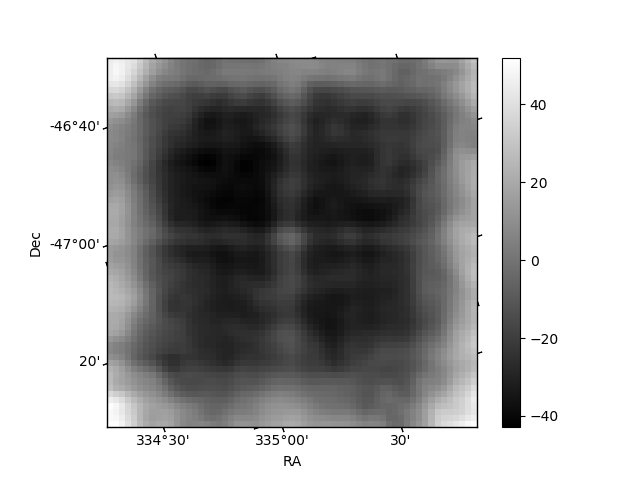
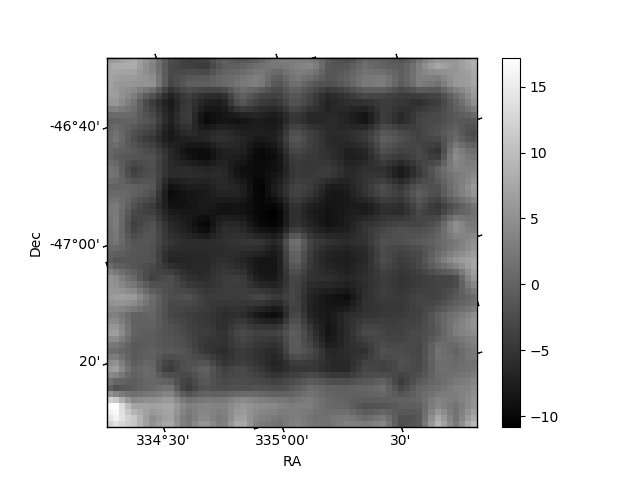
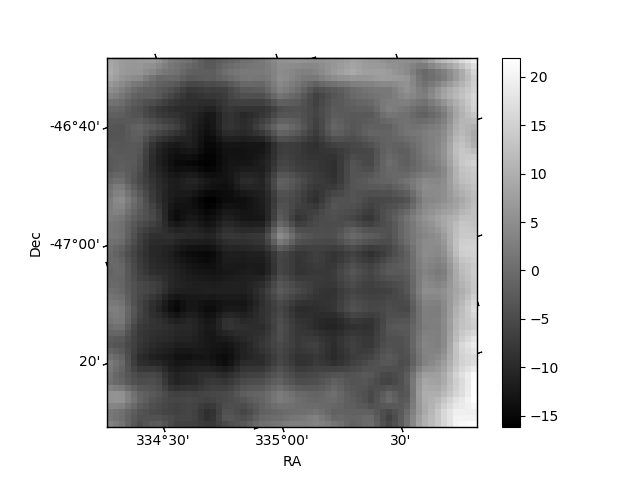
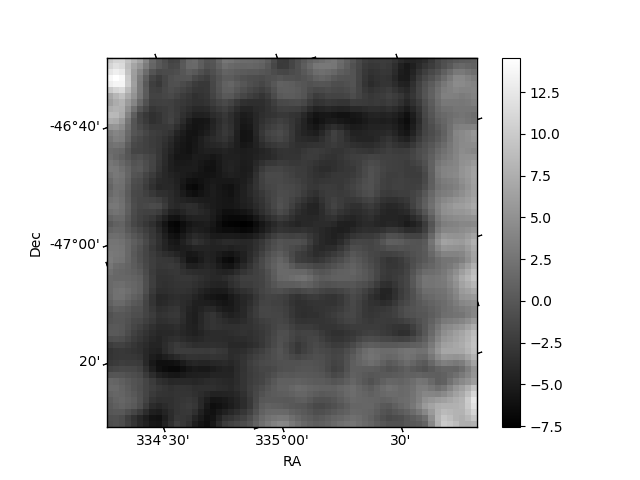
Histogram calculated using DETX and DETY for each event in the final _common_clean file
| Quadrant A | 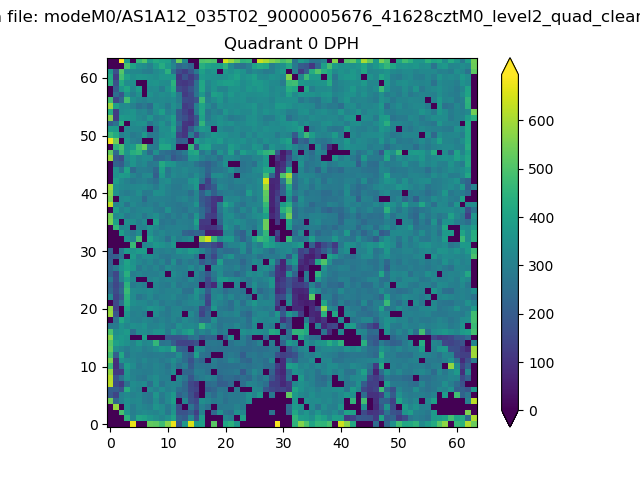 |
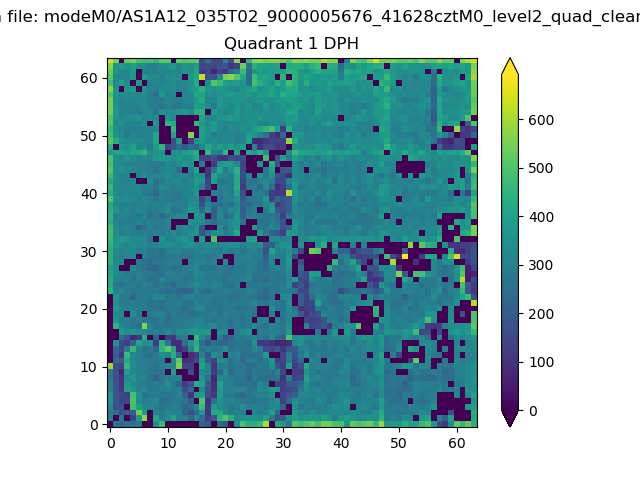 |
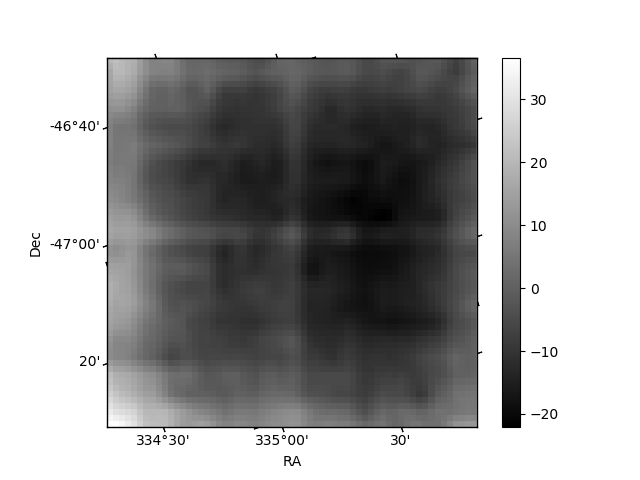
Quadrant B |
|---|---|---|---|
| Quadrant D | 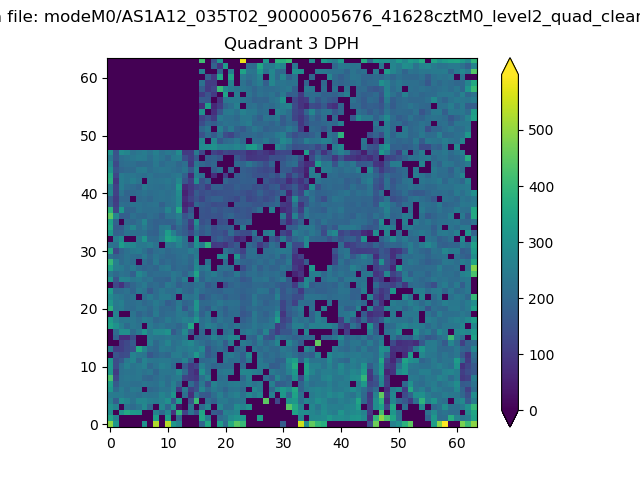 |
 |
Quadrant C |
| Plot type | Count rate plots | Images |
|---|---|---|
| Comparison with Poisson distribution Blue bars denote a histogram of data divided into 1 sec bins. Red curve is a Poisson curve with rate = median count rate of data. |
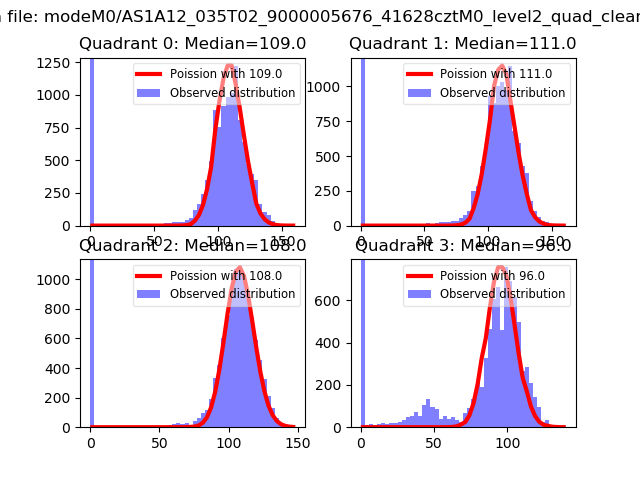 |
 |
| Quadrant-wise count rates Data is divided into 100 sec bins |
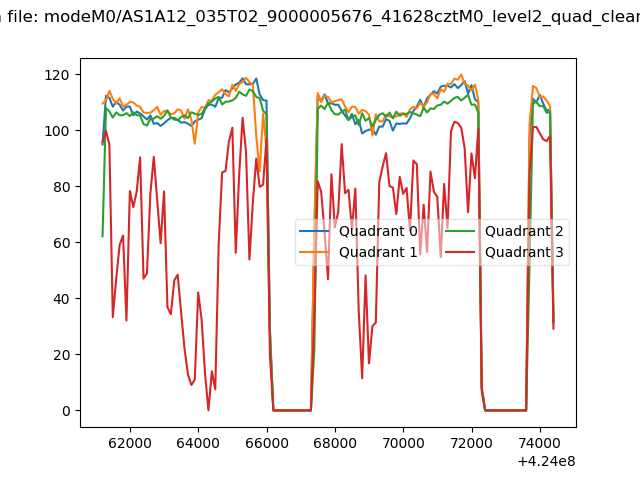 |
|
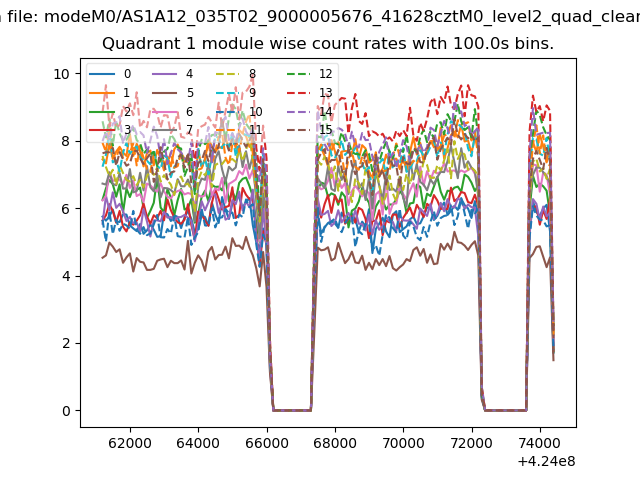
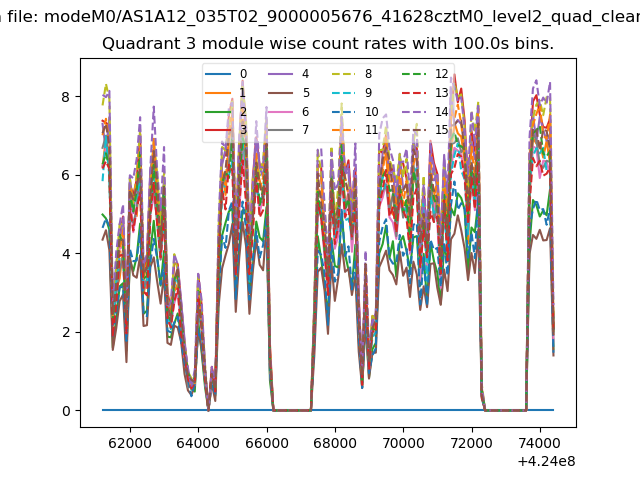
| Module-wise count rates for Quadrant A Data is divided into 100 sec bins |
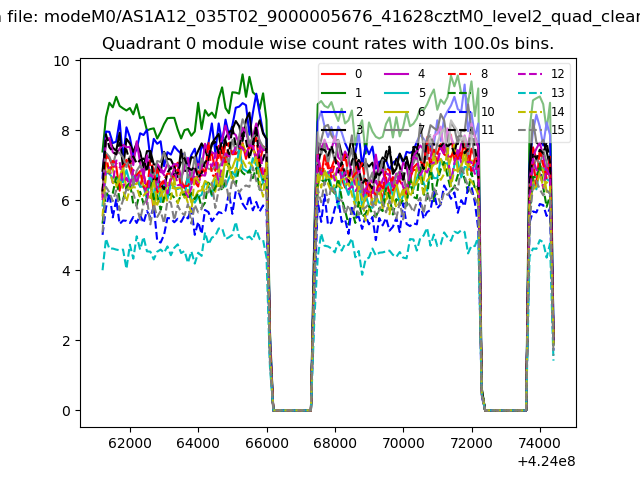 |
 |
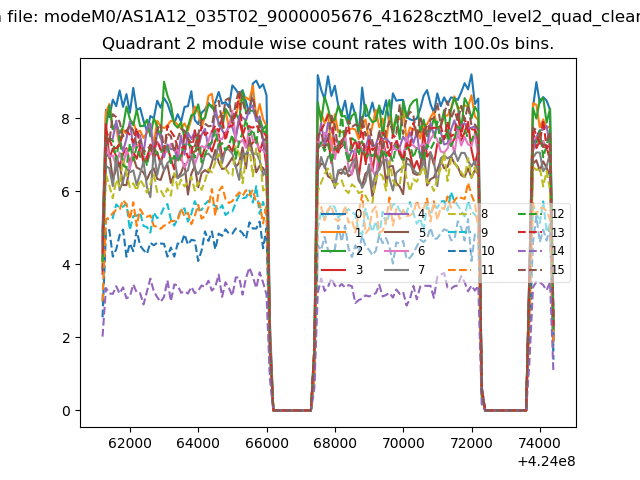
| Module-wise count rates for Quadrant B Data is divided into 100 sec bins |
 |
 |
| Module-wise count rates for Quadrant C Data is divided into 100 sec bins |
 |
 |
| Module-wise count rates for Quadrant D Data is divided into 100 sec bins |
 |
 |
| Parameter | Plot |
|---|---|
| CZT HV Monitor | 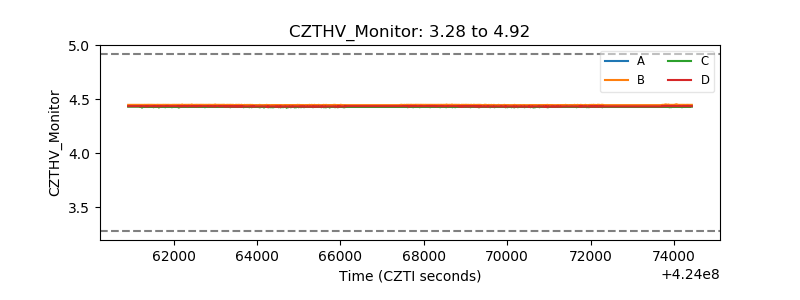 |
| D_VDD | 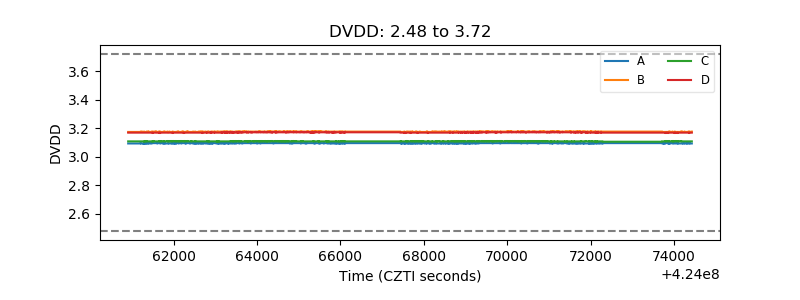 |
| Temperature 1 | 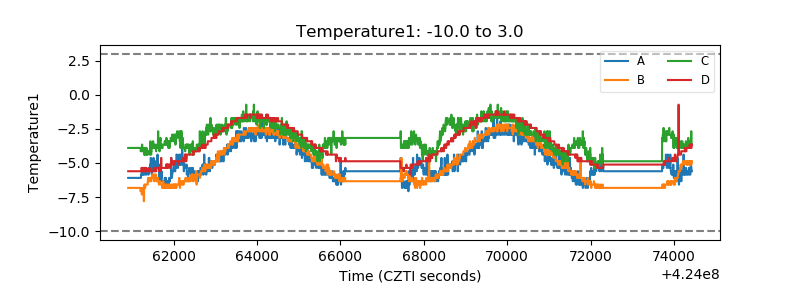 |
| Veto HV Monitor | 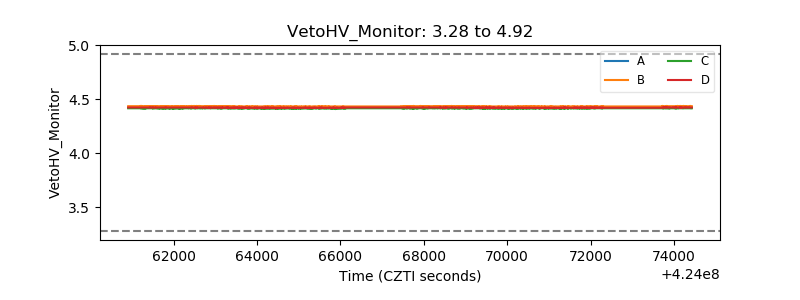 |
| Veto LLD | 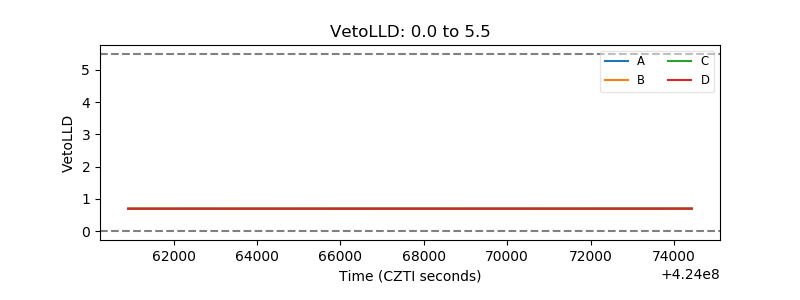 |
| Alpha Counter | 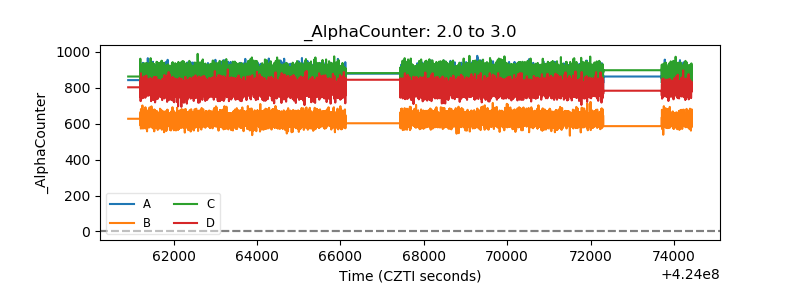 |
| _CPM_Rate | 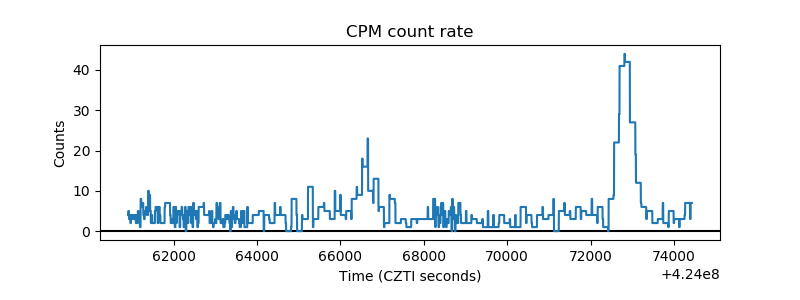 |
| CZT Counter | 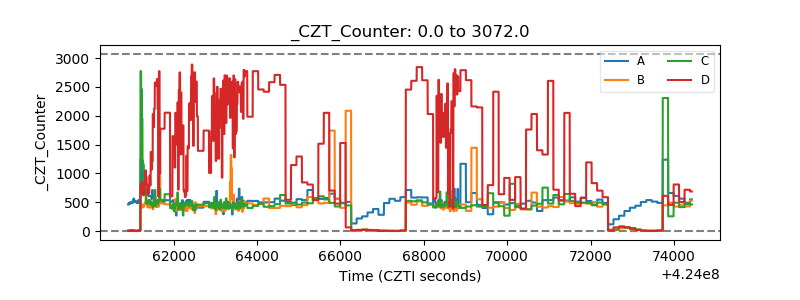 |
| +2.5 Volts monitor | 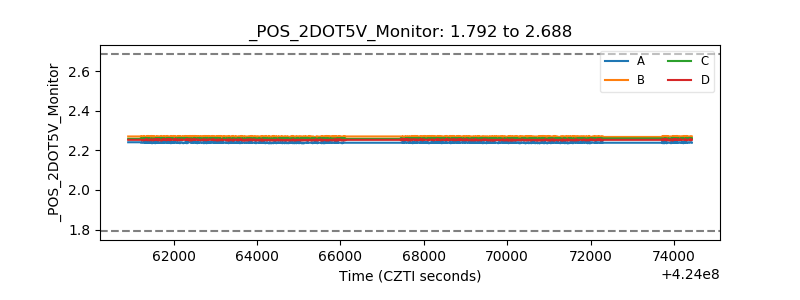 |
| +5 Volts monitor | 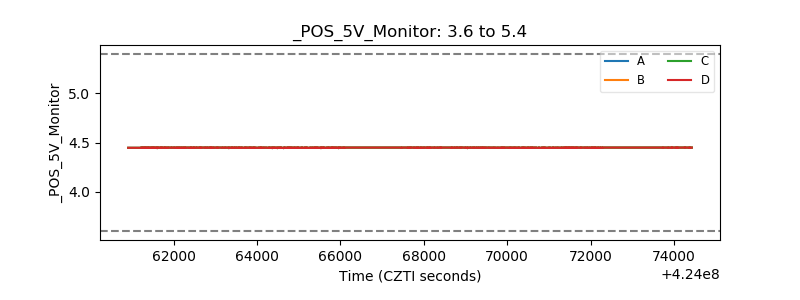 |
| _ROLL_ROT | 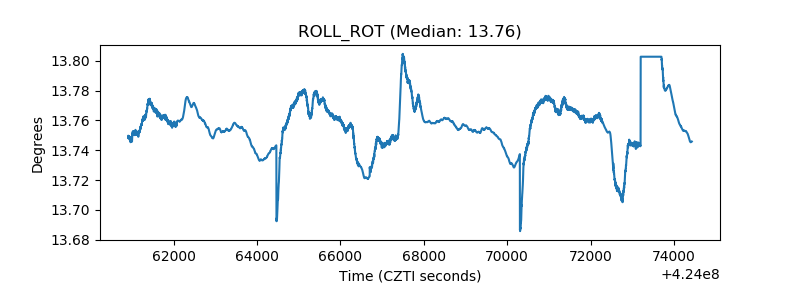 |
| _Roll_DEC | 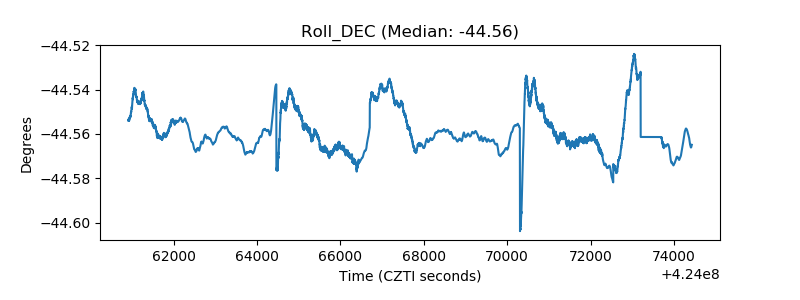 |
| _Roll_RA | 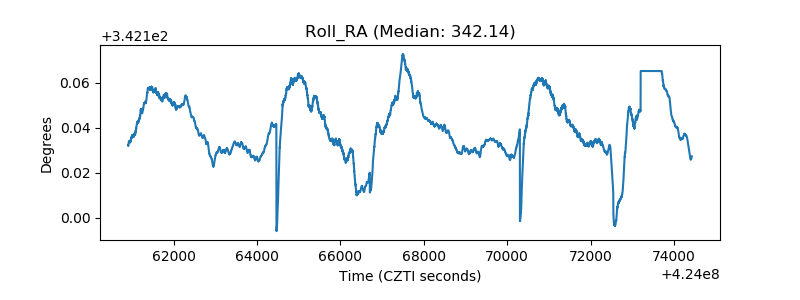 |
| Veto Counter | 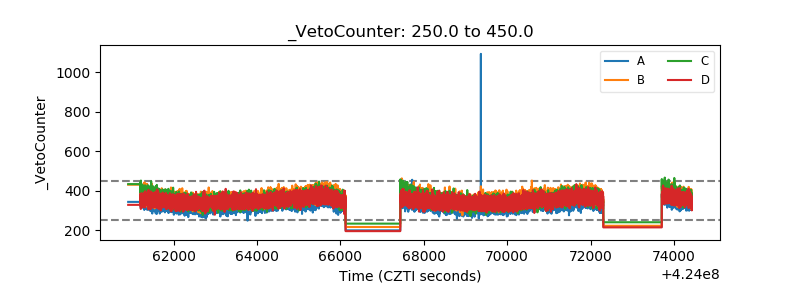 |