| Param | Original file | Final file |
|---|---|---|
| Filename | modeM0/AS1C07_001T10_9000005678_41581cztM0_level2.fits | modeM0/AS1C07_001T10_9000005678_41581cztM0_level2_quad_clean.evt |
| Size (bytes) | 407,257,920 | 92,073,600 |
| Size | 388.4 MB | 87.8 MB |
| Events in quadrant A | 3,057,680 | 623,313 |
| Events in quadrant B | 2,774,317 | 641,094 |
| Events in quadrant C | 4,136,878 | 586,063 |
| Events in quadrant D | 4,652,941 | 529,594 |
| Mode SS | |||
|---|---|---|---|
| Quadrant | BADHDUFLAG | Total packets | Discarded packets |
| A | 0 | 120 | 0 |
| B | 0 | 120 | 0 |
| C | 0 | 120 | 0 |
| D | 0 | 120 | 0 |
| Mode M0 | |||
|---|---|---|---|
| Quadrant | BADHDUFLAG | Total packets | Discarded packets |
| A | 0 | 12546 | 2 |
| B | 0 | 12467 | 2 |
| C | 0 | 16203 | 2 |
| D | 0 | 18128 | 2 |
| Mode M9 | |||
|---|---|---|---|
| Quadrant | BADHDUFLAG | Total packets | Discarded packets |
| A | 0 | 27 | 0 |
| B | 0 | 27 | 0 |
| C | 0 | 27 | 0 |
| D | 0 | 27 | 0 |
| Quadrant | Total seconds | Saturated seconds | Saturation percentage |
|---|---|---|---|
| A | 5828 | 12 | 0.205903% |
| B | 5828 | 17 | 0.291695% |
| C | 5828 | 437 | 7.498284% |
| D | 5828 | 547 | 9.385724% |
Noise dominated data is calculated using 1-second bins in cleaned event files. If a bin has >2000 counts, and if more than 50% of those come from <1% of pixels, then it is considered to be noise-dominated and hence unusable.
| Quadrant | # 1 sec bins | Bins with >0 counts | Bins with >2000 counts | High rate bins dominated by noise | Noise dominated (total time) | Noise dominated (detector-on time) | Marked lightcurve |
|---|---|---|---|---|---|---|---|
| A | 7139 | 5829 | 4 | 4 | 0.06% | 0.07% | 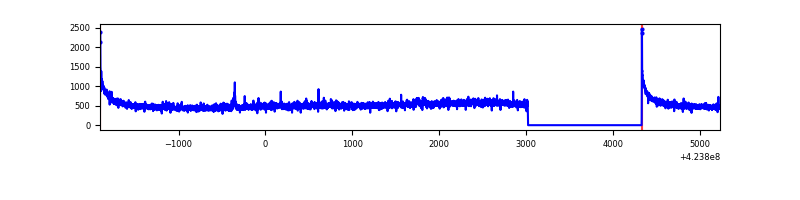 |
| B | 7139 | 5829 | 3 | 3 | 0.04% | 0.05% | 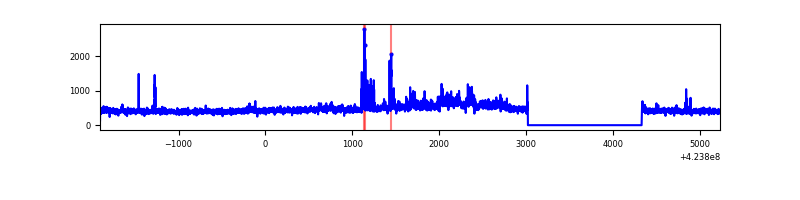 |
| C | 7139 | 5829 | 298 | 298 | 4.17% | 5.11% | 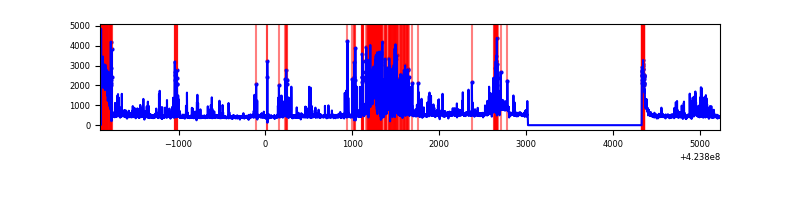 |
| D | 7139 | 5829 | 417 | 417 | 5.84% | 7.15% | 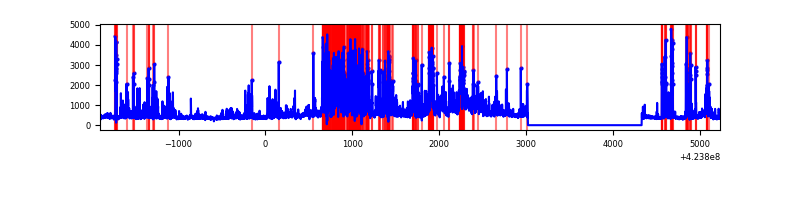 |
Top three noisy pixels from each quadrant. If the there are fewer than three noisy pixels in the level2.evt file, extra rows are filled as -1
| Pixel properties | Quadrant properties | ||||||
|---|---|---|---|---|---|---|---|
| Quadrant | DetID | PixID | Counts | Sigma | Mean | Median | Sigma |
| A | 10 | 83 | 564459 | 4382.82 | 624 | 611 | 128.6 |
| A | 15 | 223 | 53641 | 412.2 | 624 | 611 | 128.6 |
| A | 14 | 235 | 18594 | 139.78 | 624 | 611 | 128.6 |
| B | 0 | 245 | 94481 | 776.59 | 621 | 602 | 120.9 |
| B | 7 | 202 | 73982 | 607.01 | 621 | 602 | 120.9 |
| B | 0 | 186 | 69000 | 565.8 | 621 | 602 | 120.9 |
| C | 4 | 254 | 641588 | 4657.17 | 590 | 594 | 137.6 |
| C | 14 | 254 | 557410 | 4045.58 | 590 | 594 | 137.6 |
| C | 0 | 10 | 305882 | 2218.09 | 590 | 594 | 137.6 |
| D | 13 | 249 | 1559614 | 10901.45 | 583 | 567 | 143.0 |
| D | 2 | 120 | 522623 | 3650.41 | 583 | 567 | 143.0 |
| D | 12 | 0 | 112563 | 783.12 | 583 | 567 | 143.0 |
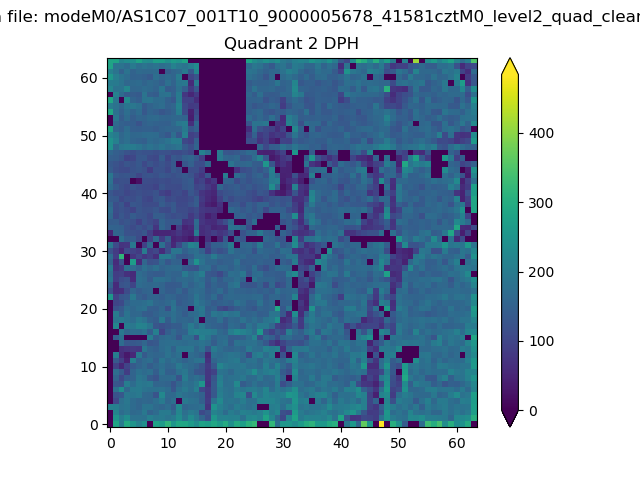
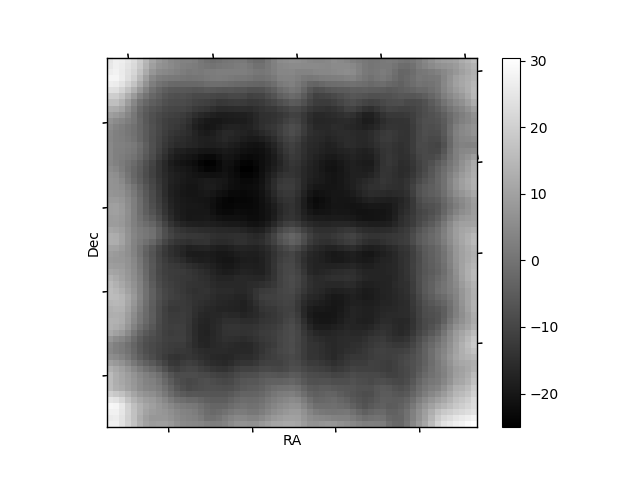
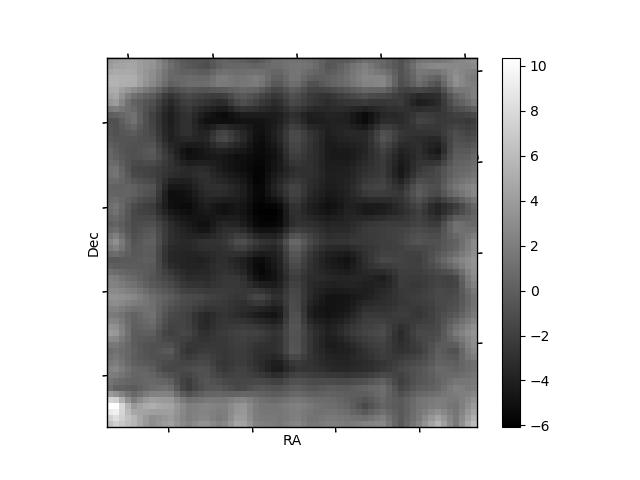
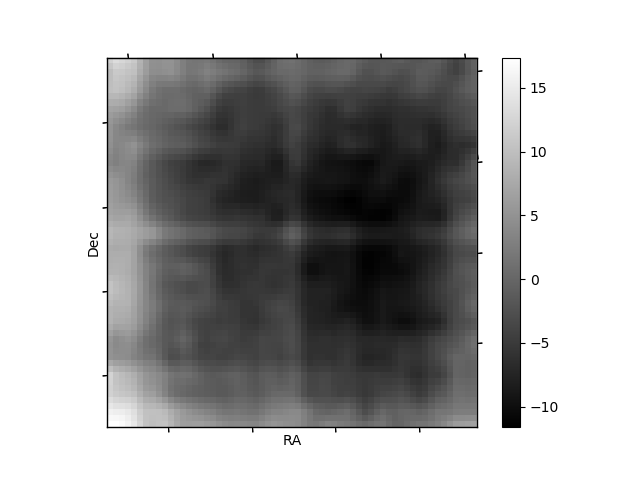
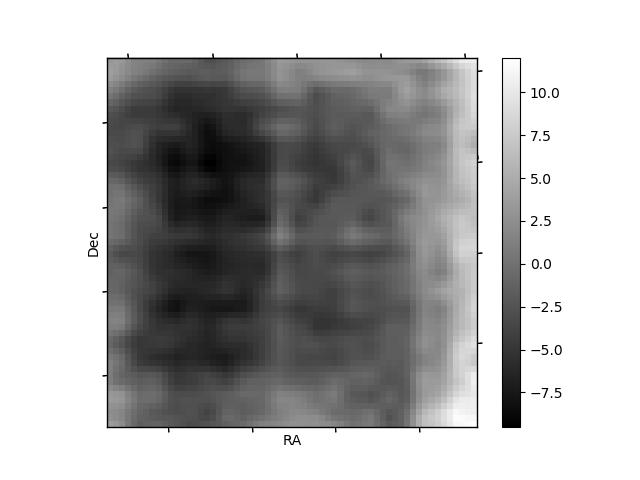
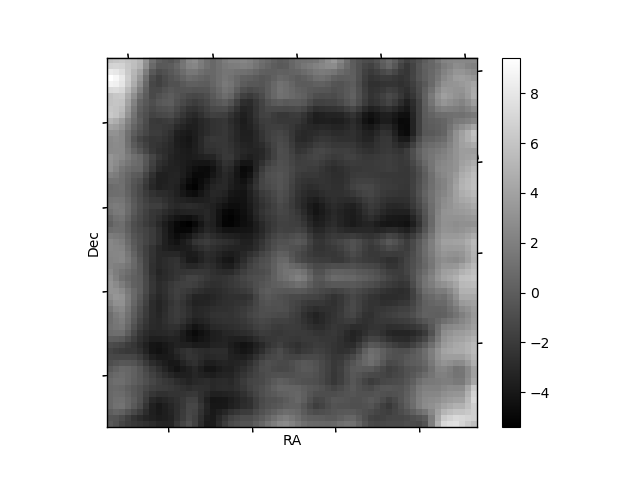
Histogram calculated using DETX and DETY for each event in the final _common_clean file
| Quadrant A | 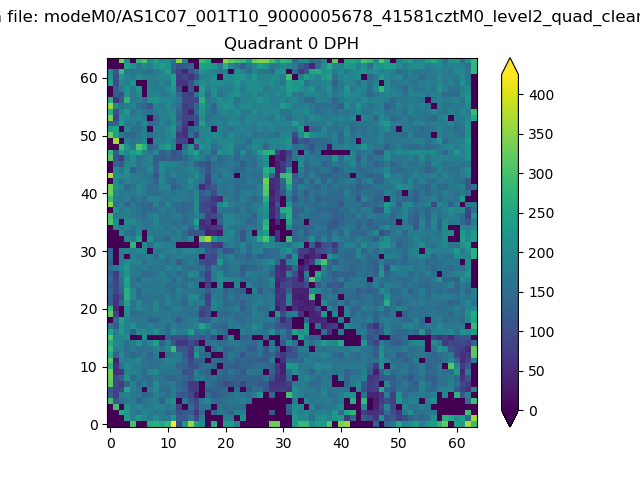 |
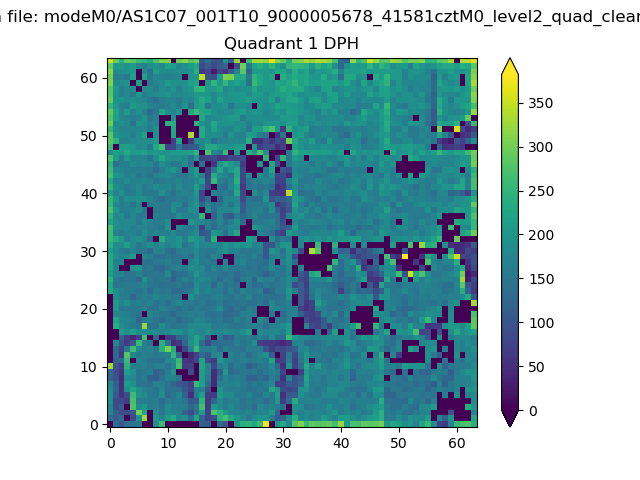 |
Quadrant B |
|---|---|---|---|
| Quadrant D | 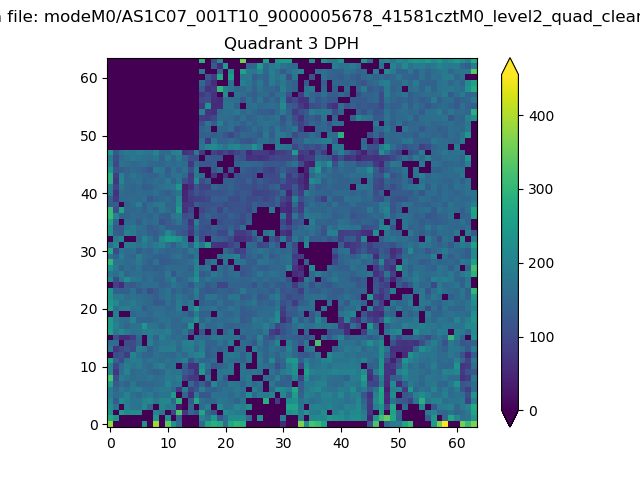 |
 |
Quadrant C |
| Plot type | Count rate plots | Images |
|---|---|---|
| Comparison with Poisson distribution Blue bars denote a histogram of data divided into 1 sec bins. Red curve is a Poisson curve with rate = median count rate of data. |
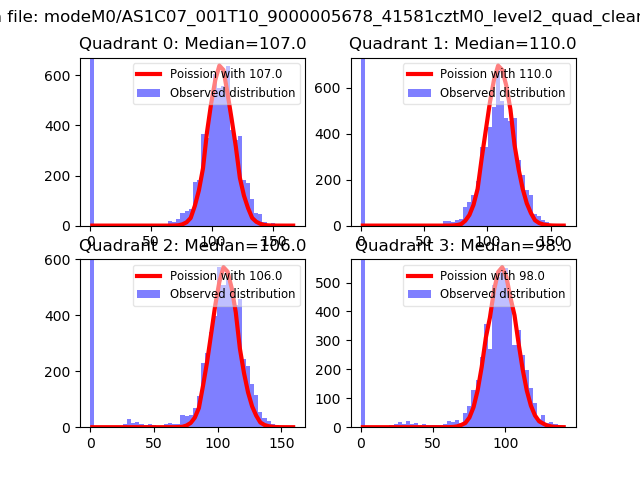 |
 |
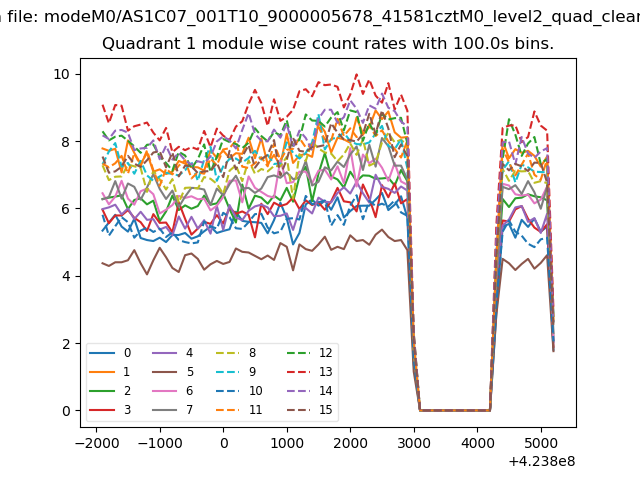
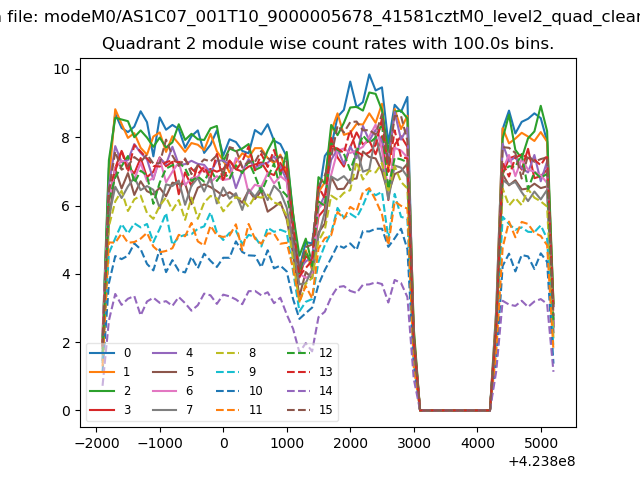
| Quadrant-wise count rates Data is divided into 100 sec bins |
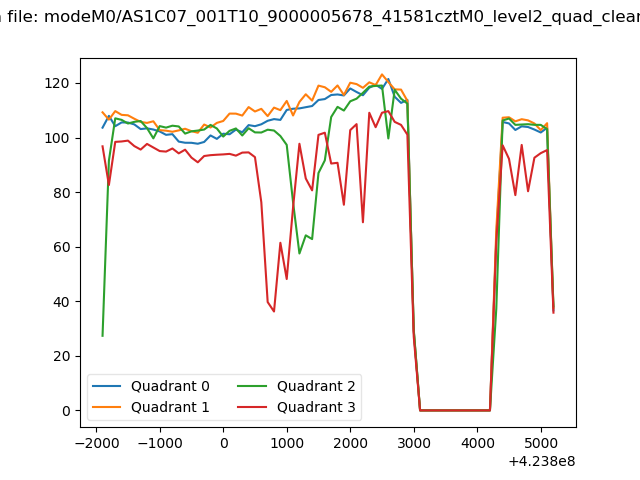 |
|
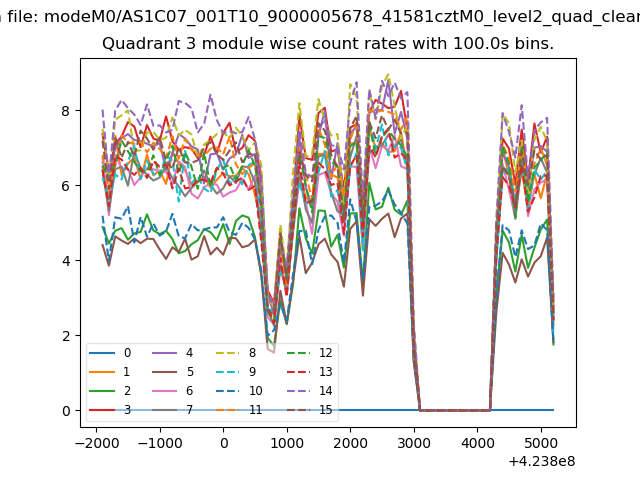
| Module-wise count rates for Quadrant A Data is divided into 100 sec bins |
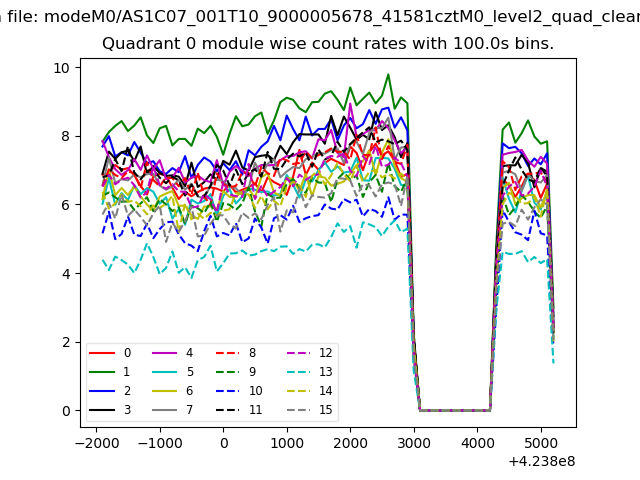 |
 |
| Module-wise count rates for Quadrant B Data is divided into 100 sec bins |
 |
 |
| Module-wise count rates for Quadrant C Data is divided into 100 sec bins |
 |
 |
| Module-wise count rates for Quadrant D Data is divided into 100 sec bins |
 |
 |
| Parameter | Plot |
|---|---|
| CZT HV Monitor | 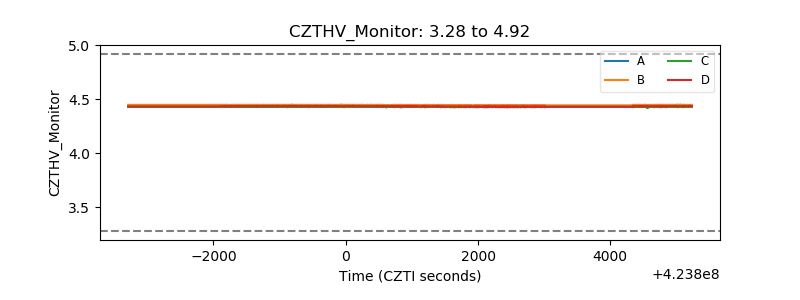 |
| D_VDD | 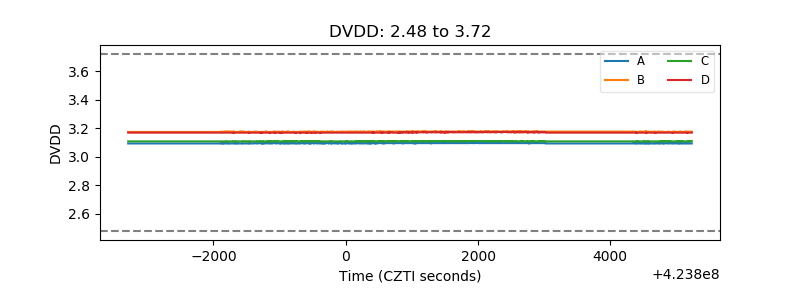 |
| Temperature 1 | 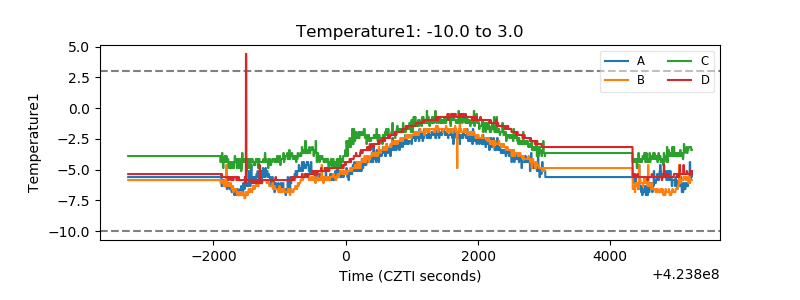 |
| Veto HV Monitor | 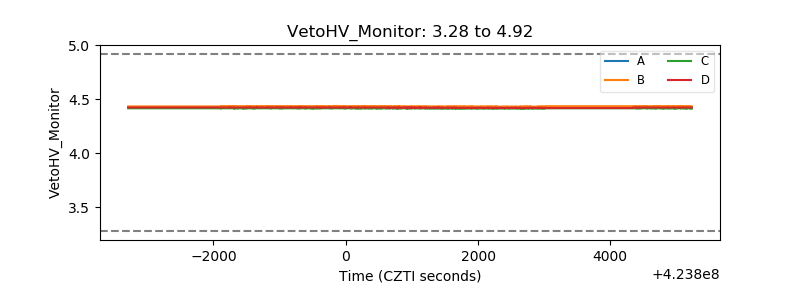 |
| Veto LLD | 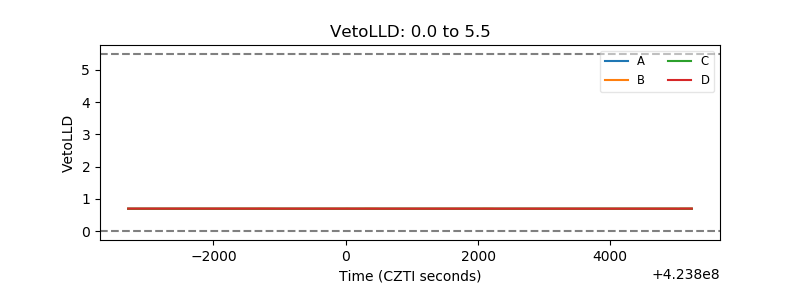 |
| Alpha Counter | 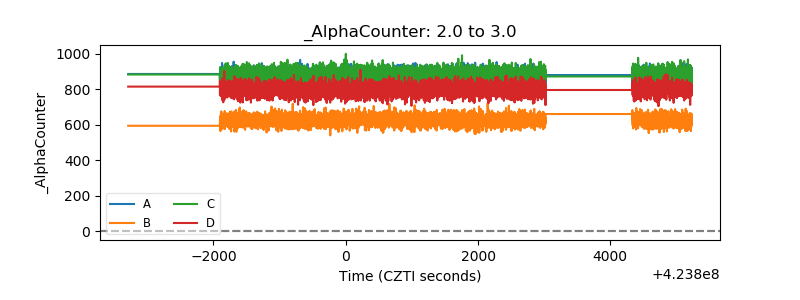 |
| _CPM_Rate | 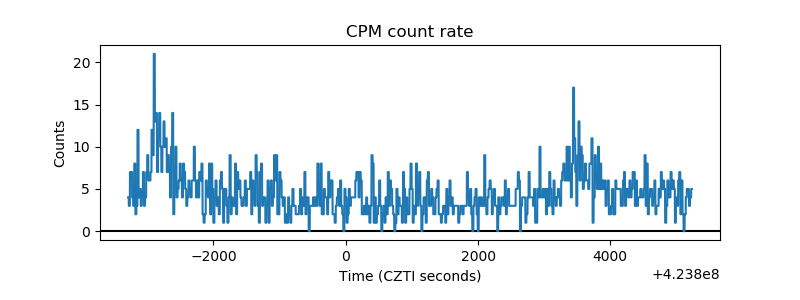 |
| CZT Counter | 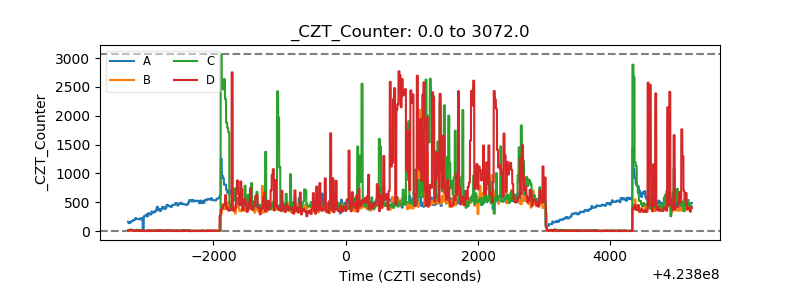 |
| +2.5 Volts monitor | 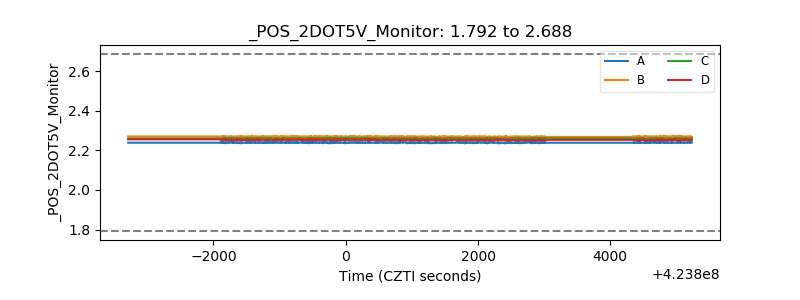 |
| +5 Volts monitor | 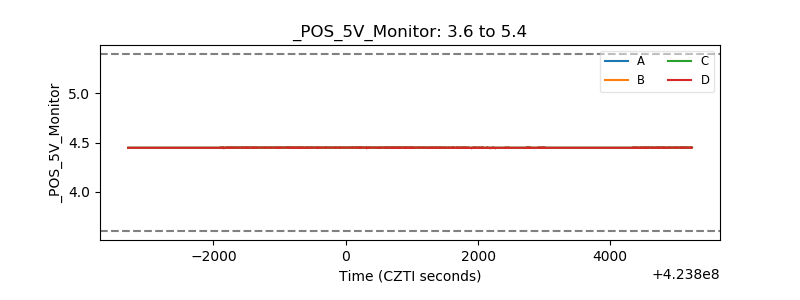 |
| _ROLL_ROT | 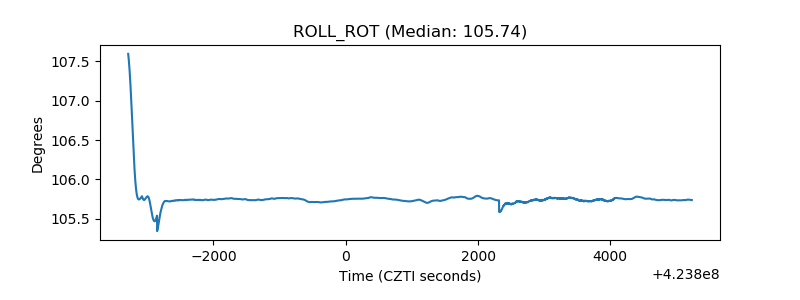 |
| _Roll_DEC | 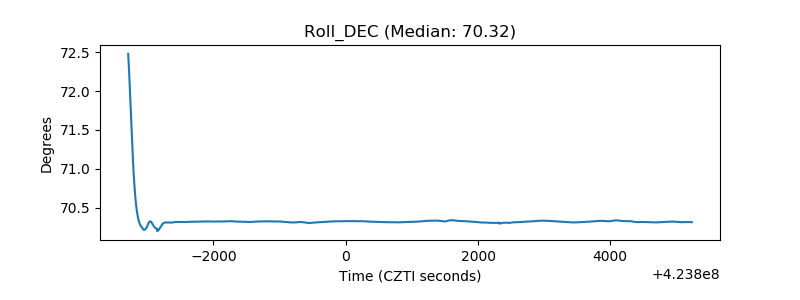 |
| _Roll_RA | 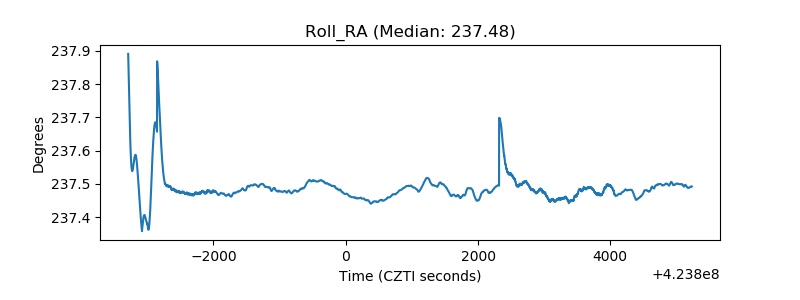 |
| Veto Counter | 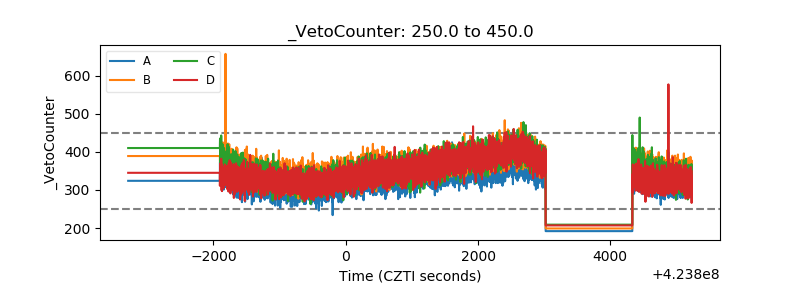 |