| Param | Original file | Final file |
|---|---|---|
| Filename | modeM0/AS1C07_001T10_9000005678_41584cztM0_level2.fits | modeM0/AS1C07_001T10_9000005678_41584cztM0_level2_quad_clean.evt |
| Size (bytes) | 1,079,294,400 | 244,180,800 |
| Size | 1.0 GB | 232.9 MB |
| Events in quadrant A | 8,472,848 | 1,672,210 |
| Events in quadrant B | 7,467,051 | 1,725,035 |
| Events in quadrant C | 11,179,468 | 1,494,584 |
| Events in quadrant D | 11,605,887 | 1,407,329 |
| Mode SS | |||
|---|---|---|---|
| Quadrant | BADHDUFLAG | Total packets | Discarded packets |
| A | 0 | 328 | 0 |
| B | 0 | 328 | 0 |
| C | 0 | 328 | 0 |
| D | 0 | 328 | 0 |
| Mode M0 | |||
|---|---|---|---|
| Quadrant | BADHDUFLAG | Total packets | Discarded packets |
| A | 0 | 34418 | 4 |
| B | 0 | 32991 | 4 |
| C | 0 | 43268 | 4 |
| D | 0 | 45559 | 4 |
| Mode M9 | |||
|---|---|---|---|
| Quadrant | BADHDUFLAG | Total packets | Discarded packets |
| A | 0 | 53 | 0 |
| B | 0 | 53 | 0 |
| C | 0 | 53 | 0 |
| D | 0 | 53 | 0 |
| Quadrant | Total seconds | Saturated seconds | Saturation percentage |
|---|---|---|---|
| A | 15840 | 35 | 0.220960% |
| B | 15841 | 32 | 0.202007% |
| C | 15841 | 1340 | 8.459062% |
| D | 15841 | 1051 | 6.634682% |
Noise dominated data is calculated using 1-second bins in cleaned event files. If a bin has >2000 counts, and if more than 50% of those come from <1% of pixels, then it is considered to be noise-dominated and hence unusable.
| Quadrant | # 1 sec bins | Bins with >0 counts | Bins with >2000 counts | High rate bins dominated by noise | Noise dominated (total time) | Noise dominated (detector-on time) | Marked lightcurve |
|---|---|---|---|---|---|---|---|
| A | 21239 | 15844 | 9 | 9 | 0.04% | 0.06% | 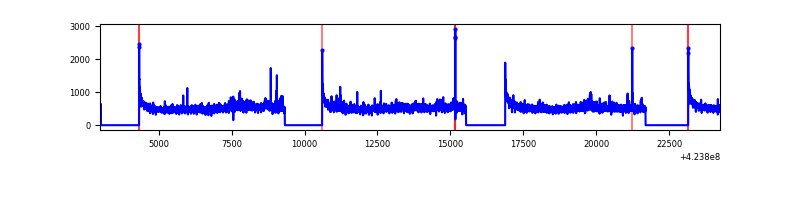 |
| B | 21240 | 15845 | 8 | 8 | 0.04% | 0.05% | 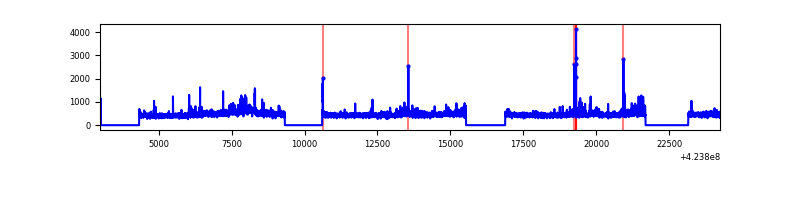 |
| C | 21240 | 15845 | 1142 | 1142 | 5.38% | 7.21% | 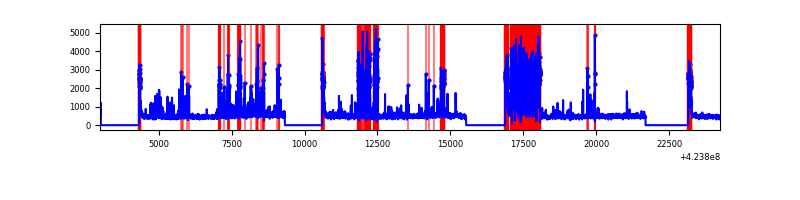 |
| D | 21240 | 15845 | 834 | 834 | 3.93% | 5.26% | 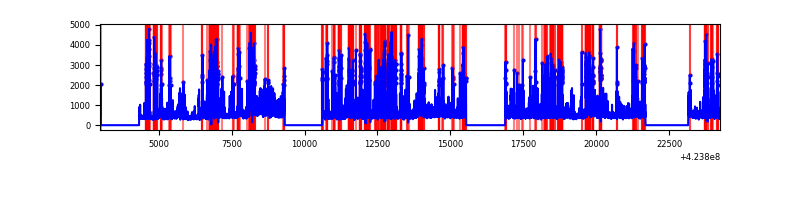 |
Top three noisy pixels from each quadrant. If the there are fewer than three noisy pixels in the level2.evt file, extra rows are filled as -1
| Pixel properties | Quadrant properties | ||||||
|---|---|---|---|---|---|---|---|
| Quadrant | DetID | PixID | Counts | Sigma | Mean | Median | Sigma |
| A | 10 | 83 | 1449656 | 4122.98 | 1732 | 1697 | 351.2 |
| A | 15 | 223 | 201982 | 570.3 | 1732 | 1697 | 351.2 |
| A | 14 | 235 | 59582 | 164.82 | 1732 | 1697 | 351.2 |
| B | 0 | 245 | 288277 | 871.16 | 1723 | 1674 | 329.0 |
| B | 7 | 202 | 156500 | 470.61 | 1723 | 1674 | 329.0 |
| B | 0 | 190 | 67829 | 201.09 | 1723 | 1674 | 329.0 |
| C | 4 | 254 | 2442487 | 6647.82 | 1598 | 1605 | 367.2 |
| C | 0 | 15 | 691933 | 1880.13 | 1598 | 1605 | 367.2 |
| C | 15 | 214 | 660251 | 1793.84 | 1598 | 1605 | 367.2 |
| D | 13 | 249 | 3425072 | 8559.8 | 1646 | 1601 | 399.9 |
| D | 2 | 120 | 542127 | 1351.49 | 1646 | 1601 | 399.9 |
| D | 12 | 218 | 410224 | 1021.69 | 1646 | 1601 | 399.9 |
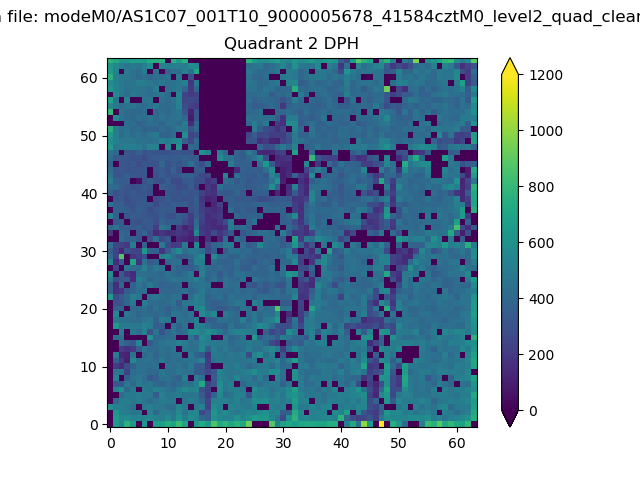
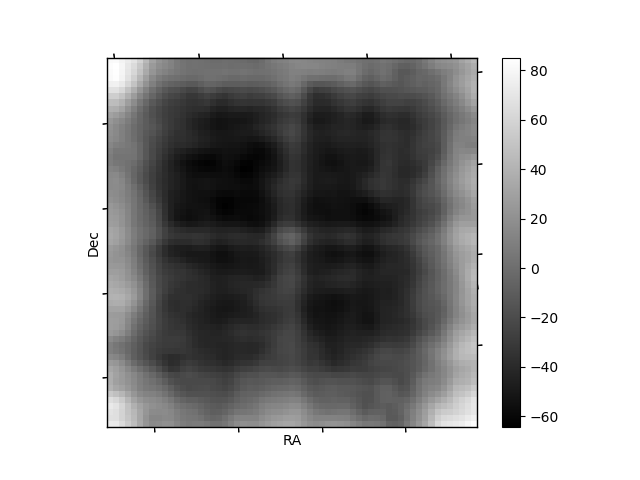
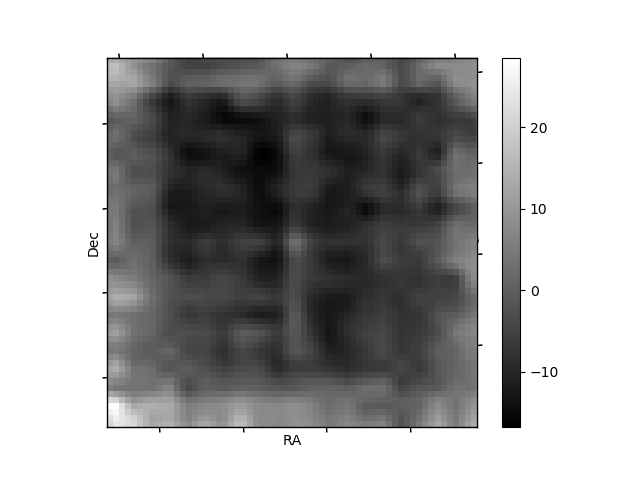
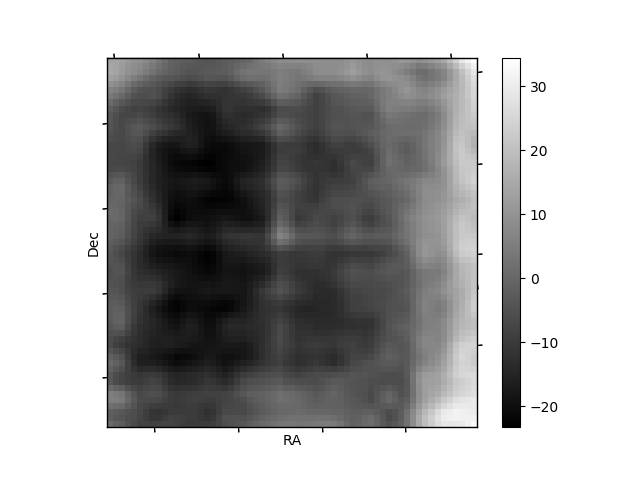
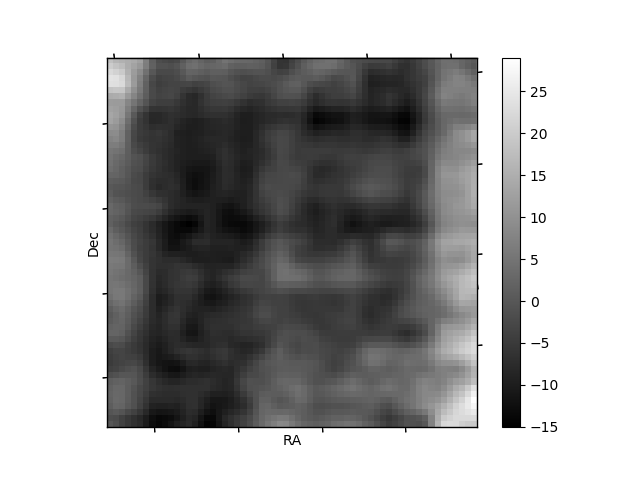
Histogram calculated using DETX and DETY for each event in the final _common_clean file
| Quadrant A | 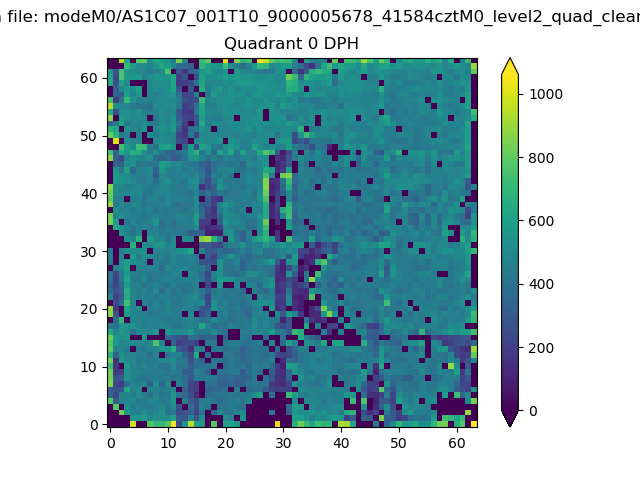 |
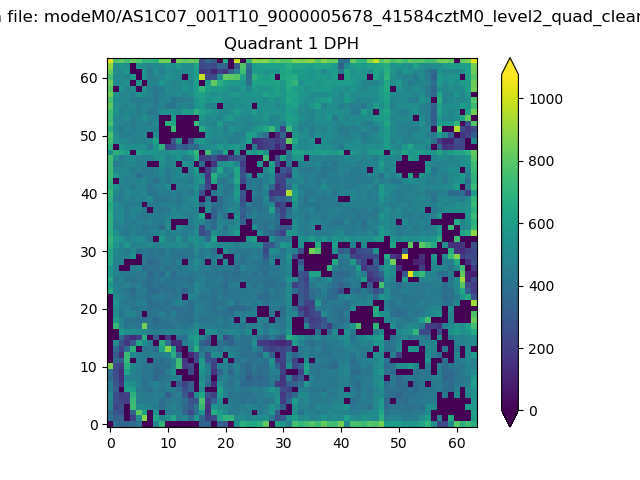 |
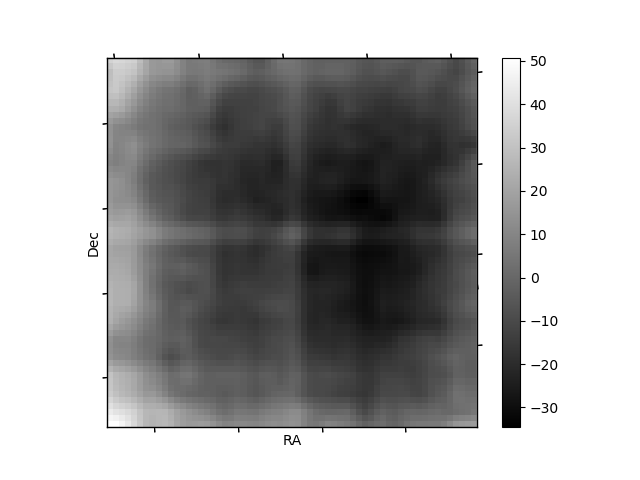
Quadrant B |
|---|---|---|---|
| Quadrant D | 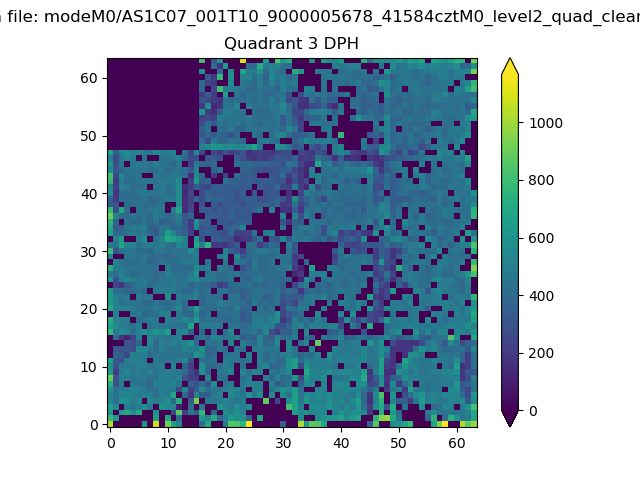 |
 |
Quadrant C |
| Plot type | Count rate plots | Images |
|---|---|---|
| Comparison with Poisson distribution Blue bars denote a histogram of data divided into 1 sec bins. Red curve is a Poisson curve with rate = median count rate of data. |
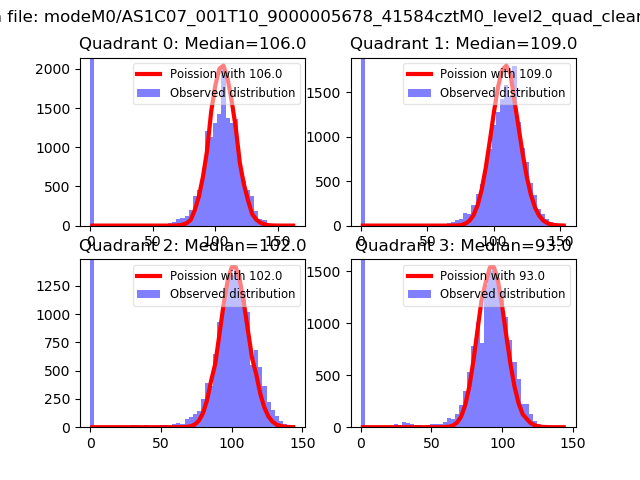 |
 |
| Quadrant-wise count rates Data is divided into 100 sec bins |
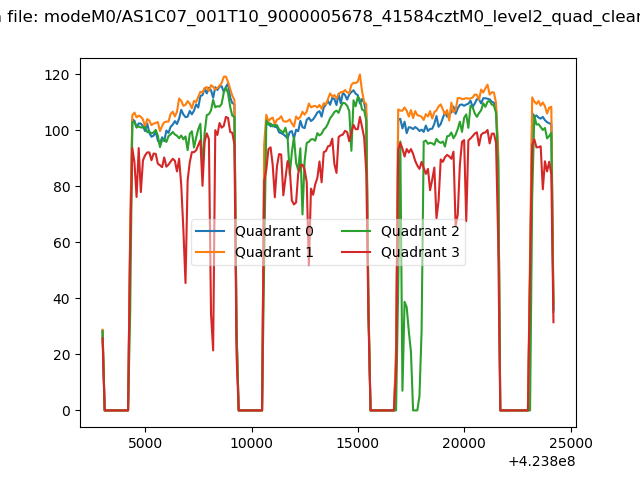 |
|
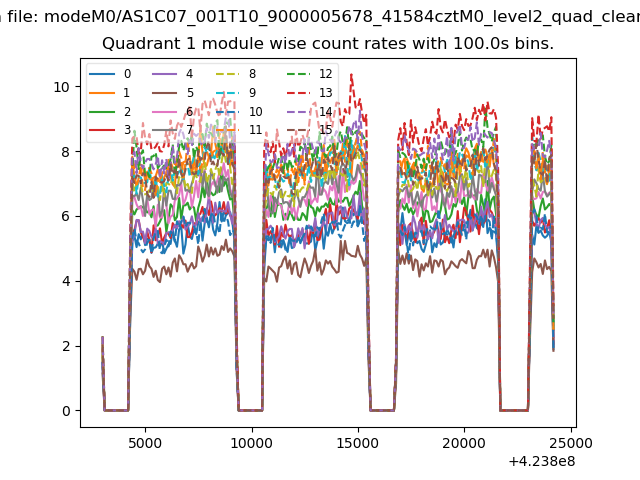
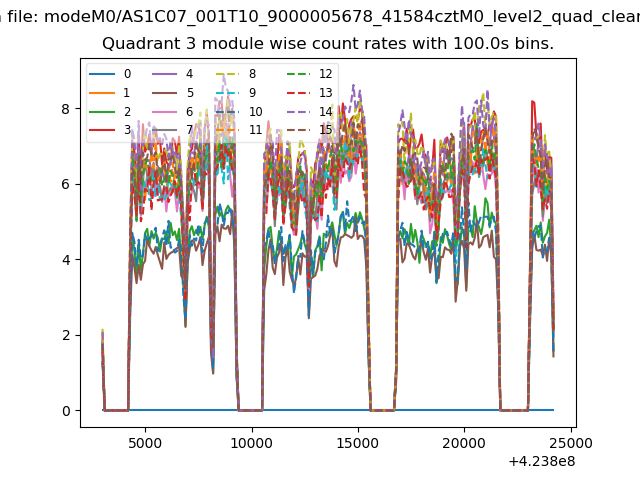
| Module-wise count rates for Quadrant A Data is divided into 100 sec bins |
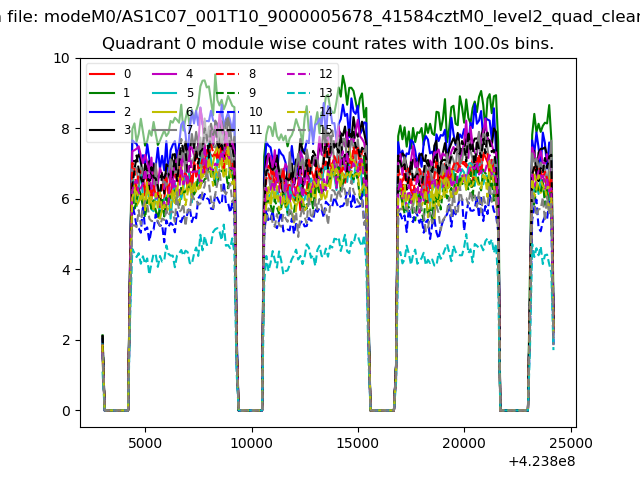 |
 |
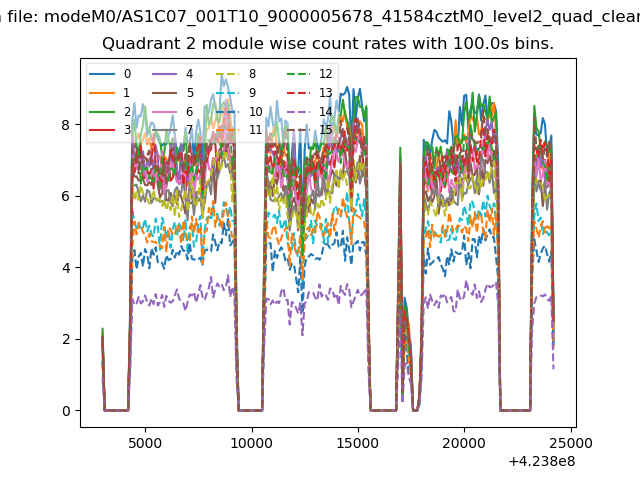
| Module-wise count rates for Quadrant B Data is divided into 100 sec bins |
 |
 |
| Module-wise count rates for Quadrant C Data is divided into 100 sec bins |
 |
 |
| Module-wise count rates for Quadrant D Data is divided into 100 sec bins |
 |
 |
| Parameter | Plot |
|---|---|
| CZT HV Monitor | 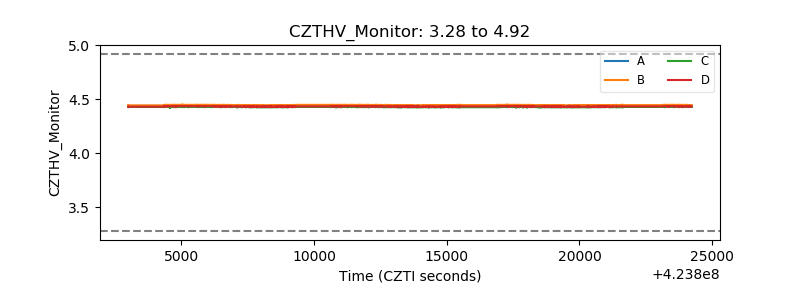 |
| D_VDD | 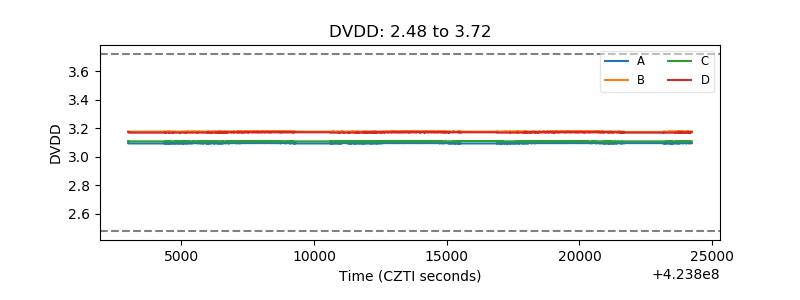 |
| Temperature 1 | 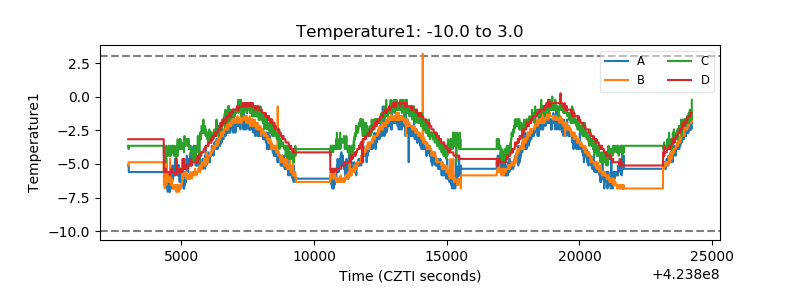 |
| Veto HV Monitor | 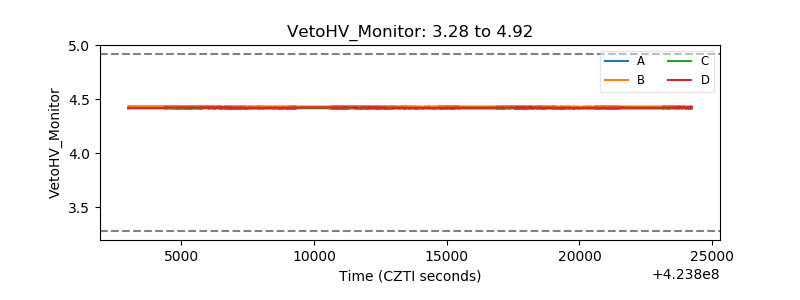 |
| Veto LLD | 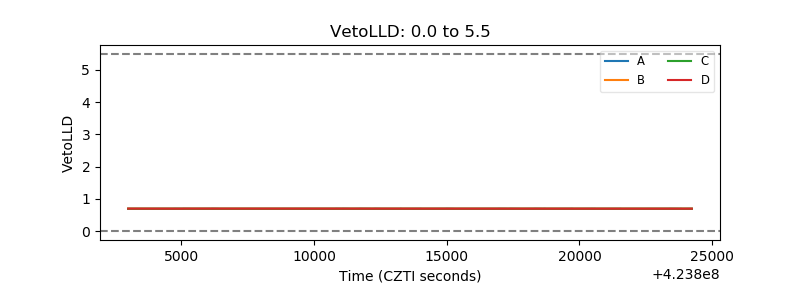 |
| Alpha Counter | 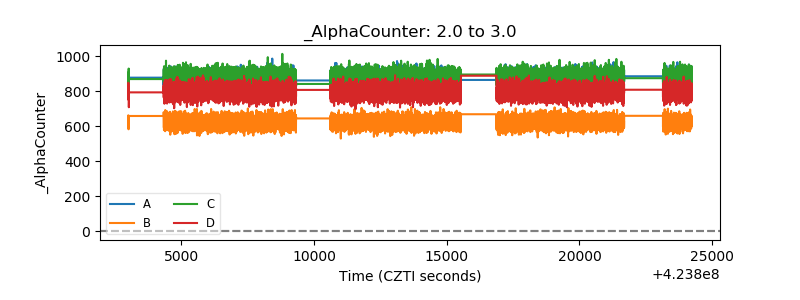 |
| _CPM_Rate | 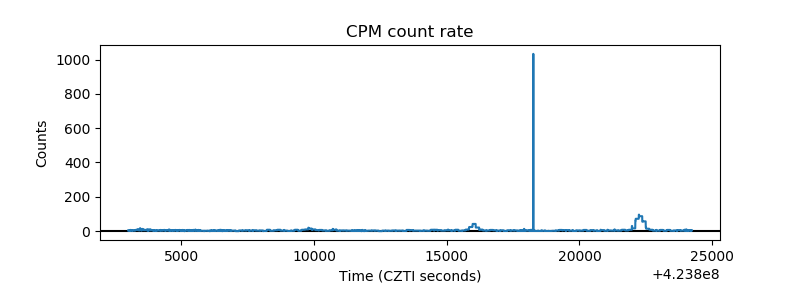 |
| CZT Counter | 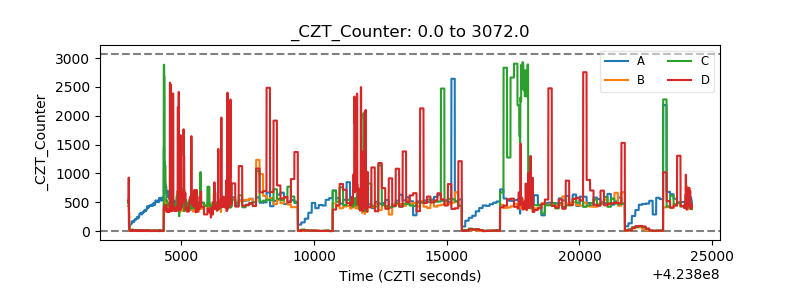 |
| +2.5 Volts monitor | 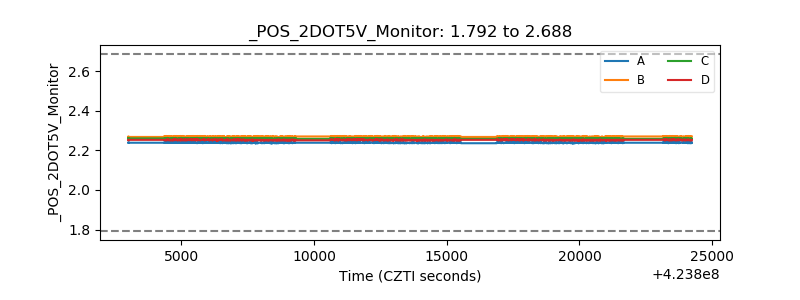 |
| +5 Volts monitor | 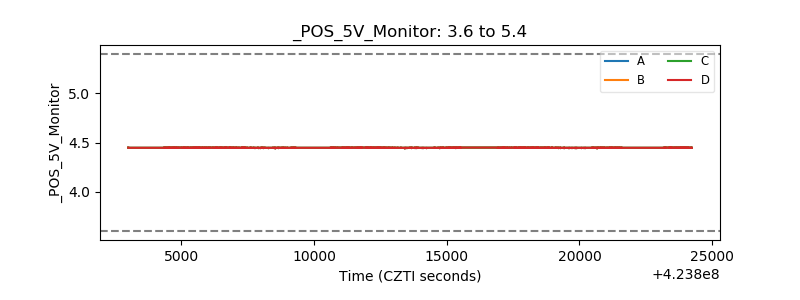 |
| _ROLL_ROT | 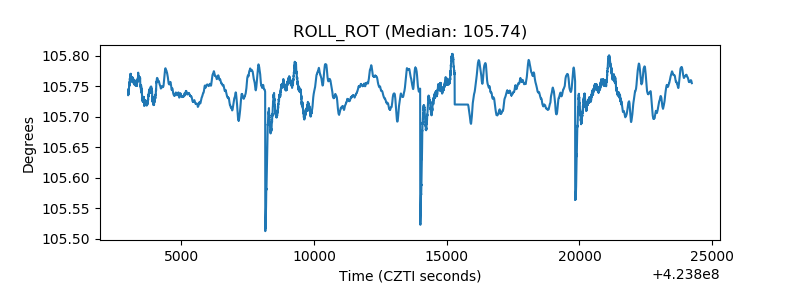 |
| _Roll_DEC | 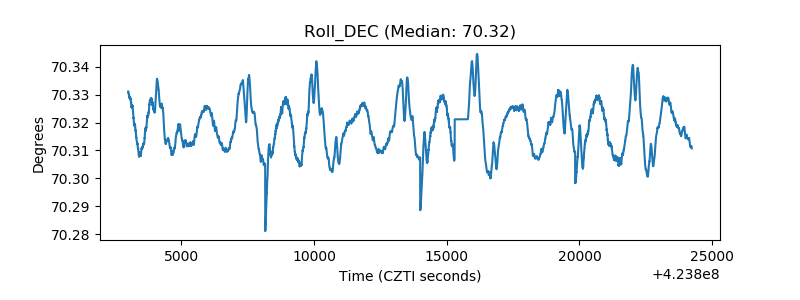 |
| _Roll_RA | 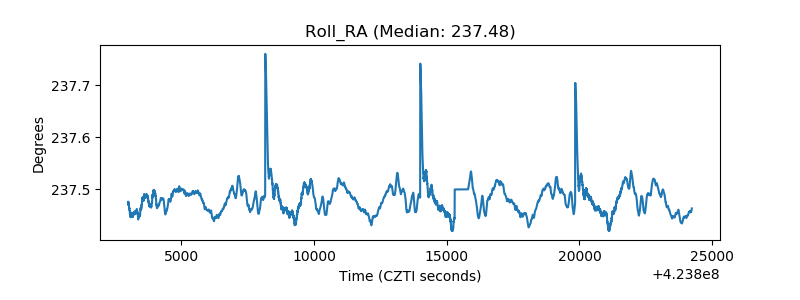 |
| Veto Counter | 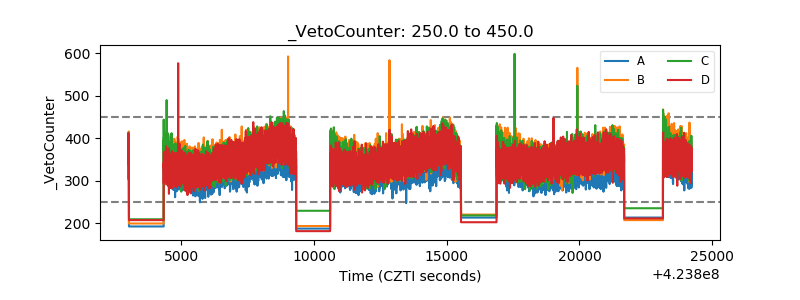 |